Summary
The metabolic pathways encoded by the human gut microbiome constantly interact with host gene products through numerous bioactive molecules1. Primary bile acids (BAs) are synthesized within hepatocytes and released into the duodenum to facilitate absorption of lipids or fat-soluble vitamins2. Some BAs (~5%) escape into the colon, where gut commensal bacteria convert them into a variety of intestinal BAs2 that are important hormones regulating host cholesterol metabolism and energy balance via several nuclear receptors and/or G protein–coupled receptors3,4. These receptors play pivotal roles in shaping host innate immune responses1,5. However, the impact of this host–microbe biliary network on the adaptive immune system remains poorly characterized. Here we report that both dietary and microbial factors influence the composition of the gut BA pool and modulate an important population of colonic Foxp3+ regulatory T cells (Tregs) expressing the transcriptional factor RORγ. Genetic abolition of BA metabolic pathways in individual gut symbionts significantly decreases this Treg population. Restoration of the intestinal BA pool increases colonic RORγ+ Treg levels and ameliorates host susceptibility to inflammatory colitis via BA nuclear receptors. Thus, a pan-genomic biliary network interaction between hosts and their bacterial symbionts can control host immunologic homeostasis via the resulting metabolites.
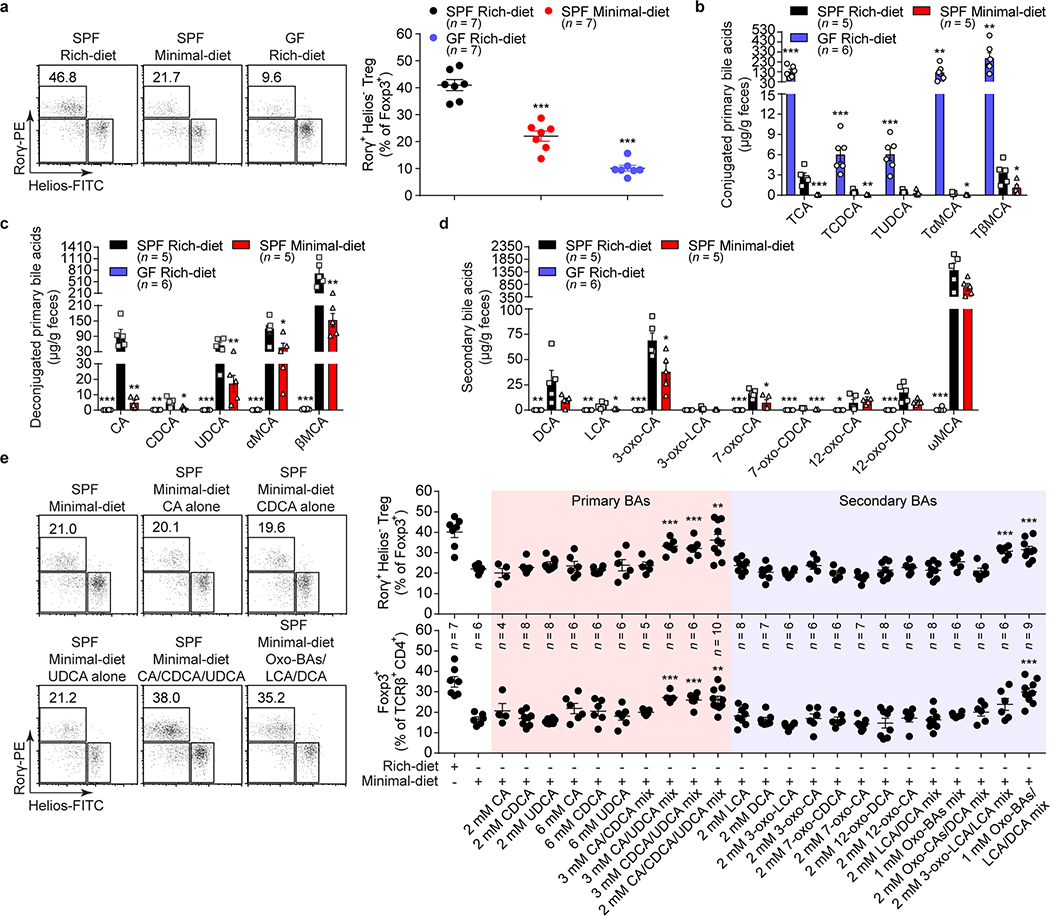
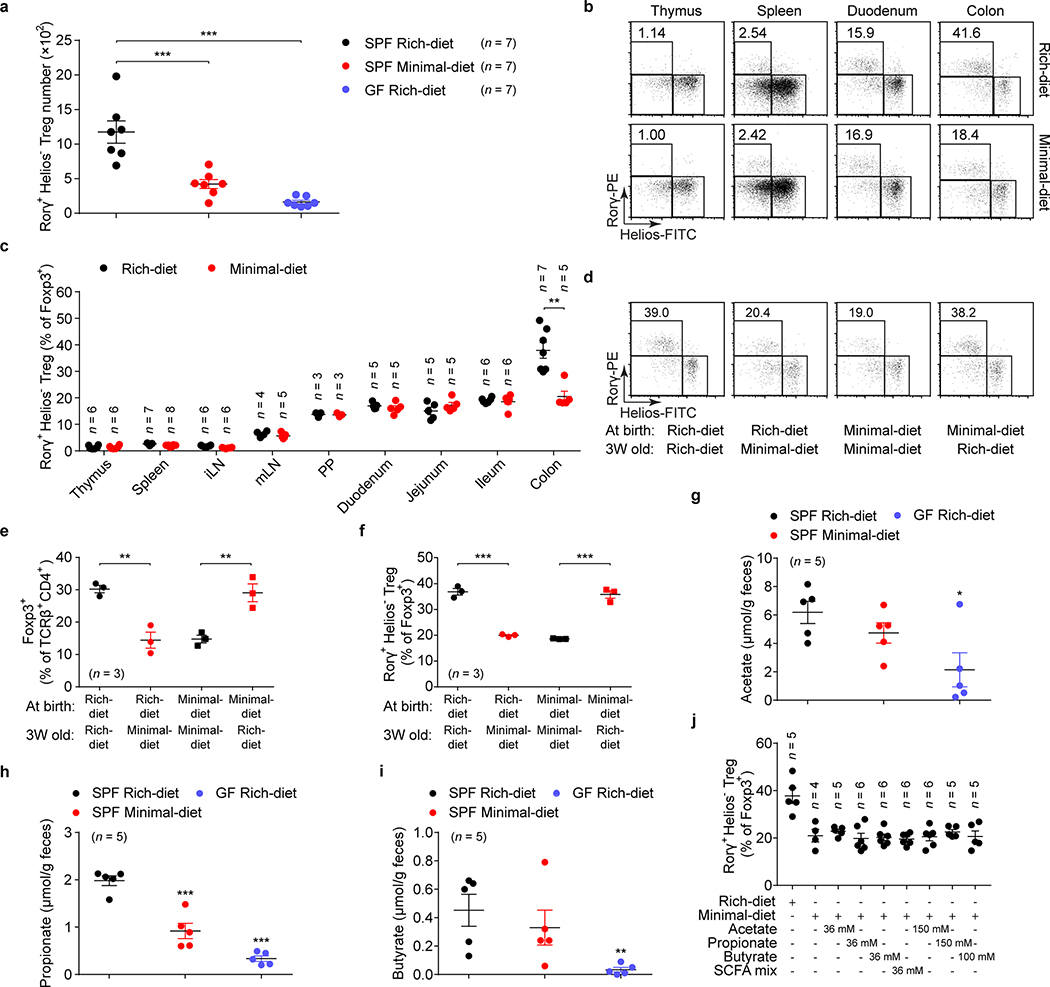
Foxp3+ Tregs residing in the gut lamina propria (LP) are critical in regulating intestinal inflammation6,7. A distinct Treg population expressing the transcriptional factor RORγ is induced in the colonic LP by colonization with gut symbionts8–13. Unlike thymic Tregs, colonic RORγ+ Tregs have a distinct phenotype (Helios– and Nrp1–), and their accumulation is influenced by enteric factors derived from diet or commensal colonization8,9. We hypothesized that intestinal bacteria facilitate the induction of RORγ+ Tregs by modifying metabolites resulting from the host’s diet, and analyzed RORγ+Helios– cells in the colonic Treg population from specific pathogen–free (SPF) mice fed different diets—i.e., a nutrient-rich diet or a minimal diet (Supplementary Table 1). We compared RORγ+ Tregs in these groups with those in germ-free (GF) mice fed a nutrient-rich diet (Fig. 1a). Both minimal-diet SPF mice and rich-diet GF mice had a lower level of RORγ+Helios– cells in the colonic Treg population than did rich-diet SPF mice (Fig. 1a, Extended Data Fig. 1a). The effect of diet on Treg homeostatic proportions was limited to the colon and was not observed in other regions of the intestinal tract (duodenum, jejunum, ileum) or in other lymphoid organs (thymus, spleen, lymph nodes, Peyer’s patches [PPs]) (Extended Data Fig. 1b, c). When diets were switched from minimal to nutrient-rich, colonic RORγ+ Treg frequency was reversed (Extended Data Fig. 1d–f). This finding suggested that dietary components or their resulting products bio-transformed by the host and its bacterial symbionts are likely responsible for induction of colonic RORγ+ Tregs. Consistent with our previous findings8, we determined that, in our mouse colony, short chain fatty acids alone appear to be irrelevant to the accumulation of colonic RORγ+ Tregs (Extended Data Fig. 1g–j).
Fig. 1. Gut bile acid metabolites are essential for colonic RORγ+ Treg maintenance.
(a) Beginning at 3 weeks of age, 3 groups of mice were fed special diets for 4 weeks. SPF mice were fed either a nutrient-rich or a minimal diet, and GF mice were fed the nutrient-rich diet. Representative plots and frequencies of RORγ+Helios– in the Foxp3+CD4+TCRβ+ Treg population are shown. (b–d) LC/MS quantitation of fecal conjugated primary BAs (b), deconjugated primary BAs (c), and secondary BAs (d) from groups of mice fed as in a. The BAs determined were cholic acid (CA), chenodeoxycholic acid (CDCA), ursodeoxycholic acid (UDCA), α-muricholic acid (αMCA), β-muricholic acid (βMCA), deoxycholic acid (DCA), lithocholic acid (LCA), 3-oxo-cholic acid (3-oxo-CA), 3-oxo-lithocholic acid (3-oxo-LCA), 7-oxo-cholic acid (7-oxo-CA), 7-oxo-chenodeoxycholic acid (7-oxo-CDCA), 12-oxo-cholic acid (12-oxo-CA), 12-oxo-deoxycholic acid (12-oxo-DCA), ω-muricholic acid (ωMCA), and taurine-conjugated species (TCA, TCDCA, TUDCA, TαMCA, and TβMCA). (e) Three-week-old SPF mice were fed a nutrient-rich diet, a minimal diet, or a minimal diet supplemented with one or more primary or secondary bile acids in drinking water for 4 weeks. Representative plots and frequencies of RORγ+Helios– in the Foxp3+CD4+TCRβ+ Treg population and of Foxp3+ in the CD4+TCRβ+ population are shown. The BAs used in the feed were CA, CDCA, UDCA, DCA, LCA, 3-oxo-CA, 3-oxo-LCA, 7-oxo-CA, 7-oxo-CDCA, 12-oxo-CA, 12-oxo-DCA, and various indicated BA combinations. Data are representative of at least two independent experiments in a-d, Data are pooled from three independent experiments in e. n represents biologically independent animals. Bars indicate mean ± SEM values. ∗p < 0.05, ∗∗p < 0.01, and ∗∗∗p < 0.001 in one-way analysis of variance followed by the Bonferroni post hoc test.
As intestinal BAs are important metabolites affected by the host’s diet and modified by gut bacteria, we checked the intestinal BA contents of these mice (Supplementary Table 2). The level of murine conjugated primary BAs (TCA, TCDCA, TMCAs, and TUDCA14) was greatly reduced in the feces of minimal-diet SPF mice (Fig. 1b). Not surprisingly, the GF mice had accumulated conjugated primary BAs (Fig. 1b). However, along with the reduced RORγ+ Treg population, levels of fecal deconjugated primary BAs and secondary BAs were significantly lower in both minimal-diet SPF mice and rich-diet GF mice than in rich-diet SPF mice (Fig. 1c, d). These results suggested that host BAs generated in response to diet and bio-transformed by bacteria may induce colonic RORγ+ Tregs.
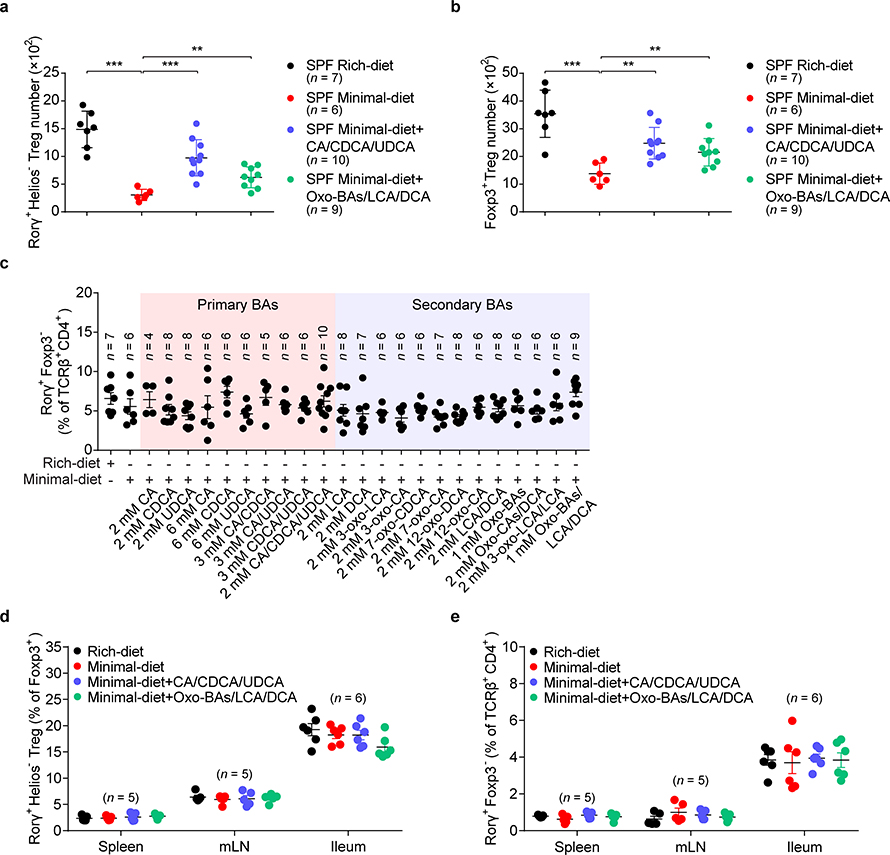
To directly test whether BA metabolites regulate colonic RORγ+ Tregs, we supplemented the drinking water of minimal-diet SPF mice with either individual or combinations of BAs (Fig. 1e). Neither individual primary nor secondary BAs rescued levels of colonic RORγ+ Tregs or total Foxp3+ Tregs. However, mixtures of certain murine primary BAs (cholic/ursodeoxycholic acids, chenodeoxycholic/ursodeoxycholic acids, or cholic/chenodeoxycholic/ursodeoxycholic acids) restored colonic frequencies of both RORγ+ Tregs and Foxp3+ Tregs close to that in rich-diet mice (Fig. 1e, Extended Data Fig. 2a, b). Similarly, a mixture of eight representative secondary BAs from bacterial oxidation and dehydroxylation pathways significantly increased the level of colonic RORγ+ Tregs and Foxp3+ Tregs in minimal-diet mice (Fig. 1e, Extended Data Fig. 2a, b). We tested several more combinations of secondary BAs and found that only a combination of lithocholic/3-oxo-lithocholic acids restored colonic RORγ+ Treg levels (Fig. 1e). No similar impact of these BAs was found on colonic Th17 cells (Extended Data Fig. 2c) or on RORγ+ Tregs or Th17 cells from the spleen, mesenteric lymph node (mLN), or small intestine (Extended Data Fig. 2d, e). These results indicated that certain primary and secondary BA species within a BA pool preferentially regulate RORγ+ Tregs and that modulation of this Treg population by BAs is both cell-type and tissue-type specific.
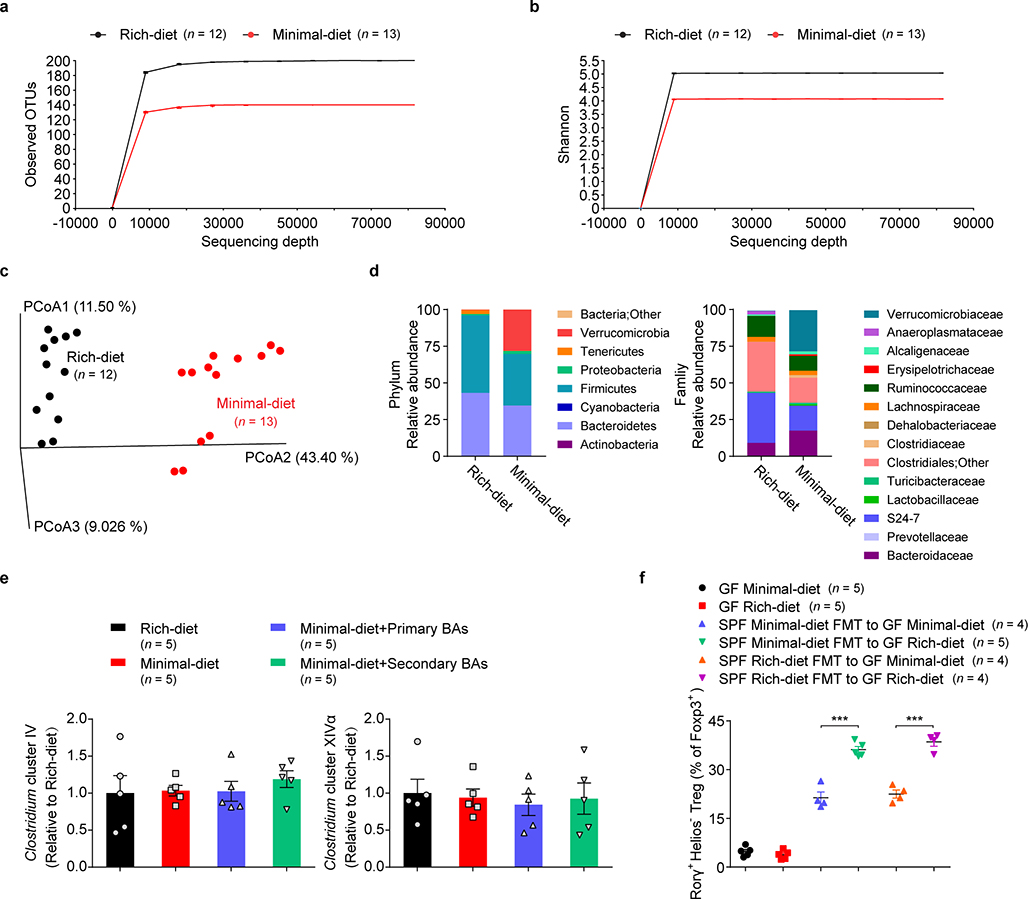
As colonic BAs are derived mainly from bacterial biomodifications2, we sought to determine how BA-producing bacteria regulate colonic RORγ+ Tregs. Although gut microbiota composition reorganized in minimal-diet mice (Extended Data Fig. 3a–c), BA-metabolizing bacteria—e.g., Bacteroidetes and Firmicutes—remained the dominant phyla within the minimal-diet mouse intestine (Extended Data Fig. 3d). Neither dietary alteration nor BA supplementation affected the level of recognized secondary BA-generating bacteria—i.e., Clostridium cluster IV or XIVα—in colons of these mice (Extended Data Fig. 3e), a result implying that the decrease of RORγ+ Tregs in minimal-diet mice is not due to the loss of BA-producing bacteria. Minimal-diet GF mice had low levels of colonic RORγ+ Tregs, as did rich-diet GF mice (Extended Data Fig. 3f). Transferring the gut microbiota from minimal-diet SPF mice into rich-diet GF mice—but not transfer into minimal-diet GF mice—fully restored the frequencies of colonic RORγ+ Tregs (Extended Data Fig. 3f). These results suggested that switching diet alone is insufficient to tune RORγ+ Tregs, while, in response to dietary stimuli, bacteria within the gut modulate this Treg population.
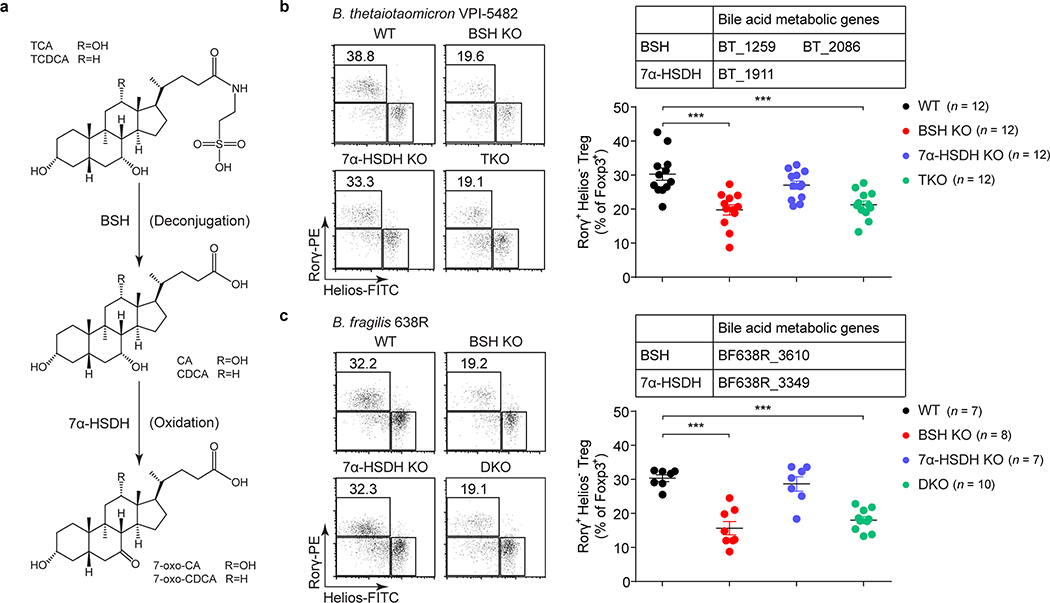
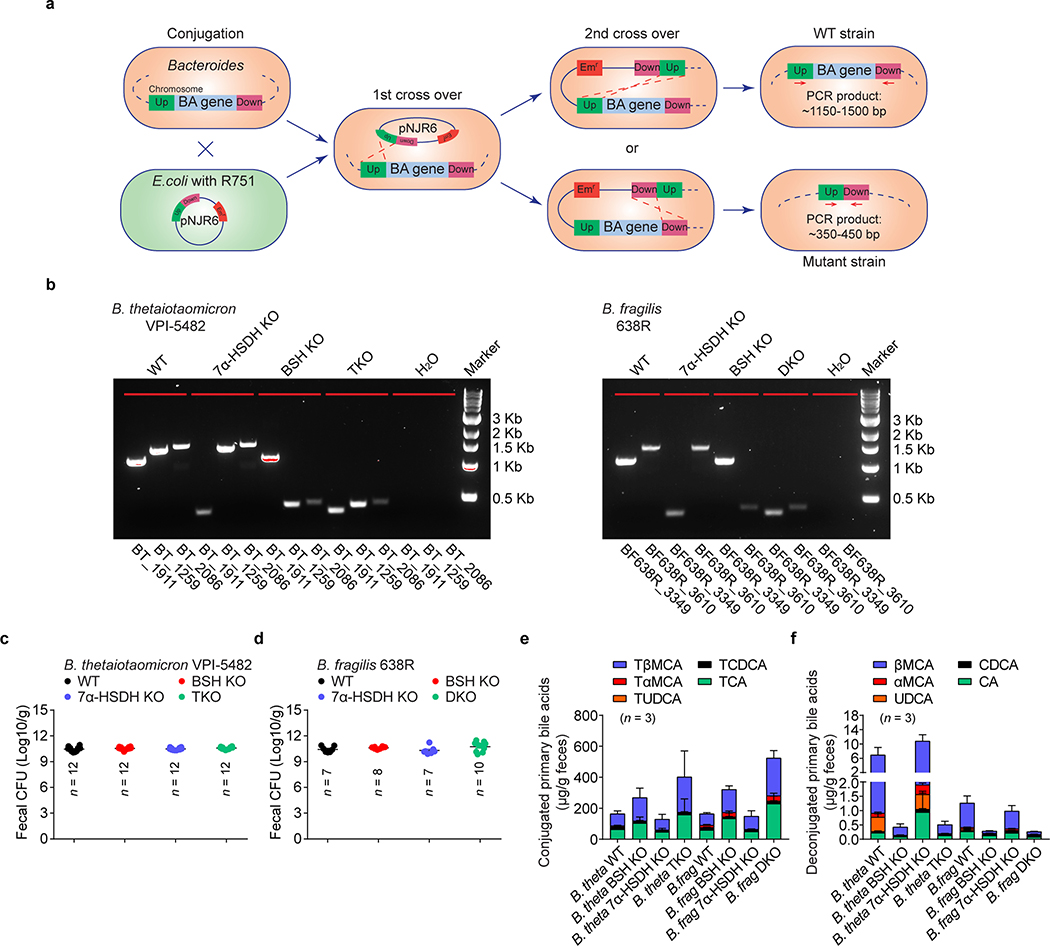
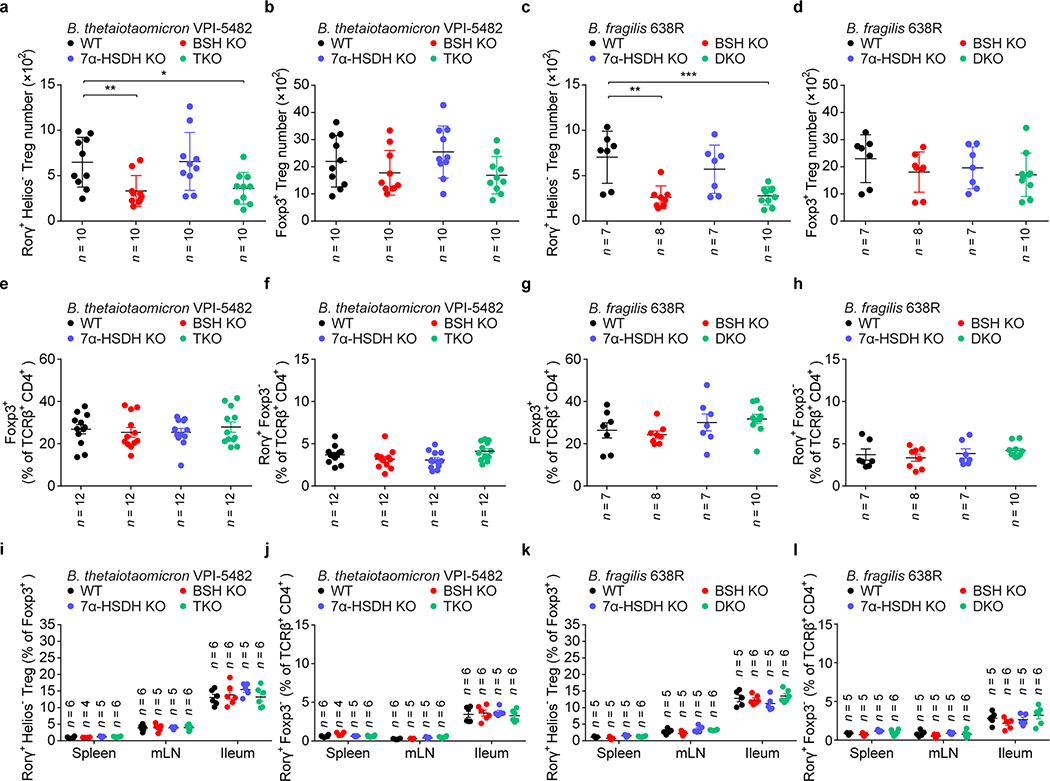
Several phyla and genera of human gastrointestinal bacteria can induce RORγ+ Tregs, and these same microbes can also salvage conjugated BAs escaping from active transport in the ileum and convert them into a variety of BA derivatives2,15,16. We hypothesized that BA metabolic pathways in these bacteria are involved in induction of colonic RORγ+ Tregs. We chose two RORγ+ Treg inducers—Bacteroides thetaiotaomicron and Bacteroides fragilis—to test this hypothesis, as they harbor simple BA metabolic pathways and are genetically tractable17 (Fig. 2a). Using suicide vector pNJR6 for Bacteroides spp.18, we knocked out the genes responsible for both BA deconjugation (bile salt hydrolase, BSH) and oxidation of hydroxy groups at the C-7 position (7α-hydroxysteroid dehydrogenase, 7α-HSDH) (Extended Data Fig. 4a, b). A genetic deficiency of the BA metabolic genes in these two species did not affect the ability of bacteria to colonize GF mouse colons (Extended Data Fig. 4c, d). Knockout of BSH genes in these species altered the BA pool in monocolonized GF mice and impaired in vivo deconjugation of BAs (Extended Data Fig. 4e, f). These results were consistent with a recent report on the functions of BSH in Bacteroides spp.15. Interestingly, we detected no BA changes after deletion of genes responsible for 7α-HSDH, indicating that in these bacterial species, 7α-oxidation may not play a major role in BA metabolism. Elimination of BSH or the entire BA metabolic pathway in Bacteroides species—a triple knockout in B. thetaiotaomicron or a double knockout in B. fragilis—dampened bacterial ability to induce colonic RORγ+ Tregs (Fig. 2b, c, Extended Data Fig. 5a, c). In contrast, 7α-HSDH mutants elicited levels of colonic RORγ+ Tregs comparable to those induced by wild-type Bacteroides species (Fig. 2b, c, Extended Data Fig. 5a, c). As Bacteroides spp. do not harbor typical biotransformation pathways for secondary BA generation2, the decrease of RORγ+ Tregs in BSH mutant–associated GF mice indicated a direct role for primary BAs in regulating this Treg population. Deletion of BA biotransformation pathways in Bacteroides species did not alter the ability of these species to induce colonic total Foxp3+ Tregs, colonic Th17 cells (Extended Data Fig. 5b, d–h), or Tregs and Th17 cells in the spleen, mLN, and small intestine (Extended Data Fig. 5i–l).
Fig. 2. Gut bacteria control colonic RORγ+ Tregs through their bile acid metabolic pathways.
(a) Schematic diagram of BA metabolic pathways in B. thetaiotaomicron and B. fragilis. (b) Each of 4 groups of GF mice was colonized with one of the following microbes for 2 weeks: 1) a wild-type (WT) strain of B. thetaiotaomicron; 2) a BSH mutant strain (BSH KO, in which both the BT_1259 and BT_2086 genes are deleted); 3) a 7α-HSDH mutant strain (7α-HSDH KO, in which the BT_1911 gene is deleted); or 4) a triple-mutant strain (TKO, in which all three genes are deleted). Representative plots and frequencies of RORγ+Helios– in the Foxp3+CD4+TCRβ+ Treg population are shown. (c) Each of 4 groups of GF mice was colonized with one of the following microbes for 2 weeks: 1) a WT strain of B. fragilis; 2) a BSH KO strain (in which the BF638R_3610 gene is deleted); 3) a 7α-HSDH KO strain (in which the BF638R_3349 gene is deleted); or 4) a double-mutant strain (DKO, in which both genes are deleted). Colonic Tregs were analyzed as in b. Data are pooled from three independent experiments in b, c. n represents biologically independent animals. Bars indicate mean ± SEM values in b, c. ∗∗∗p < 0.001 in one-way analysis of variance followed by the Bonferroni post hoc test.
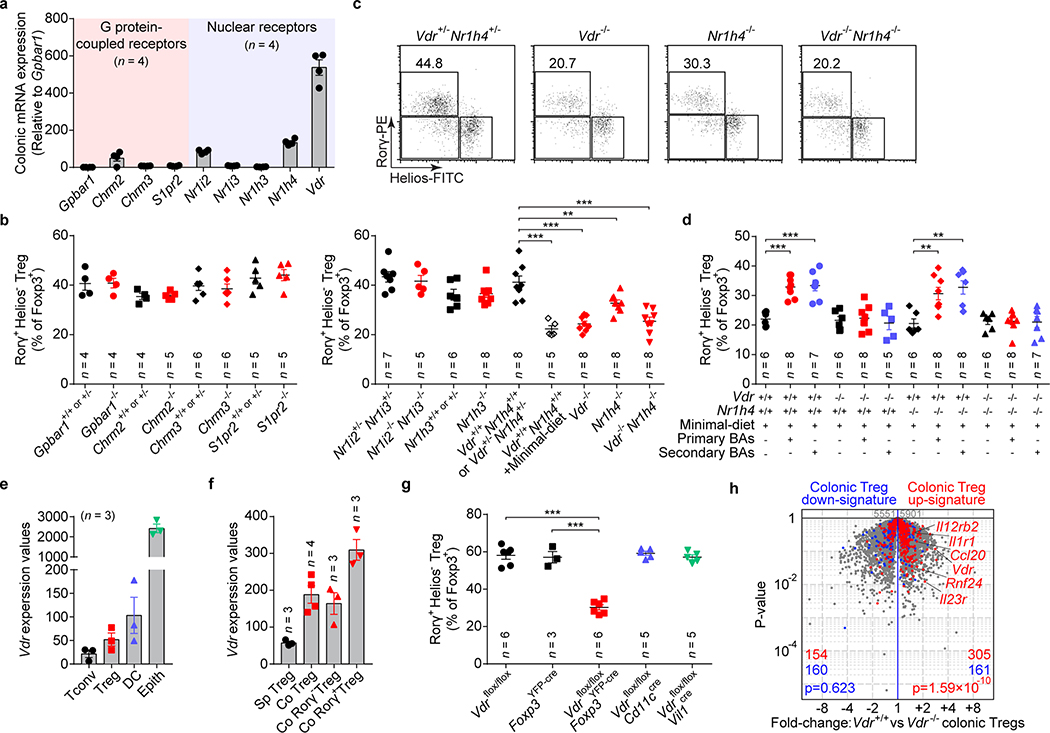
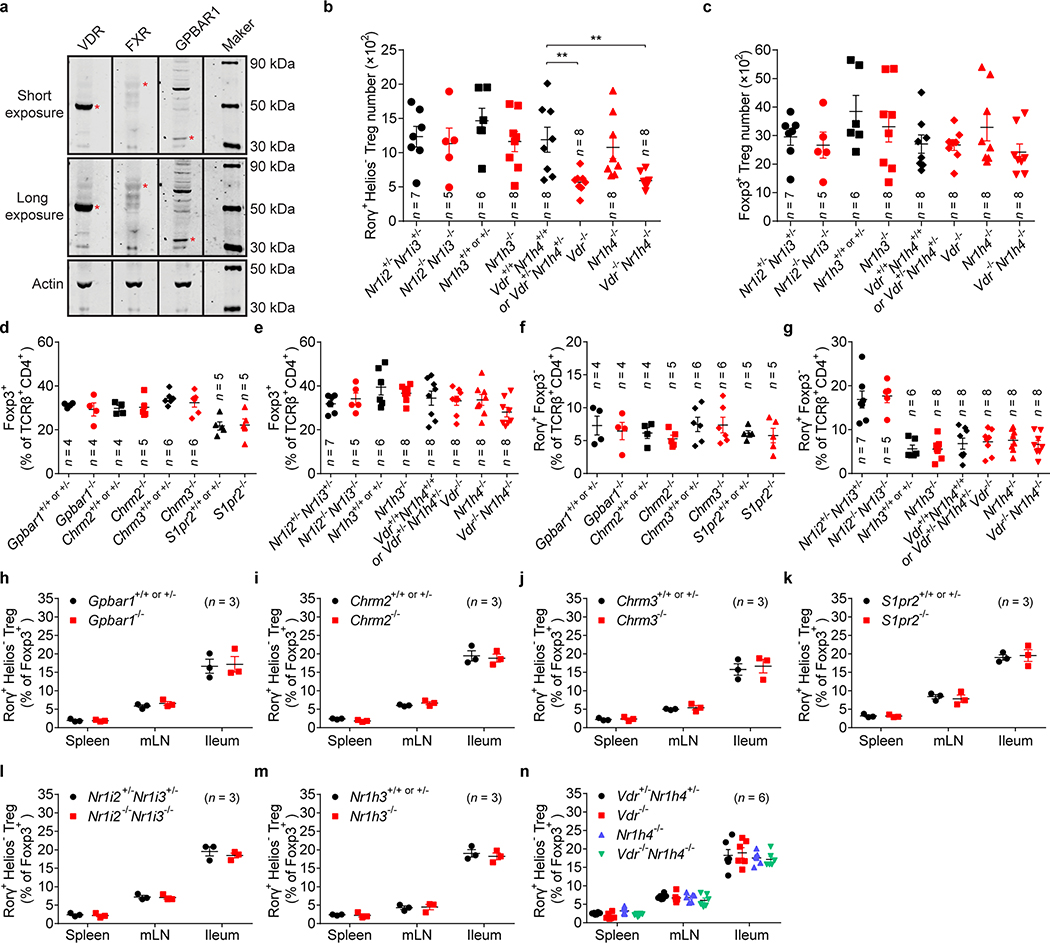
Host BAs are metabolically modified by microbes and used as signaling molecules, serving as ligands that activate BA receptors (BARs)4. Thus, we explored whether BARs modulate gut RORγ+ Treg homeostasis. By comparing mouse colonic tissue expression of various BARs, we found that nuclear receptors, especially VDR, were more abundant (Fig. 3a, Extended Data Fig. 6a). Next, we compared the levels of colonic RORγ+ Tregs in mice genetically deficient in each of several BARs. G protein–coupled receptor deficiency did not affect the level of colonic RORγ+ Tregs (Fig. 3b). The nuclear receptors NR1I2/3 (PXR/CAR) and NR1H3 (LXRα) were also non-contributory (Fig. 3c, Extended Data Fig. 6b). However, deficiency in either of two BA-sensing nuclear receptors—VDR and NR1H419,20—compromised the level of colonic RORγ+ Tregs (Fig. 3c, Extended Data Fig. 6b). The colonic RORγ+ Treg phenotype of mice deficient in both of these genes resembled that of mice deficient in only Vdr or minimal-diet littermate controls (Fig. 3c, Extended Data Fig. 6b). This result indicated a prominent role for VDR signaling in modulating this colonic Treg population. That all BAR-deficient mice had normal colonic levels of total Foxp3+ Tregs and Th17 cells (Extended Data Fig. 6c–g) as well as RORγ+ Tregs in the spleen, mLN, and small intestine (Extended Data Fig. 6h–n) indicated that BAR signaling control of RORγ+ Tregs is tissue dependent.
Fig. 3. Bile acid metabolites modulate colonic RORγ+ Tregs via bile acid receptors.
(a) Quantitative mRNA expression of BA receptors in the colon of SPF mice. (b) Frequencies of colonic RORγ+Helios– in the Foxp3+CD4+TCRβ+ Treg population from mice deficient in G protein–coupled receptors (Gpbar1–/–, Chrm2–/–, Chrm3–/–, and S1pr2–/–) and their littermate controls. (c) Representative plots and frequencies of colonic RORγ+Helios– in the Foxp3+CD4+TCRβ+ Treg population from mice deficient in nuclear receptors (Nr1i2–/–Nr1i3–/–, Nr1h3–/–, Vdr–/–, Nr1h4–/–, and Vdr–/–Nr1h4–/–), their littermate controls, and minimal-diet Vdr+/+Nr1h4+/+ mice. (d) Three-week-old Vdr+/+Nr1h4+/+, Vdr–/–, Nr1h4–/–, and Vdr–/–Nr1h4–/– mice were fed a minimal diet or a minimal diet supplemented with primary BAs (CA/CDCA/UDCA, 2 mM of each) or secondary BAs (DCA/LCA/3-oxo-CA/3-oxo-LCA/7-oxo-CA/7-oxo-CDCA/12-oxo-CA/12-oxo-DCA, 1 mM of each) in their drinking water for 4 weeks. Frequencies of RORγ+Helios– in the Foxp3+CD4+TCRβ+ Treg population are shown. (e) Normalized expression values of Vdr in colonic T conventional cells (Tconv), Foxp3+ Tregs, dendritic cells (DC), and epithelial cells (Epith). (f) Normalized expression values of Vdr in splenic Tregs (Sp Treg), colonic Tregs (Co Treg), colonic RORγ− Tregs (Co RORγ− Treg), and colonic RORγ+ Tregs (Co RORγ+ Treg). (g) Frequencies of colonic RORγ+Helios– in the Foxp3+CD4+TCRβ+ Treg population from Vdrflox/floxFoxp3YFP-cre, Vdrflox/floxCd11ccre, Vdrflox/floxVil1cre mice and from Vdrflox/flox and Foxp3YFP-cre mice. (h) Volcano plots comparing transcriptomes of colonic Tregs from Vdr+/+Foxp3mRFP or Vdr–/–Foxp3mRFP mice (n = 3). Colonic Treg signature genes are highlighted in red (up-regulated) or blue (down-regulated). Data are pooled from two or three independent experiments. n represents biologically independent animals. Bars indicate mean ± SEM values. ∗∗p < 0.01 and ∗∗∗p < 0.001 in one-way analysis of variance followed by the Bonferroni post hoc test in c, d, g or Chi-square test in h.
To determine whether intestinal BAs modulate colonic RORγ+ Tregs via VDR or NR1H4, we treated nuclear receptor–deficient mice with a mixture of three murine primary BAs (cholic/chenodeoxycholic/ursodeoxycholic acids) or a mixture of eight murine secondary BAs (deoxycholic/lithocholic acids/oxidized-bile acids). Both mixtures of BAs were sufficient to rescue colonic frequencies of RORγ+ Tregs in minimal-diet Nr1h4-deficient mice and their littermate controls (Fig. 3d). However, the failure of BA supplementation to restore colonic RORγ+ Treg levels in both minimal-diet Vdr-deficient mice and minimal-diet double-deficient (Vdr/Nr1h4) mice (Fig. 3d) implied a major role for the microbial BA–VDR axis in regulation of colonic RORγ+ Treg populations.
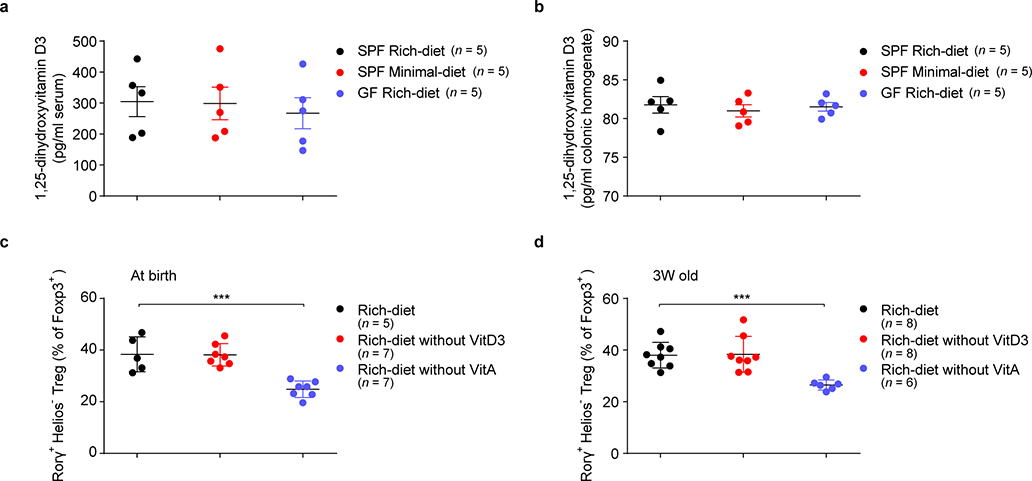
As 1,25-dihydroxyvitamin D3 can also activate VDR19, we compared its levels in sera and colonic tissues from rich-diet and minimal-diet SPF mice and rich-diet GF mice. We found comparable levels among these three groups of mice (Extended Data Fig. 7a, b). We also found that, as previously reported9, dietary vitamin A deficiency led to a decrease in colonic RORγ+ Tregs, while absence of dietary vitamin D3 had no similar effect (Extended Data Fig. 7c, d). These data indicated that the BA–VDR axis, not the vitamin D3–VDR axis, is crucial in modulating RORγ+ Tregs in the gut.
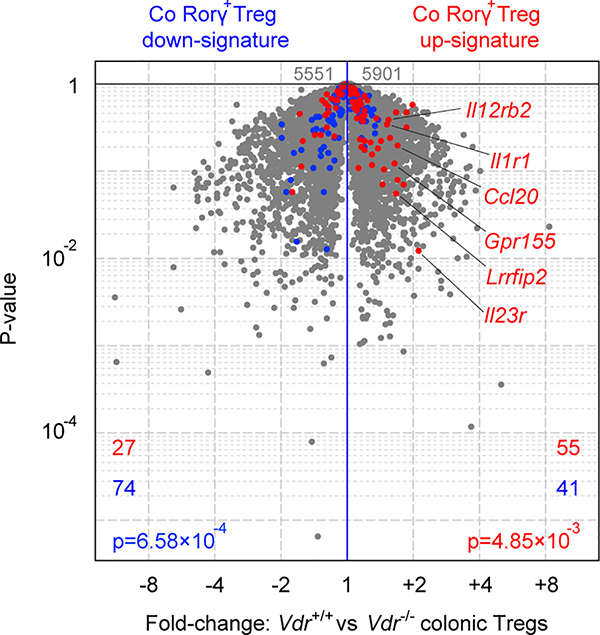
Next, we investigated which cell type responds to BA by affecting the upregulation of RORγ+ Tregs. RNAseq performed on colonic sorted cell fractions revealed high Vdr expression in epithelial and dendritic cells but also in Foxp3+ Tregs—at a higher level than in Tconv cells (Fig. 3e). Indeed, Vdr expression is higher in colonic Tregs than splenic Tregs, especially in RORγ+ Tregs (Fig. 3f). This result is consistent with our earlier single-cell analysis highlighting VDR as a transcriptional regulator in colonic Tregs but not in other tissue Tregs21. To directly assess relevance, we crossed Vdrflox/flox conditional knockout mice with different Cre drivers to excise Vdr in distinct cell types. Colonic RORγ+ Tregs were strikingly reduced in Vdrflox/floxFoxp3YFP-cre mice, while loss of VDR in dendritic or epithelial cells (Cd11ccre, Vil1cre) had no effect (Fig. 3g), demonstrating that VDR modulates colonic RORγ+ Tregs in an intrinsic manner. RNAseq profiling of colonic Tregs from Vdr-deficient mice or control littermates showed a marked reduction in the transcriptional signature of colonic Tregs8 in the absence of VDR (Fig. 3h); the RORγ+ Treg-specific signature was also down-regulated, as expected (Extended Data Fig. 8). These data suggest that VDR is important in determining the RORγ-dependent program in colonic Tregs.
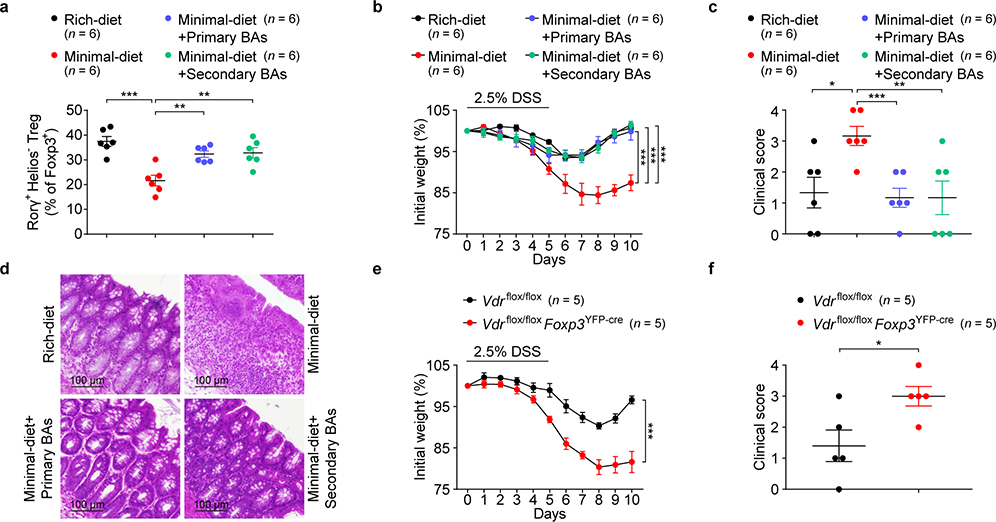
RORγ+ Tregs have been reported to maintain colonic homeostasis and minimize colitis severity8,11,22,23. We investigated whether intestinal BAs modulate colonic inflammatory responses in a dextran sodium sulfate (DSS)-induced murine model of colitis. We saw no sign of inflammation in the colons of unchallenged mice fed a nutrient-rich diet, a minimal diet, or a minimal diet supplemented with primary or secondary BA mixtures in drinking water (Extended Data Fig. 9a–c). However, at the onset of colitis, challenged minimal-diet mice had a reduced proportion of colonic RORγ+ Tregs (Fig. 4a)—an indication that they might be predisposed to severe colitis. Indeed, as DSS-induced colitis progressed, minimal-diet mice lost more weight and experienced severer colitis than rich-diet mice (Fig. 4b–d). Interestingly, both primary and secondary BA supplementation increased RORγ+ Treg levels in minimal-diet mice (Fig. 4a) and alleviated their colitis symptoms and signs (Fig. 4b–d). However, after colitis onset, BA supplementation barely alleviated colitis in minimal-diet mice (Extended Data Fig. 9d, e), suggesting that maintenance of an RORγ+ Treg pool by BAs during homeostasis is crucial to host resistance to DSS colitis. We next explored whether the BA–VDR axis is involved in regulating colitis in mice. As in minimal-diet mice, deficiency of Vdr in mice worsened the DSS-induced colitis phenotype (Extended Data Fig. 10a–c). Consistently, the protective role of VDR signaling was also observed in another mouse colitis model, naive CD4+ T cell adaptive transfer into Rag1-deficient mice (Extended Data Fig. 10d–g). Importantly, severe DSS-induced colitis developed in Vdrflox/floxFoxp3YFP-cre mice (Fig. 4e, f), implying that the BA–VDR axis has an intrinsic role in Treg control of colonic inflammation.
Fig. 4. Bile acids ameliorate gut inflammation.
(a) Frequencies of RORγ+Helios– in the colonic Foxp3+CD4+TCRβ+ Treg population on day 2 of DSS-induced colitis in mice fed a nutrient-rich diet, a minimal diet, or a minimal diet supplemented with mixtures of primary or secondary BAs in drinking water. The primary BAs were CA, CDCA, and UDCA (2 mM of each). The secondary BAs were DCA, LCA, 3-oxo-CA, 3-oxo-LCA, 7-oxo-CA, 7-oxo-CDCA, 12-oxo-CA, and 12-oxo-DCA (1 mM of each). (b) Daily weight loss of mice described in a during the course of DSS-induced colitis. (c) Clinical scores and (d) hematoxylin and eosin–stained histologic sections for representative colons on day 10 of colitis (see b). (e) Daily weight loss of Vdrflox/flox and Vdrflox/floxFoxp3YFP-cre mice during the course of DSS-induced colitis. (f) Clinical scores for representative colons on day 10 of colitis (see e). Data are representative of two or three independent experiments. n represents biologically independent animals. Bars indicate mean ± SEM values in a-c, e, f. ∗p < 0.05, ∗∗p < 0.01, and ∗∗∗p < 0.001 in one-way (a, c) or two-way (b, e) analysis of variance followed by the Bonferroni post hoc test or two-tailed Student’s t test (f).
As important molecular mediators, intestinal BAs are critical in maintaining a healthy colonic RORγ+ Treg pool through BA receptors. Gut bacteria differ in the types and quantities of BA derivatives they can generate. For instance, across different phyla, many gut bacterial species harbor BSH genes that are involved in the primary BA deconjugation process. As their regulation and substrate specificity may vary, both primary and secondary BA metabolic profiles of these bacteria are likely to be affected2,15. Also, the microbial diversity of secondary BA metabolism adds another layer of complexity to BA derivative production in individual species that may ultimately affect their capacity for RORγ+ Treg induction.
In view of the complexity of BA derivatives, our study suggests that dominant intestinal primary BA species—e.g., cholic/chenodeoxycholic/ursodeoxycholic acids—along with certain potent secondary BA species—e.g., lithocholic/3-oxo-lithocholic acids—modulate RORγ+ Tregs through the BA receptor VDR. Dysregulation of intestinal BAs has been proposed as a mediator of the pathogenesis of human inflammatory bowel diseases and colorectal cancers1,24. The essential role of VDR in modulating peripheral RORγ+ Tregs and colitis susceptibility raises the interesting possibility that human Vdr genetic variants associated with inflammatory bowel diseases25 might affect disease susceptibility through improper control of the intestinal Treg pool. Mechanistically, it is intriguing to speculate that the nuclear receptor VDR—a colonic Treg–preferring transcriptional factor21—may modulate colonic Treg homeostasis by coordinating BA signals with transcriptional factor activity. An understanding of the molecular mechanisms underlying the regulation of colonic Tregs by this biliary network between hosts and their associated microbes will be valuable in improving therapy for human gastrointestinal inflammatory disorders.
Methods
Mice and dietary treatments
C57BL/6J wild-type mice were obtained from Jackson, as were Vdr–/–, Nr1h3–/–, Nr1h4–/–, Chrm2–/–, Chrm3–/–, Rag1−/−, Foxp3YFP-cre, Cd11ccre, Vil1cre, and Foxp3mRFP mice. Nr1i2–/–Nr1i3–/– mice were obtained from Taconic. Gpbar1–/– mice were purchased from KOMP Repository. S1pr2–/– mice were kindly provided by Dr. Timothy Hla at Boston Children’s Hospital. Vdrflox/flox mice26 were kindly provided by Dr. David Gardner at University of California, San Francisco, and then crossed with Foxp3YFP-cre, Cd11ccre, or Vil1cre mice to generate the corresponding cell type–specific knockout mice. Vdr–/–Nr1h4–/– mice were obtained by crossing Vdr+/– with Nr1h4+/– mice. Vdr+/+Foxp3mRFP or Vdr–/–Foxp3mRFP reporter mice were generated by crossing Vdr+/– with Foxp3mRFP reporter mice. Sterilized vitamin A-deficient, vitamin D3-deficient, and control diets on a nutrient-rich diet background were purchased from TestDiet. For dietary treatment experiments with BA supplementation, 3-week-old C57BL/6J wild-type mice were fed either a sterilized nutrient-rich diet (LabDiet 5K67) or a minimal diet (TestDiet AIN-76A) for 4 weeks. Some groups of the mice fed a minimal diet were also treated with various BAs (sodium salt form) in drinking water for 4 weeks as described below. The primary BAs tested were cholic acid, chenodeoxycholic acid, and ursodeoxycholic acid (2 mM or 6 mM of a single BA); a mixture of cholic acid and chenodeoxycholic acid (3 mM of each, 6 mM in total); a mixture of cholic acid and ursodeoxycholic acid (3 mM of each, 6 mM in total); a mixture of chenodeoxycholic acid and ursodeoxycholic acid (3 mM of each, 6 mM in total); and a mixture of cholic acid, chenodeoxycholic acid, and ursodeoxycholic acid (2 mM of each, 6 mM in total). The secondary BAs tested were deoxycholic acid, lithocholic acid, 3-oxo-cholic acid, 3-oxo-lithocholic acid, 7-oxo-cholic acid, 7-oxo-chenodeoxycholic acid, 12-oxo-cholic acid, and 12-oxo-deoxycholic acid (2 mM of a single BA); a mixture of deoxycholic acid and lithocholic acid (2 mM of each, 4 mM in total); a mixture of lithocholic acid and 3-oxo-lithocholic acid (2 mM of each, 4 mM in total); a mixture of deoxycholic acid, 3-oxo-cholic acid, 7-oxo-cholic acid, and 12-oxo-cholic acid (2 mM of each, 8 mM in total); a mixture containing the oxo-BAs (1 mM of each, 6 mM in total); and a mixture containing the oxo-BAs, deoxycholic acid, and lithocholic acid (1 mM of each, 8 mM in total). Three-week-old mice fed a minimal diet were also treated with SCFAs (sodium salt form) in drinking water. The SCFAs tested were acetate and propionate (36 mM or 150 mM of either SCFA); butyrate (36 mM or 100 mM); and a combination of acetate, propionate, and butyrate (36 mM of each, 108 mM in total). Fresh drinking water was supplied each week. Pregnant C57BL/6J wild-type mice were also fed a sterilized nutrient-rich diet or a minimal diet during gestation and nursing, and their offspring were exposed to the same diet until weaning at ~3 weeks of age. The offspring were then fed the same diet as their dams or switched to the opposite diet for another 4 weeks before phenotype analysis. Occasional growth restriction in mice fed a minimal diet necessitated their exclusion from all experiments. All mice were housed under the same conditions in SPF facilities at Harvard Medical School (HMS), and littermates from each mouse line were bred as strict controls. GF C57BL/6 mice were obtained from the National Gnotobiotic Rodent Resource Center at the University of North Carolina at Chapel Hill and were maintained in germ-free isolators at HMS. Animal protocol IS00000187–3 and COMS protocol 07–267 were approved by the HMS Institutional Animal Care and Use Committee and the Committee on Microbiological Safety, respectively. All animal studies were performed in compliance with the guidelines of ARRIVE.
Anaerobic bacterial culture
B. thetaiotaomicron VPI-5482 and B. fragilis 638R were grown either on basal medium (protease peptone, 20 g/L; yeast extract, 5 g/L; and NaCl, 5 g/L) supplemented with 0.5% glucose, 0.5% K2HPO4, 0.05% L-cysteine, 5 mg/L hemin, and 2.5 mg/L vitamin K1 or on BBL™ Brucella agar with 5% sheep blood, hemin, and vitamin K1. The bacteria were then cultured under strictly anaerobic conditions (80% N2, 10% H2, 10% CO2) at 37°C in an anaerobic chamber.
Genetical manipulation of bacteria
Deletion mutants of B. thetaiotaomicron VPI-5482 were created by removal of the genes encoding BSHs (BT_1259 and BT_2086), the gene encoding 7α-HSDH (BT_1911), or all three genes. Deletion mutants of B. fragilis 638R were created by removal of the gene encoding BSH (BF638R_3610), the gene encoding 7α-HSDH (BF638R_3349), or both genes. DNA segments (1-kb) upstream and downstream of the region to be deleted were PCR amplified with the following primers: BT_1259 up-forward: 5’-TTTGTCGACTTATATTTTCTTCCAAAACT-3’; BT_1259 up-reverse: 5’- CAAGCTGCTATCAATAATTTCGATTTTTAGTTATA-3’; BT_1259 down-forward: 5’-CTAAAAATCGAAATTATTGATAGCAGCTTGCTGCA-3’; BT_1259 down-reverse: 5’- TTTGGATCCGGGAGGATTCCACATAATAT-3’; BT_2086 up-forward: 5’- TTTGTCGACCATCCAAACCCAGTGTGAAC-3’; BT_2086 up-reverse: 5’- ATAACTAACTATCGAATTACTTCCAAATTAAATAG-3’; BT_2086 down-forward: 5’- TAATTTGGAAGTAATTCGATAGTTAGTTATGTGGT-3’; BT_2086 down-reverse: 5’- TTTGGATCCAAGAGCATAAAGAGCTGTTG-3’; BT_1911 up-forward: 5’- TTTGTCGACTAGGAAAAGAAAAAGTGATC-3’; BT_1911 up-reverse: 5’- CTGTCCGGGGTATATATATGTTGAGAATTTGATGA-3’; BT_1911 down-forward: 5’- AAATTCTCAACATATATATACCCCGGACAGTACAT-3’; BT_1911 down-reverse: 5’- TTTGGATCCAATTTGATATAAGCGTACGA-3’; BF638R_3610 up-forward: 5’- TTTGTCGACTATAGCTGGATGGCTGTTGC-3’; BF638R_3610 up-reverse: 5’- CCTCGGTAGACATTTACTCTTTATATTAAAATGGT-3’; BF638R_3610 down-forward: 5’- TTTAATATAAAGAGTAAATGTCTACCGAGGCAGAT-3’; BF638R_3610 down-reverse: 5’- TTTGGATCCAGAAGAAGAGATTGGTTCAC-3’; BF638R_3349 up-forward: 5’- TTTGTCGACATCCCCGCCTGAGCAAGAAG-3’; BF638R_3349 up-reverse: 5’- TTGATAAGATTCTTTAATAGGATGGTTTTGAGGAT-3’; BF638R_3349 down-forward: 5’- CAAAACCATCCTATTAAAGAATCTTATCAAGTTAC-3’; BF638R_3349 down-reverse: 5’- TTTGGATCCCCTGAGGGGTGGGAGAAACT-3’. PCR products from upstream and downstream regions were further fused together by fusion PCR to generate 2-kb PCR products, which were digested with BamHI and SalI. The digested products were cloned into the appropriate site of Bacteroides suicide vector pNJR6. The resulting plasmids were conjugally transferred into Bacteroides strains by helper plasmid R751, and Bacteroides strains integrated with the plasmids were selected by erythromycin resistance. The integrated Bacteroides strains were passaged for 10 generations without erythromycin selection, and cross-out mutants were determined by PCR with primers targeting the two flanking regions of the indicated genes. PCR of an intact gene plus its flanking regions generated a product of ~1150–1500 bp, while successful deletion of the gene of interest resulted in a PCR amplicon of only ~350–450 bp of its two flanking regions. The double-deletion (DKO) mutant of B. fragilis and the triple-deletion (TKO) mutant of B. thetaiotaomicron were created by subsequent deletion of the indicated genes.
Generation of monocolonized mice
GF C57BL/6J mice were orally inoculated by gavage with a broth-grown single bacterial strain at 4 weeks of age. Each group of mice was then maintained in a gnotobiotic isolator under sterile conditions for 2 weeks. Fecal material was collected and plated 2 weeks after bacterial inoculation to determine colonization levels (CFU/g of feces) and to ensure colonization by a single bacterial strain.
BA extraction and quantitation
Fecal contents from the distal colons of mice were collected and weighed before BA extraction27. In brief, one weighed fecal pellet was resuspended with 500 μl of sterile ddH2O in a 1.5-ml screw-cap conical tube and sonicated for 10 min. The homogenates were centrifuged at 300 g for 5 min, and the supernatants were transferred to a new tube. The remaining material was resuspended in 250 μl of LC-MS-grade methanol containing internal standards and subjected to sonication for another 10 min. The homogenates were also centrifuged at 300 g for 5 min and the supernatants collected and combined, after which another 500-μl volume of sterile ddH2O was added to make a final 1.25-ml solution. The solution was acidified with acetic acid (Sigma) and then loaded onto a methanol-activated C18 column. The column was subsequently washed with 1 ml of 85:15 (vol/vol) H2O/methanol solution, and the BAs were eluted with 2 ml of 25:75 (vol/vol) H2O/methanol solution. The eluted solutions were dried under nitrogen and resuspended in 200 μl of 50:50 (vol/vol) H2O/acetonitrile solution. The samples were kept at –20°C until analyzed. Nineteen synthetic standards (taurocholic acid, taurochenodeoxycholic acid, tauroursodeoxycholic acid, cholic acid, chenodeoxycholic acid, ursodeoxycholic acid, lithocholic acid, and deoxycholic acid from Sigma; tauro-α-muricholic acid, tauro-β-muricholic acid, β-muricholic acid, and ω-muricholic acid from Santa Cruz; α-muricholic acid, 3-oxo-cholic acid, 3-oxo-lithocholic acid, 7-oxo-cholic acid, 7-oxo-chenodeoxycholic acid, 12-oxo-cholic acid, and 12-oxo-deoxycholic acid from Steraloids) were run, and a calibration curve was generated for quantitation. All standards were resuspended in LC-MS-grade acetonitrile and prepared in-phase for analysis. All samples and standards were analyzed by UPLC-ESI-MS/MS (Thermo Scientific Orbitrap Q Exactive with Thermo Vanquish UPLC) with a Phenomenex Kinetex C8 (100 mm × 3 mm × 1.7 μm) column; a 20%–95% gradient of H2O-ACN was used as eluent, with 0.1% formic acid as an additive. Mass spectral data were acquired by a cycle of MS1 scan (range, 300–650), followed by data-dependent MS/MS scanning (ddMS2) of top 5 ions in the pre-generated inclusion list. d4-glycocholic acid and d4-deoxycholic acid served as internal standards for conjugated and unconjugated BAs, respectively.
SCFA extraction and quantitation
Fecal contents from the distal colons of mice were collected and weighed before SCFA extraction. Fecal contents were resuspended in 75% acetonitrile containing three deuterated internal standards (d3-acetate, d5-propionate, and d7-butyrate). Samples were sonicated for 10 min, vortexed, and centrifuged at 8000 g for 5 min. Supernatant was collected and treated with activated charcoal to remove nonpolar lipids by re-centrifuging. Supernatant was then collected, dried under nitrogen, and resuspended in 95% acetonitrile solution. The samples were kept at –20°C until analyzed. All standards were resuspended in UPLC-grade methanol. For HILIC-ESI-MS/MS analysis, a Waters BEH amide HILIC column (2.1 mm × 100 mm × 2.5 μm) was used with a linear gradient of acetonitrile:H2O=95:5 to 60:40 (vol/vol) with 2 mM ammonium formate at pH 9.0. Deproponated anion ([M-H]-) of each SCFA (acetate, propionate, and butyrate) was quantitated in negative ion mode.
MS data acquisition and processing
Each individual species has been matched with its (1) accurate MS1 anion ([M-H]- or [M+HCOO-]), (2) isotope ratio, and (3) LC retention time of authentic standard, for suitable identification and quantitation of level 1 metabolite28. Thermo Xcalibur Suite version 3.0 was used for peak identification and area integration as well as generation of a calibration curve for all synthetic standards. Raw data (integrated ion counts) were converted to absolute amounts by the calibration curve of individual species. Recovery of internal standards of individual samples was also calculated in same procedure. Calculated value was normalized by sample weight and proportion of the injected sample for analysis to generate the desired final concentration (μg/g or μmol/g sample).
Isolation of mouse lymphocytes and flow cytometry
For isolation of LP lymphocytes, colonic and small-intestinal tissues were dissected and fatty portions discarded. PPs were also removed from small intestines for isolation of lymphocytes. The excised intestinal tissues were washed in cold PBS buffer, and epithelia were removed by 500-rpm stirring at 37°C in RPMI medium containing 1 mM EDTA, 1 mM DTT, and 2% (vol/vol) FBS. After 15 min of incubation, the epithelium-containing supernatants were discarded, and the remaining intestinal tissues were washed in RPMI medium with 5% (vol/vol) FBS, further minced into small pieces, and digested by 500-rpm stirring at 37°C in RPMI medium containing collagenase type II (1.5 mg/ml), Dispase II (0.5 mg/ml), and 1.2% (vol/vol) FBS for 40 min. The digested tissues were filtered, and the solutions were centrifuged at 500 g for 10 min in order to collect LP cells. The pellets were resuspended, and the LP lymphocytes were isolated by Percoll (40%/80%) gradient centrifugation. For isolation of PP lymphocytes, the excised PPs were digested in the same medium by 500-rpm stirring at 37°C for 10 min, the digested PPs were filtered, the solutions were centrifuged at 500 g for 10 min, and lymphocytes were collected. Lymph nodes, spleens, and thymuses were mechanically disrupted. Single-cell suspensions were subjected to flow cytometric analysis by staining with antibodies to CD45 (30-F11), CD4 (GK1.5), TCR-β (H57–597), Helios (22F6), RORγ (AFKJS-9), and Foxp3 (FJK-16s). For intracellular staining of transcription factors, cells were blocked with antibody to CD16/32 (2.4G2) and stained for surface and viability markers. Fixation of cells in eBioscience Fix/Perm buffer for 50 min at room temperature was followed by permeabilization in eBioscience permeabilization buffer for 50 min in the presence of antibodies at room temperature. Cells were acquired with a Miltenyi MACSQuant Analyzer, and analysis was performed with FlowJo software.
Murine colitis models and histology
Three-week-old C57BL/6J wild-type mice were fed a sterilized nutrient-rich diet or a minimal diet for 4 weeks. Some groups of the mice fed a minimal diet were also pre-treated with a bile-salt mixture in drinking water for 4 weeks. The mice were next treated with 2.5% DSS (MP Biomedicals) in drinking water for 5 days and then switched back to regular water or bile salts–containing water for another 5 days29. Vdr+/+, Vdr–/–, Vdrflox/flox, and Vdrflox/floxFoxp3YFP-cre mice were treated with 2.5% DSS by the same protocol. The mice were weighed throughout the course of experimental colitis and were sacrificed at specific time points, after which colonic tissue was obtained for histopathologic and FACS analyses. For the T cell adoptive transfer model of colitis29, the indicated splenic naive T cells (TCR-β+CD4+CD25−CD45RBhi) were sorted from 8-week-old Vdr+/+ and Vdr–/– mice by flow cytometry (Astrios, BD Biosciences). Cells (5 × 10⁵ in 200 μl of sterile PBS) were then intraperitoneally injected into Rag1−/− recipient mice. The mice were weighed throughout the T cell colitis model to assess their weight loss. Colonic tissues from both colitis models were dissected and immediately fixed with Bouin’s fixative solution (RICCA) for histologic analyses. Paraffin-embedded sections of colonic tissue were stained with hematoxylin and eosin, and clinical scores were determined by light microscopy30.
RNA isolation and real-time quantitative PCR
Total RNA was extracted from mouse colonic tissues with TRIzol reagent (Invitrogen) according to the manufacturer’s instructions. RNA samples were reverse-transcribed into cDNA with a TaKaRa PrimeScript RT Reagent kit. The cDNA samples were amplified by real-time PCR with a KAPA SYBR FAST qPCR kit on an Eppendorf Realplex2 Mastercycler. The primers for real-time quantitative PCR were as follow: Vdr-forward: 5’-CACCTGGCTGATCTTGTCAGT-3’; Vdr-reverse: 5’-CTGGTCATCAGAGGTGAGGTC-3’; Nr1h3-forward: 5’-TGTGCGCTCAGCTCTTGT-3’; Nr1h3-reverse: 5’-TGGAGCCCTGGACATTACC-3’; Nr1h4-forward: 5’- GAAAATCCAATTCAGATTAGTCTTCAC-3’; Nr1h4-reverse: 5’-CCGCGTGTTCTGTTAGCAT-3’; Nr1i2-forward: 5’-TCTCAGGTGTTAGGTGGGAGA-3’; Nr1i2-reverse: 5’-GCACGGGGGTACAACTGTTA-3’; Nr1i3-forward: 5’- AAATGTTGGCATGAGGAAAGA-3’; Nr1i3-reverse: 5’- CTGATTCAGTTGCAAAGATGCT-3’; Gpbar1-forward: 5’-ATTCCCATGGGGGTTCTG-3’; Gpbar1-reverse: 5’-GAGCAGGTTGGCGATGAC-3’; Chrm2-forward: 5’-AAAGGCTCCTCGCTCCAG-3’; Chrm2-reverse: 5’-AGTCAAGTGGCCAAAGAAACA-3’; Chrm3-forward: 5’-ACTGGACAGTCCGGGAGATT-3’; Chrm3-reverse: 5’-TGCCATTGCTGGTCATATCT-3’; S1pr2-forward: 5’-CCCAACTCCGGGACATAGA-3’; S1pr2-reverse: 5’-ACAGCCAGTGGTTGGTTTTG-3’; Rpl13a-forward: 5’-GGGCAGGTTCTGGTATTGGAT-3’; Rpl13a-reverse: 5’-GGCTCGGAAATGGTAGGGG-3’. Expression of the indicated genes was normalized to the expression of housekeeping gene Rpl13a.
16S rRNA profiling of the gut microbiota
Fecal DNA was extracted from fecal pellets of the indicated mice with a QIAGEN QIAamp® Fast DNA Stool Mini Kit (Ref#51604) according to the manufacturer’s instructions. The DNA samples were stored at −80°C before processing. Purified DNA samples were quantified with a Qubit™ dsDNA HS Assay Kit (Invitrogen, Q32854) and normalized to 6 ng/μl, with subsequent amplification with barcoded primer pairs: 515f PCR forward primer: 5’-AATGATACGGCGACCACCGAGATCTACACGCT TATGGTAATT GT GTGCCAGCMGCCGCGGTAA-3’; 806r PCR reverse primer: 5’-CAAGCAGAAGACGGCATACGAGAT xrefxref AGTCAGTCAG CC GGACTACHVGGGTWTCTAAT-3’ (with xrefxref representing the barcodes). PCR products were quantified with the above Qubit™ kit and then combined into a pool library with equal mass to each sample. The pooled library was purified by AMpure beads (Beckman Coulter, A63880) and then subjected to agarose gel electrophoresis. A DNA band of ~390 bp was dissected and purified with a QIAquick Gel Extraction Kit (Qiagen, 28704). The concentration of the pooled library was measured and normalized to 10 nM. The purified pooled DNA library was qualified by an Agilent High Sensitivity DNA Chip on a bioanalyzer. The quantitated library was then subjected to multiplex sequencing (Illumina MiSeq, 251 nt × 2 pair-end reads with 12 nt index reads). Raw sequencing data were analyzed by QIIME2. In brief, the data were imported into QIIME2 and demultiplexed, a DADA2 pipeline was used for sequencing quality control, and a feature table was constructed with the following options: qiime dada2 denoise-paired—i-demultiplexed-seqs demux.qza—o-table table—o-representative-sequences rep-seqs—p-trim-left-f 0—p-trim-left-r 0—p-trunc-len-f 150—p-trunc-len-r 150. The feature table of the gut microbiota was used for alpha and beta diversity analysis as well as for taxonomic analysis and differential abundance testing.
Fecal bacterial DNA extraction and quantitative PCR analysis
Fecal DNA was extracted from the fecal pellets of indicated mice with a QIAGEN QIAamp® Fast DNA Stool Mini Kit (51604) according to the manufacturer’s instructions. Quantitative PCR analysis was performed with an Eppendorf Realplex2 Mastercycler and a KAPA SYBR FAST qPCR kit. The 16S rRNA gene primers for real-time quantitative PCR were as follows31: total bacteria-forward: 5’-GGTGAATACGTTCCCGG-3’; total bacteria-reverse: 5’-TACGGCTACCTTGTTACGACTT-3’; Clostridium cluster IV-forward: 5’-CCTTCCGTGCCGSAGTTA-3’; Clostridium cluster IV-reverse: 5’-GAATTAAACCACATACTCCACTGCTT-3’; Clostridium cluster XIVα-forward: 5’-AAATGACGGTACCTGACTAA-3’; Clostridium cluster XIVα-reverse: 5’-CTTTGAGTTTCATTCTTGCGAA-3’. The relative quantity of indicated Clostridium clusters was normalized to the total bacteria.
RNAseq and microarray analysis of splenic and colonic cells
Mouse colonic lymphocytes form Vdr+/+Foxp3mRFP or Vdr–/–Foxp3mRFP reporter mice were isolated as described above. Single-cell suspensions were blocked with antibody to CD16/32 (2.4G2) and stained with antibodies to CD45 (30-F11), CD4 (GK1.5), TCR-β (H57–597), CD8α (53–6.7), CD19 (1D3/CD19), CD11c (N418), F4/80 (BM8), and TER-119 (TER-119) and with viability dye. Live Foxp3+ Tregs (CD45+CD19−CD11c−F4/80−TER-119−TCR-β+CD8α−CD4+mRFP+) were double-sorted by flow cytometry (Astrios, BD Biosciences) to achieve 99% purity and directly lysed with TCL buffer (Qiagen, 1031576) containing 1% 2-mercaptoethanol (Sigma-Aldrich, M6250). Colonic live T conventional cells (CD45+CD19−CD11c−F4/80−TER-119−TCR-β+CD8α−CD4+mRFP−) and CD11c+ dendritic cells (CD45+CD19−TCR-β−TER-119−F4/80−CD11c+) were double-sorted at the same time. Colonic epithelial cells (CD45−EpCAM+) were also isolated as described32. Samples lysed in TCL buffer were kept on ice for 5 min, frozen by dye ice, and stored at −80°C before processing. Smart-Seq2 libraries for low-input RNAseq were prepared by the Broad Technology Labs and were subsequently sequenced through the Broad Genomics Platform. In brief, total RNA was extracted and purified by Agencourt RNAClean XP beads (Beckman Coulter, A66514). mRNA was polyadenylated and selected by an anchored oligo (dT) primer and converted to cDNA by reverse transcription. First-strand cDNA was amplified by PCR followed by transposon-based fragmentation with the Nextera XT DNA Library Preparation Kit (Illumina, FC-131–1096). Samples were then amplified with barcoded primers (Illumina P5 and P7 barcodes) by PCR. Pooled samples were subjected to sequencing on an Illumina NextSeq500 (2 × 25 bp reads). Transcripts were quantified by the Broad Technology Labs computational pipeline (Cuffquant version 2.2.133). Normalized reads were further filtered and analyzed by Multiplot Studio in the GenePattern software package. The colonic Treg signatures (FoldChange>2 and p<0.05) and RORγ+ Treg signatures (FoldChange>1.5 and p<0.05)8 were used in the present study. Loss of VDR functional transcripts in all Vdr-deficient cells was confirmed by analysis of a deletion of Vdr exon-3 transcripts in the cells34.
Microarray analysis of splenic and colonic Tregs was described in our previous report (GEO accession: GSE68009)8, and the expression of VDR within these populations was shown in the present study.
ELISA of mouse 1,25-dihydroxyvitamin D3
SPF mice were fed either a nutrient-rich or a minimal diet, and GF mice were fed the nutrient-rich diet as described above. Whole blood was collected in a serum separation tube and allowed to clot for 2 hours at room temperature. The serum was then collected by centrifugation at 10000 rpm for 15 min. Colonic tissues were dissected, weighed, and then homogenized in 500 μl of PBS on ice. The cells were lysed by freeze (liquid nitrogen)/thaw (room temperature) for 3 cycles, and the supernatants were collected by centrifugation at 13000 rpm for 15 min. Serum and colonic levels of 1,25-dihydroxyvitamin D3 in the indicated mice were determined with a Mouse 1,25-dihydroxyvitamin D3 ELISA Kit (LifeSpan BioSciences, LS-F28132) according to the manufacturer’s instructions.
Immunoblot analysis
Mouse colonic tissues were directly lysed with Triton buffer (0.5% Triton X-100 and 20 mM HEPES, pH 7.6) on ice, and the lysates were separated by NuPAGE™ 4–12% Bis-Tris Gel (Invitrogen). Separated proteins were transferred onto iBlot® 2 NC Mini Stacks (Invitrogen) with an iBlot® 2 Dry Blotting System (Invitrogen). The filters were then blocked with Tris-buffered saline with 5% nonfat dry milk (Rockland) plus 0.1% Tween 20 for 1 hour at room temperature. After blocking, the filters were incubated overnight at 4 °C with primary antibodies (1:1000 dilution) to VDR (sc-13133), NR1H4 (sc-25309), GPBAR1 (PA5–23182), or actin (sc-8432) and subsequently washed three times with Tris-buffered saline containing 0.1% Tween 20. The filters were then incubated with IRDye® 680LT secondary antibodies (1:5000 dilution) (LI-COR Biosciences) for 1 hour at room temperature in the dark. After three washes with Tris-buffered saline containing 0.1% Tween 20, the indicated signals were detected with an Odyssey® CLx Fluorescence Imaging System (LI-COR).
Statistical analysis
Results were shown as mean ± SEM values. Differences between groups were evaluated by analysis of variance followed by a Bonferroni post hoc test or by two-tailed Student’s t test with 95% confidence intervals. To determine the enrichment of certain gene signatures in RNA-seq data sets, we used a Chi-square test. p values of < 0.05 were considered statistically significant.
Data availability
The Microarray, RNAseq and 16S rRNA profiling data are available in the NCBI database under accession numbers GSE68009, GSE137405, and PRJNA573477. The MS data are available in the MetaboLights database with the identifier MTBLS1276.
Extended Data
Extended Data Fig. 1. Both dietary and microbial factors control the level of colonic RORγ+ Tregs.
(a) Beginning at 3 weeks of age, 3 groups of mice were fed special diets for 4 weeks. SPF mice were fed either a nutrient-rich or a minimal diet, and GF mice were fed the nutrient-rich diet. Colonic Tregs were analyzed, and absolute numbers of RORγ+Helios– in the Foxp3+CD4+TCRβ+ Treg population are shown. (b, c) Three-week-old SPF mice were fed as in a, and Tregs in different tissues were analyzed after 4 weeks. Representative plots (b) and frequencies of RORγ+Helios– in the Foxp3+CD4+TCRβ+ Treg population (c) are shown. iLN, inguinal lymph nodes; mLN, mesenteric lymph nodes; PP, Peyer’s patches. (d-f) SPF mice were fed a nutrient-rich diet or a minimal diet at birth and were either maintained on that diet or switched to the opposite diet at 3 weeks of age. Colonic Tregs were analyzed after 4 weeks. Representative plots of RORγ+Helios– in the Foxp3+CD4+TCRβ+ Treg population (d), frequencies of Foxp3+ in the CD4+TCRβ+ cell population (e), and RORγ+Helios– in the colonic Foxp3+CD4+TCRβ+ Treg population (f) are shown. (g-i) LC/MS quantitation of fecal acetate (g), propionate (h), and butyrate (i) from SPF mice fed a nutrient-rich diet, or a minimal diet, and from GF mice fed a nutrient-rich diet. (j) Three-week-old SPF mice were fed a nutrient-rich diet, a minimal diet, or a minimal diet supplemented with individual or mixed SCFAs in drinking water. Colonic Tregs were analyzed after 4 weeks. Frequencies of RORγ+Helios– in the Foxp3+CD4+TCRβ+ Treg population are shown. Data are representative of two independent experiments. n represents biologically independent animals. In a, c, e-j, bars indicate mean ± SEM values. ∗p < 0.05, ∗∗p < 0.01, and ∗∗∗p < 0.001 in one-way analysis of variance followed by the Bonferroni post hoc test in a, e-i, or ∗∗p < 0.01 in two-tailed Student’s t test in c.
Extended Data Fig. 2. Intestinal bile acids regulate the level of colonic Tregs.
(a, b) Absolute numbers of RORγ+Helios– in the colonic Foxp3+CD4+TCRβ+ Treg population (a) and of Foxp3+ Tregs in the CD4+TCRβ+ population (b) in SPF mice fed a nutrient-rich diet, a minimal diet, or a minimal diet supplemented with mixtures of primary or secondary BAs in drinking water. The primary BAs were cholic acid (CA), chenodeoxycholic acid (CDCA), and ursodeoxycholic acid (UDCA) (2 mM of each). The secondary BAs were 3-oxo-cholic acid (3-oxo-CA), 3-oxo-lithocholic acid (3-oxo-LCA), 7-oxo-cholic acid (7-oxo-CA), 7-oxo-chenodeoxycholic acid (7-oxo-CDCA), 12-oxo-cholic acid (12-oxo-CA), 12-oxo-deoxycholic acid (12-oxo-DCA), deoxycholic acid (DCA), and lithocholic acid (LCA) (1 mM of each). (c) Three-week-old SPF mice were fed a nutrient-rich diet, a minimal diet, or a minimal diet supplemented with one or more primary or secondary bile acids in drinking water. Colonic Th17 cells were analyzed after 4 weeks. CA, CDCA, UDCA, DCA, LCA, 3-oxo-CA, 3-oxo-LCA, 7-oxo-CA, 7-oxo-CDCA, 12-oxo-CA, 12-oxo-DCA, and the indicated BA combinations were tested. Frequencies of RORγ+Foxp3– in the CD4+TCRβ+ population are shown. (d, e) Three-week-old SPF mice were fed a nutrient-rich diet, a minimal diet, or a minimal diet supplemented with the indicated primary BAs (CA/CDCA/UDCA, 2 mM of each) or secondary BAs (Oxo-BAs/LCA/DCA, 1 mM of each) in drinking water. Tregs and Th17 cells in spleen, mesenteric lymph node (mLN), and ileum were analyzed after 4 weeks. Frequencies of RORγ+Helios– in the Foxp3+CD4+TCRβ+ Treg population (d) and of RORγ+Foxp3– in the CD4+TCRβ+ cell population (e) are shown. Data are pooled from two or three independent experiments. n represents biologically independent animals. Bars indicate SEM values. ∗∗p < 0.01 and ∗∗∗p < 0.001 in one-way analysis of variance followed by the Bonferroni post hoc test in a, b.
Extended Data Fig. 3. Colonic microbial profiling of rich-diet mice versus minimal-diet mice.
(a-d) Three-week-old SPF mice were fed a nutrient-rich diet or a minimal diet, and the microbial compositions in colonic lumen were analyzed after 4 weeks by 16S rRNA sequencing. Observed OTUs (a), Shannon index (b), PCoA analysis (c), and relative abundance of bacteria at the phylum and family levels (d) are shown. (e) Quantitative PCR analysis of 16S rDNA of Clostridium cluster IV and Clostridium cluster XIVα in colonic luminal specimens from SPF mice fed a nutrient-rich diet, a minimal diet, or a minimal diet supplemented with the indicated primary BAs (CA/CDCA/UDCA, 2 mM of each) or secondary BAs (Oxo-BAs/LCA/DCA, 1 mM of each) in drinking water. (f) Four-week-old GF mice or GF mice receiving transferred fecal materials (FMT) from minimal-diet or rich-diet SPF mice were fed a nutrient-rich diet or a minimal diet, and colonic Tregs were analyzed after 2 weeks. Frequencies of colonic RORγ+Helios– in the Foxp3+CD4+TCRβ+ Treg population are shown. Data are pooled from three independent experiments in a-d. Data are representative of two independent experiments in e, f. n represents biologically independent animals. Bars indicate mean ± SEM value, and ∗∗∗p < 0.001 in one-way analysis of variance followed by the Bonferroni post hoc test.
Extended Data Fig. 4. Generation of bile acid metabolic pathway mutants in Bacteroides.
(a) Schematic diagram of pNJR6 suicide vector–mediated BA gene deletion in Bacteroides. (b) Genotyping of B. thetaiotaomicron and B. fragilis BA metabolic pathway mutants by PCR. PCR primers were designed to target the flanking regions of an intact gene. PCR of an untouched gene plus its flanking regions generated a PCR product of ~1150–1500 bp, while deletion of an interested BA metabolic gene resulted in only a ~350- to 450-bp PCR amplicon of its two flanking regions. (c, d) Bacterial load (measured as CFU/g of feces) of B. thetaiotaomicron (c) and B. fragilis (d) BA metabolic pathway mutants and their wild-type (WT) control strains in monocolonized GF mice. (e, f) LC/MC quantitation of fecal conjugated primary BAs (e) and deconjugated primary BAs (f) in GF mice monocolonized with B. thetaiotaomicron or B. fragilis BA metabolic pathway mutants and their wild-type (WT) control strains. Data are representative of two independent experiments in b, e, f. Data are pooled from three independent experiments in c, d. n represents biologically independent animals. Bars indicate mean ± SEM values in c-f.
Extended Data Fig. 5. Gut bacteria modulate colonic RORγ+ Tregs via their bile acid metabolic pathways.
(a, b) Each of 4 groups of GF mice was colonized with one of the following microbes: 1) a wild-type (WT) strain of B. thetaiotaomicron; 2) a BSH mutant strain; 3) a 7α-HSDH mutant strain; or 4) a triple-mutant strain. Colonic Tregs were analyzed after 2 weeks. Absolute numbers of RORγ+Helios– in the colonic Foxp3+CD4+TCRβ+ Treg population (a) and of Foxp3+ Tregs in the CD4+TCRβ+ population (b) are shown. (c, d) Each of 4 groups of GF mice was colonized with one of the following microbes: 1) a WT strain of B. fragilis; 2) a BSH KO strain; 3) a 7α-HSDH KO strain; or 4) a double-mutant strain. Absolute numbers of colonic Tregs are shown as in a, b. (e, f) GF mice were colonized with B. thetaiotaomicron BA metabolic pathway mutants or their wild-type (WT) control strains. Colonic Tregs and Th17 were analyzed after 2 weeks. Frequencies of Foxp3+ in the CD4+TCRβ+ cell population (e) or RORγ+Foxp3– in the CD4+TCRβ+ cell population (f) are shown. (g, h) GF mice were colonized with B. fragilis BA metabolic pathway mutants or their wild-type control strains. Frequencies of colonic Tregs and Th17 are shown as in e, f. (i, j) GF mice were colonized with B. thetaiotaomicron BA metabolic pathway mutants or their wild-type (WT) control strains. Tregs and Th17 cells in the spleen, mesenteric lymph node (mLN), and ileum were analyzed after 2 weeks. Frequencies of RORγ+Helios– in the Foxp3+CD4+TCRβ+ Treg population (i) and RORγ+Foxp3– in the CD4+TCRβ+ cell population (j) are shown. (k, l) GF mice were colonized with B. fragilis BA metabolic pathway mutants or their wild-type control strains. Frequencies of Tregs and Th17 in spleen, mLN, and ileum are shown as in i, j. Data are pooled from two or three independent experiments. n represents biologically independent animals. Bars indicate mean ± SEM values. ∗p < 0.05, ∗∗p < 0.01, and ∗∗∗p < 0.001 in one-way analysis of variance followed by the Bonferroni post hoc test in a, c.
Extended Data Fig. 6. The impact of bile acid receptor deficiency on Tregs or Th17 cells in gut and peripheral lymphoid organs.
(a) Protein expression of VDR, FXR (NR1H4), and GPBAR1 in the colonic tissue of SPF C57BL/6J mice was analyzed by western blot. The red asterisks indicate the corresponding molecular weight of VDR (53 kDa), FXR (69 kDa), and GPBAR1 (33 kDa). For gel source data, see Supplementary Figure 1. (b, c) Absolute numbers of RORγ+Helios– in the colonic Foxp3+CD4+TCRβ+ Treg population (b) and of Foxp3+ Tregs in the CD4+TCRβ+ population (c) from mice deficient in nuclear receptors (Nr1i2–/–Nr1i3–/–, Nr1h3–/–, Vdr–/–, Nr1h4–/–, and Vdr–/–Nr1h4–/–) and their littermate controls. (d, e) Frequencies of Foxp3+ in the CD4+TCRβ+ cell population from mice deficient in G protein-coupled receptors (Gpbar1–/–, Chrm2–/–, Chrm3–/–, and S1pr2–/–) and their littermate controls (d) and from mice deficient in nuclear receptors (Nr1i2–/–Nr1i3–/–, Nr1h3–/–, Vdr–/–, Nr1h4–/–, and Vdr–/–Nr1h4–/–) and their littermate controls (e). (f, g) Frequencies of RORγ+Foxp3– in the CD4+TCRβ+ cell population from mice described in d, e. (h-n) Tregs in the spleen, mesenteric lymph node (mLN), and ileum from the indicated mice were analyzed. Frequencies of RORγ+Helios– in the Foxp3+CD4+TCRβ+ Treg population from Gpbar1–/– (h), Chrm2–/– (i), Chrm3–/– (j), S1pr2–/– (k), Nr1i2–/–Nr1i3–/– (l), Nr1h3–/– (m), and Vdr–/–, Nr1h4–/–, and Vdr–/–Nr1h4–/– (n) mice and their littermate controls are shown. Data are representative of two or three independent experiments in a, d-n, or are pooled from two or three independent experiments in b, c. n represents biologically independent animals. Bars indicate mean ± SEM values. ∗∗p < 0.01 in one-way analysis of variance followed by the Bonferroni post hoc test in b.
Extended Data Fig. 7. Dietary vitamin D3 does not alter the frequency of colonic RORγ+ Tregs.
(a, b) Beginning at 3 weeks of age, 3 groups of mice were fed special diets for 4 weeks. SPF mice were fed either a nutrient-rich or a minimal diet, and GF mice were fed the nutrient-rich diet. The levels of 1,25-dihydroxyvitamin D3 in serum (a) and colon (b) of these mice were determined by ELISA. (c) SPF mice were fed a nutrient-rich diet or a vitamin D3 or a vitamin A deficient-rich diet at birth. Colonic Tregs were analyzed after 7 weeks. Frequencies of RORγ+Helios– in the colonic Foxp3+CD4+TCRβ+ Treg population are shown. (d) SPF mice were fed a nutrient-rich-diet at birth and were either maintained on that diet or switched to a vitamin D3 or vitamin A-deficient rich diet at 3 weeks of age. Colonic Tregs were analyzed after 4 weeks. Frequencies of RORγ+Helios– in the colonic Foxp3+CD4+TCRβ+ Treg population are shown. Data are representative of two independent experiments. n represents biologically independent animals. Bars indicate mean ± SEM values. ∗∗∗p < 0.001 in one-way analysis of variance followed by the Bonferroni post hoc test in c, d.
Extended Data Fig. 8. Comparison of RORγ+ Treg signature genes of colonic Tregs from Vdr+/+ and Vdr–/– mice.
Volcano plots comparing transcriptomes of colonic Tregs from Vdr+/+Foxp3mRFP and Vdr–/–Foxp3mRFP mice (n = 3). Colonic RORγ+ Treg signature genes are highlighted in red (up-regulated) or blue (down-regulated). The number of genes from each signature preferentially expressed by one or the other population is shown at the bottom. Data are pooled from two independent experiments. n represents biologically independent animals. To determine the enrichment of certain gene signatures in RNA-seq data sets, a Chi-square test was used. p values of < 0.05 were considered statistically significant.
Extended Data Fig. 9. BA supplementation does not cause gut inflammation and cannot ameliorate gut inflammation after the development of colitis.
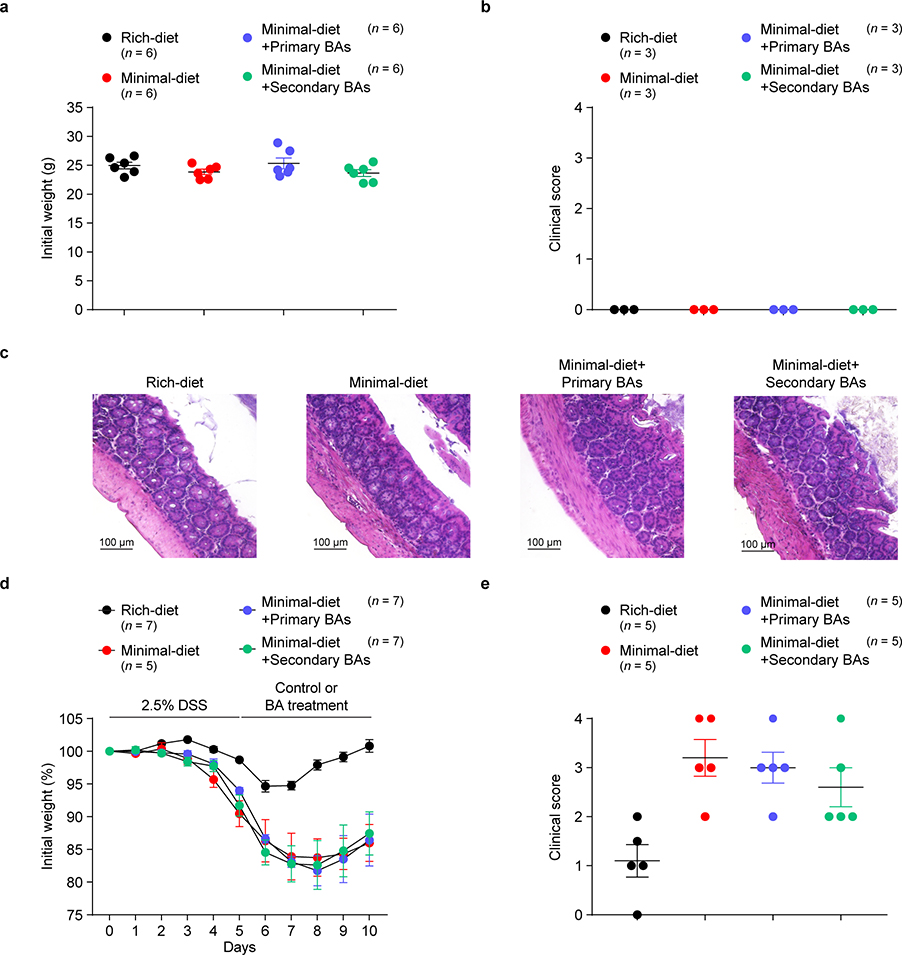
(a-c) Three-week-old SPF mice were fed a nutrient-rich diet, a minimal diet, or a minimal diet supplemented with mixtures of primary BAs (CA/CDCA/UDCA, 2 mM of each) or secondary BAs (Oxo-BAs/LCA/DCA, 1 mM of each) in drinking water. Initial body weights were recorded before DSS challenge (a). Clinical scores (b) and hematoxylin and eosin histology (c) for representative colons from mice not challenged with DSS are shown. (d, e) Three-week-old SPF mice fed a nutrient-rich diet or a minimal diet for 4 weeks were then challenged in the DSS-induced colitis model. After the development of colitis at day 5 of the model, the DSS containing drinking water was switched to regular drinking water or to drinking water supplemented with mixtures of primary or secondary BAs. The primary BAs were CA, CDCA, and UDCA (2 mM of each). The secondary BAs were 3-oxo-CA, 3-oxo-LCA, 7-oxo-CA, 7-oxo-CDCA, 12-oxo-CA, 12-oxo-DCA, DCA, and LCA (1 mM of each). Daily weight loss (d) of mice during the course of DSS-induced colitis and clinical scores (e) on day 10 of colitis are shown. Data are representative of two independent experiments. n represents biologically independent animals. Bars indicate mean ± SEM values in a, b, d, e.
Extended Data Fig. 10. VDR signaling controls gut inflammation.
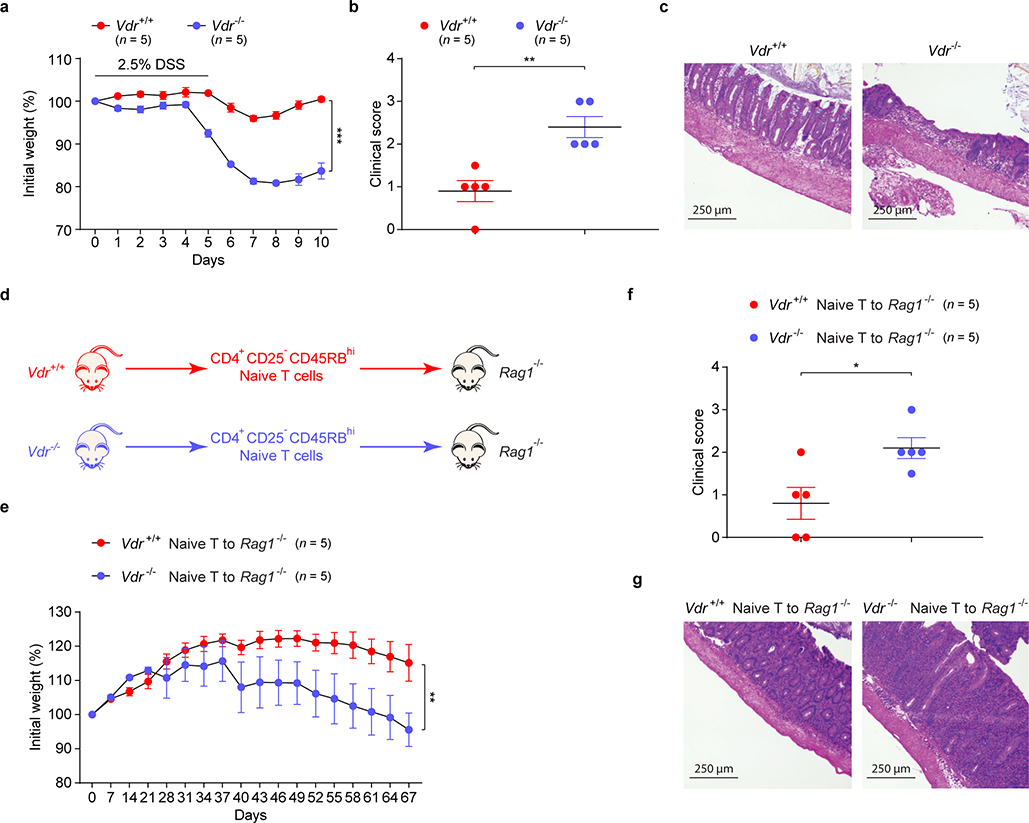
(a-c) Daily weight loss (a) of Vdr+/+ and Vdr–/– mice during the course of DSS-induced colitis. Clinical scores (b) and hematoxylin and eosin histology (c) of representative colons on day 10 of colitis are shown. (d) Schematic representation of the T cell adaptive transfer model of colitis. Rag1–/– mice are transferred with either Vdr+/+ or Vdr–/– naïve T cells. (e-g) Weight loss (e) of Rag1–/– mice in d during the course of T cell adaptive transfer-induced colitis. Clinical scores (f) and hematoxylin and eosin histology (g) of representative colons on day 67 of colitis are shown. Data are representative of two independent experiments. n represents biologically independent animals. Bars indicate mean ± SEM values in a, b, e, f. ∗∗p < 0.01 and ∗∗∗p < 0.001 in two-way analysis of variance followed by the Bonferroni post hoc test in a, e, or ∗p < 0.05 and ∗∗p < 0.01 in two-tailed Student’s t test in b, f.
Supplementary Material
Acknowledgements
We thank Dr. D. Gardner, Dr. Y. Li, and Dr. T. Hla for providing mouse strains and Dr. C. Fu for help with microscope. We also thank T. Sherpa and J. Ramos for help with GF mice and J. McCoy for manuscript editing. This work was supported in part by a Sponsored Research Agreement from UCB Pharma and Evelo Biosciences. S.F.O was supported by NIH K01 DK102771.
Footnotes
Competing Interests
The authors declare no competing interests.
References
- 1.Postler TS & Ghosh S Understanding the Holobiont: How Microbial Metabolites Affect Human Health and Shape the Immune System. Cell metabolism 26, 110–130, doi: 10.1016/j.cmet.2017.05.008 (2017). [DOI] [PMC free article] [PubMed] [Google Scholar]
- 2.Ridlon JM, Kang DJ & Hylemon PB Bile salt biotransformations by human intestinal bacteria. Journal of lipid research 47, 241–259, doi: 10.1194/jlr.R500013-JLR200 (2006). [DOI] [PubMed] [Google Scholar]
- 3.Wahlstrom A, Sayin SI, Marschall HU & Backhed F Intestinal Crosstalk between Bile Acids and Microbiota and Its Impact on Host Metabolism. Cell metabolism 24, 41–50, doi: 10.1016/j.cmet.2016.05.005 (2016). [DOI] [PubMed] [Google Scholar]
- 4.Fiorucci S & Distrutti E Bile Acid-Activated Receptors, Intestinal Microbiota, and the Treatment of Metabolic Disorders. Trends in molecular medicine 21, 702–714, doi: 10.1016/j.molmed.2015.09.001 (2015). [DOI] [PubMed] [Google Scholar]
- 5.Brestoff JR & Artis D Commensal bacteria at the interface of host metabolism and the immune system. Nature immunology 14, 676–684, doi: 10.1038/ni.2640 (2013). [DOI] [PMC free article] [PubMed] [Google Scholar]
- 6.Tanoue T, Atarashi K & Honda K Development and maintenance of intestinal regulatory T cells. Nature reviews. Immunology 16, 295–309, doi: 10.1038/nri.2016.36 (2016). [DOI] [PubMed] [Google Scholar]
- 7.Panduro M, Benoist C & Mathis D Tissue Tregs. Annual review of immunology 34, 609–633, doi: 10.1146/annurev-immunol-032712-095948 (2016). [DOI] [PMC free article] [PubMed] [Google Scholar]
- 8.Sefik E et al. MUCOSAL IMMUNOLOGY. Individual intestinal symbionts induce a distinct population of RORgamma(+) regulatory T cells. Science 349, 993–997, doi: 10.1126/science.aaa9420 (2015). [DOI] [PMC free article] [PubMed] [Google Scholar]
- 9.Ohnmacht C et al. MUCOSAL IMMUNOLOGY. The microbiota regulates type 2 immunity through RORgammat(+) T cells. Science 349, 989–993, doi: 10.1126/science.aac4263 (2015). [DOI] [PubMed] [Google Scholar]
- 10.Geva-Zatorsky N et al. Mining the Human Gut Microbiota for Immunomodulatory Organisms. Cell 168, 928–943 e911, doi: 10.1016/j.cell.2017.01.022 (2017). [DOI] [PMC free article] [PubMed] [Google Scholar]
- 11.Xu M et al. c-MAF-dependent regulatory T cells mediate immunological tolerance to a gut pathobiont. Nature 554, 373–377, doi: 10.1038/nature25500 (2018). [DOI] [PMC free article] [PubMed] [Google Scholar]
- 12.Yissachar N et al. An Intestinal Organ Culture System Uncovers a Role for the Nervous System in Microbe-Immune Crosstalk. Cell 168, 1135–1148 e1112, doi: 10.1016/j.cell.2017.02.009 (2017). [DOI] [PMC free article] [PubMed] [Google Scholar]
- 13.Kim KS et al. Dietary antigens limit mucosal immunity by inducing regulatory T cells in the small intestine. Science 351, 858–863, doi: 10.1126/science.aac5560 (2016). [DOI] [PubMed] [Google Scholar]
- 14.Sayin SI et al. Gut microbiota regulates bile acid metabolism by reducing the levels of tauro-beta-muricholic acid, a naturally occurring FXR antagonist. Cell metabolism 17, 225–235, doi: 10.1016/j.cmet.2013.01.003 (2013). [DOI] [PubMed] [Google Scholar]
- 15.Yao L et al. A selective gut bacterial bile salt hydrolase alters host metabolism. eLife 7, doi: 10.7554/eLife.37182 (2018). [DOI] [PMC free article] [PubMed] [Google Scholar]
- 16.Devlin AS & Fischbach MA A biosynthetic pathway for a prominent class of microbiota-derived bile acids. Nature chemical biology 11, 685–690, doi: 10.1038/nchembio.1864 (2015). [DOI] [PMC free article] [PubMed] [Google Scholar]
- 17.Wexler AG & Goodman AL An insider’s perspective: Bacteroides as a window into the microbiome. Nature microbiology 2, 17026, doi: 10.1038/nmicrobiol.2017.26 (2017). [DOI] [PMC free article] [PubMed] [Google Scholar]
- 18.Stevens AM, Shoemaker NB & Salyers AA The region of a Bacteroides conjugal chromosomal tetracycline resistance element which is responsible for production of plasmidlike forms from unlinked chromosomal DNA might also be involved in transfer of the element. Journal of bacteriology 172, 4271–4279 (1990). [DOI] [PMC free article] [PubMed] [Google Scholar]
- 19.Makishima M et al. Vitamin D receptor as an intestinal bile acid sensor. Science 296, 1313–1316, doi: 10.1126/science.1070477 (2002). [DOI] [PubMed] [Google Scholar]
- 20.Makishima M et al. Identification of a nuclear receptor for bile acids. Science 284, 1362–1365 (1999). [DOI] [PubMed] [Google Scholar]
- 21.DiSpirito JR et al. Molecular diversification of regulatory T cells in nonlymphoid tissues. Science immunology 3, doi: 10.1126/sciimmunol.aat5861 (2018). [DOI] [PMC free article] [PubMed] [Google Scholar]
- 22.Yang BH et al. Foxp3(+) T cells expressing RORgammat represent a stable regulatory T-cell effector lineage with enhanced suppressive capacity during intestinal inflammation. Mucosal immunology 9, 444–457, doi: 10.1038/mi.2015.74 (2016). [DOI] [PubMed] [Google Scholar]
- 23.Britton GJ et al. Microbiotas from Humans with Inflammatory Bowel Disease Alter the Balance of Gut Th17 and RORgammat(+) Regulatory T Cells and Exacerbate Colitis in Mice. Immunity 50, 212–224 e214, doi: 10.1016/j.immuni.2018.12.015 (2019). [DOI] [PMC free article] [PubMed] [Google Scholar]
- 24.Staley C, Weingarden AR, Khoruts A & Sadowsky MJ Interaction of gut microbiota with bile acid metabolism and its influence on disease states. Applied microbiology and biotechnology 101, 47–64, doi: 10.1007/s00253-016-8006-6 (2017). [DOI] [PMC free article] [PubMed] [Google Scholar]
- 25.Xue LN et al. Associations between vitamin D receptor polymorphisms and susceptibility to ulcerative colitis and Crohn’s disease: a meta-analysis. Inflammatory bowel diseases 19, 54–60, doi: 10.1002/ibd.22966 (2013). [DOI] [PubMed] [Google Scholar]
- 26.Chen S et al. Cardiomyocyte-specific deletion of the vitamin D receptor gene results in cardiac hypertrophy. Circulation 124, 1838–1847, doi: 10.1161/CIRCULATIONAHA.111.032680 (2011). [DOI] [PMC free article] [PubMed] [Google Scholar]
- 27.Persson E et al. Simultaneous assessment of lipid classes and bile acids in human intestinal fluid by solid-phase extraction and HPLC methods. Journal of lipid research 48, 242–251, doi: 10.1194/jlr.D600035-JLR200 (2007). [DOI] [PubMed] [Google Scholar]
- 28.Sumner LW et al. Proposed minimum reporting standards for chemical analysis Chemical Analysis Working Group (CAWG) Metabolomics Standards Initiative (MSI). Metabolomics : Official journal of the Metabolomic Society 3, 211–221, doi: 10.1007/s11306-007-0082-2 (2007). [DOI] [PMC free article] [PubMed] [Google Scholar]
- 29.Song X et al. Growth Factor FGF2 Cooperates with Interleukin-17 to Repair Intestinal Epithelial Damage. Immunity 43, 488–501, doi: 10.1016/j.immuni.2015.06.024 (2015). [DOI] [PubMed] [Google Scholar]
- 30.Wirtz S, Neufert C, Weigmann B & Neurath MF Chemically induced mouse models of intestinal inflammation. Nature protocols 2, 541–546, doi: 10.1038/nprot.2007.41 (2007). [DOI] [PubMed] [Google Scholar]
- 31.Atarashi K et al. Induction of colonic regulatory T cells by indigenous Clostridium species. Science 331, 337–341, doi: 10.1126/science.1198469 (2011). [DOI] [PMC free article] [PubMed] [Google Scholar]
- 32.Haber AL et al. A single-cell survey of the small intestinal epithelium. Nature 551, 333–339, doi: 10.1038/nature24489 (2017). [DOI] [PMC free article] [PubMed] [Google Scholar]
- 33.Trapnell C et al. Differential gene and transcript expression analysis of RNA-seq experiments with TopHat and Cufflinks. Nature protocols 7, 562–578, doi: 10.1038/nprot.2012.016 (2012). [DOI] [PMC free article] [PubMed] [Google Scholar]
- 34.Li YC et al. Targeted ablation of the vitamin D receptor: an animal model of vitamin D-dependent rickets type II with alopecia. Proceedings of the National Academy of Sciences of the United States of America 94, 9831–9835, doi: 10.1073/pnas.94.18.9831 (1997). [DOI] [PMC free article] [PubMed] [Google Scholar]
Associated Data
This section collects any data citations, data availability statements, or supplementary materials included in this article.
Supplementary Materials
Data Availability Statement
The Microarray, RNAseq and 16S rRNA profiling data are available in the NCBI database under accession numbers GSE68009, GSE137405, and PRJNA573477. The MS data are available in the MetaboLights database with the identifier MTBLS1276.


