

Abstract
Background
Despite limited and conflicting evidence, hydroxychloroquine, alone or in combination with azithromycin, is widely used in COVID-19 therapy.
Methods
We performed a retrospective study of electronic health records of patients hospitalized with confirmed SARS-CoV-2 infection in US Veterans Health Administration medical centers between March 9, 2020 and April 29, 2020. Patients hospitalized within 24 h of diagnosis were classified based on their exposure to hydroxychloroquine alone (HC) or with azithromycin (HC+AZ) or no HC as treatments. The primary outcomes were mortality and use of mechanical ventilation.
Findings
A total of 807 patients were evaluated. Compared to the no HC group, after propensity score adjustment for clinical characteristics, the risk of death from any cause was higher in the HC group (adjusted hazard ratio [aHR], 1.83; 95% confidence interval [CI], 1.16–2.89; p = 0.009), but not in the HC+AZ group (aHR, 1.31; 95% CI, 0.80–2.15; p = 0.28). Both the propensity-score-adjusted risks of mechanical ventilation and death after mechanical ventilation were not significantly different in the HC group (aHR, 1.19; 95% CI, 0.78–1.82; p = 0.42 and aHR, 2.11; 95% CI, 0.96–4.62; p = 0.06, respectively) or in the HC+AZ group (aHR, 1.09; 95% CI, 0.72–1.66; p = 0.69 and aHR, 1.25; 95% CI, 0.59–2.68; p = 0.56, respectively) compared to the no HC group.
Conclusions
Among patients hospitalized with COVID-19, this retrospective study did not identify any significant reduction in mortality or in the need for mechanical ventilation with hydroxychloroquine treatment with or without azithromycin.
Funding
University of Virginia Strategic Investment Fund
Keywords: COVID-19, SARS-CoV-2, hydroxychloroquine, azithromycin, mortality, ventilation, hazard ratio, retrospective cohort
Graphical Abstract
Highlights
Hydroxychloroquine (HC) use did not reduce the risk of ventilation or death
HC with azithromycin (AZ) did not reduce the risk of ventilation or death
HC, with or without AZ, was associated with longer length of hospital stay
Context and Significance
Despite limited and conflicting evidence, hydroxychloroquine, with or without azithromycin, is extensively used to treat COVID-19. Given the known side effects of these drugs, there is an urgent need to evaluate their effectiveness in COVID-19. In this nationwide retrospective study of patients hospitalized with COVID-19 in the US Veterans Health Administration, the authors found that treatment with hydroxychloroquine, with or without azithromycin, did not reduce the risk of ventilation or death compared to no hydroxychloroquine use. While we await the results of ongoing randomized clinical trials, these results suggest that hydroxychloroquine, with or without azithromycin, may not be beneficial for patients hospitalized with COVID-19. These results do not provide insight into outpatient use of these drugs.
In this nationwide retrospective analysis of 807 patients hospitalized with COVID-19, Magagnoli et al. report that, after adjusting for several COVID-19-relevant clinical and demographic characteristics, hydroxychloroquine use, with or without azithromycin, did not improve mortality or reduce the need for mechanical ventilation compared to no hydroxychloroquine use.
Introduction
The rapidity of the severe acute respiratory syndrome coronavirus 2 (SARS-CoV-2)-induced COVID-19 pandemic has exerted inordinate pressure on clinicians and drug-regulatory agencies throughout the world to expedite development, approval, and deployment of both experimental drugs and repurposing of existing therapeutics. Among the myriad therapeutics advanced as potential repurposing candidates for COVID-19, the antimalarial and immunomodulatory drug hydroxychloroquine has captured great attention. Following the release of initial positive results of hydroxychloroquine in inhibiting SARS-CoV-2 activity in vitro 1 and a small open-label, non-randomized, single treatment center study that reported efficacy of hydroxychloroquine and a potential synergistic effect with the macrolide antibiotic azithromycin in improving viral clearance in COVID-19 patients,2 the US Food and Drug Administration (FDA) used its emergency authority to permit the use of hydroxychloroquine for COVID-19 when clinical trials are unavailable or infeasible.3 However, subsequent studies have not identified a similar benefit of hydroxychloroquine in COVID-19, and others have demonstrated potentially severe toxicities associated with its use.4, 5, 6, 7, 8
The urgency in obtaining definitive information about the efficacy of hydroxychloroquine in COVID-19 triggered an explosion in the number of registered clinical trials testing a variety of regimens and enrolling more than 75,000 patients in North America alone.9 Given the great and immediate need for insights into the clinical outcomes among patients currently treated with hydroxychloroquine, we conducted a retrospective analysis of patients hospitalized with COVID-19 in Veterans Health Administration medical centers across the United States to analyze the associations between hydroxychloroquine and azithromycin use and clinical outcomes. The findings of this study of one of the most complete national datasets in the United States can accelerate our understanding of the outcomes of patients treated with hydroxychloroquine in COVID-19 while we await the results of the ongoing prospective trials.
Results
During the study period, 807 hospitalized patients with laboratory-confirmed COVID-19 who met the inclusion criteria were included in the study. The baseline demographics, comedications, comorbidities, and clinical and laboratory characteristics are presented in Table 1 . The median ages in years (range) were 71 (27–99), 68 (28–95), and 70 (22–99) in the hydroxychloroquine (HC), HC with azithromycin (HC+AZ), and the no HC groups, respectively. In this cohort of 807 patients, 121 (15%) and 67 (8.3%) patients were taking angiotensin converting enzyme inhibitors and angiotensin II receptor blockers, respectively. Cardiovascular comorbidities, chronic obstructive pulmonary disease, and diabetes were present in 346 (43%), 175 (21.7%), and 534 (66%) of the patients, respectively, and these and other comorbidities were also comparable among the treatment groups. The oxygen saturation was below 94% in 33.6%, alanine aminotransferase was >40 U/L in 24.8%, and D-dimer was >1,000 ng/mL in 22.9% of the patients, and these laboratory values at baseline were significantly different among the treatment groups, with HC and HC+AZ groups having more patients with elevated hepatic enzymes and inflammatory markers.
Table 1.
Baseline Characteristics in the Full Study Cohort of 807 Hospitalized COVID-19 Patients
| Characteristics | HC (n = 198) | HC+AZ (n = 214) | No HC (n = 395) | p Value |
|---|---|---|---|---|
| Age, median (IQR), range, y | 71 (62–76.8), 27–99 | 68 (59–74), 28–95 | 70 (59–77), 22–99 | 0.02 |
| Race, No. (%) | ||||
| Black | 124 (62.6) | 127 (59.4) | 222 (56.2) | 0.54 |
| White | 61 (30.8) | 76 (35.5) | 149 (37.7) | |
| Other/unknown | 13 (6.6) | 11 (5.1) | 24 (6.1) | |
| Sex, No. (%) | ||||
| Female | 6 (3.0) | 10 (4.7) | 19 (4.8) | 0.58 |
| Male | 192 (97.0) | 204 (95.3) | 376 (95.2) | |
| Body mass index, median (IQR), kg/m2 | 30.2 (25.1–33.7) | 30.4 (25.9–35.2) | 28.8 (25.3–33.3) | 0.09 |
| Angiotensin converting enzyme inhibitor, no. (%) | 26 (13.1) | 37 (17.3) | 58 (14.7) | 0.48 |
| Angiotensin II receptor blockers, no. (%) | 15 (7.6) | 14 (6.5) | 38 (9.6) | 0.39 |
| Azithromycin, no. (%) | 0 | 214 (100) | 91 (23.0) | <0.001 |
| Hydroxychloroquine Treatment, Median (IQR) | ||||
| Dispense dose, mg | 257.1 (240–320) | 244.4 (240–333) | NA | 0.39 |
| Daily total dose, mg | 400 (400–480) | 422.2 (400–480) | NA | 0.51 |
| Treatment duration,days | 5 (3–5) | 5 (4–6) | NA | 0.007 |
| Pulse Oximetry, No. (%), SpO2 | ||||
| Median (IQR) | 96 (93–97) | 95 (93–97) | 96 (94–97) | 0.01 |
| ≥95 | 132 (66.7) | 120 (56.1) | 284 (71.9) | 0.002 |
| 90–94 | 60 (30.3) | 89 (41.6) | 105 (26.6) | |
| 75–89 | 6 (3.0) | 5 (2.3) | 6 (1.5) | |
| Respiratory Rate, No. (%), Breaths/min | ||||
| Median (IQR) | 20 (18–20) | 20 (18–21) | 18 (18–20) | 0.75 |
| <12 | 0 | 0 | 1 (0.3) | 0.46 |
| 12–22 | 166 (83.8) | 184 (86.0) | 349 (88.4) | |
| 22–29 | 27 (13.6) | 23 (10.8) | 32 (8.1) | |
| >29 | 5 (2.5) | 7 (3.3) | 13 (3.3) | |
| Heart Rate, No. (%), Beats/min | ||||
| Median (IQR) | 87 (77.25–97) | 88 (78–97) | 84 (74.5–95.5) | 0.09 |
| <60 | 2 (1.0) | 6 (2.8) | 14 (3.5) | 0.07 |
| 60–100 | 161 (81.3) | 167 (78.0) | 332 (84.1) | |
| >100 | 35 (17.7) | 41 (19.2) | 49 (12.4) | |
| Temperature, No. (%), °C | ||||
| Median (IQR) | 36.7 (36.7–37.2) | 36.9 (36.7–37.2) | 36.7 (36.7–37.2) | 0.009 |
| <35.0 | 0 | 1 (0.5) | 0 | 0.05 |
| 35.1–37.0 | 115 (58.1) | 106 (49.5) | 245 (62.0) | |
| 37.1–38.0 | 61 (30.8) | 81 (37.9) | 121 (30.6) | |
| 38.1–39.0 | 21 (10.6) | 25 (11.7) | 25 (6.3) | |
| >39.0 | 1 (0.5) | 1 (0.5) | 4 (1.0) | |
| Systolic Blood Pressure, No. (%), mm Hg | ||||
| Median (IQR) | 134 (120.3–153.8) | 132 (120.3–146.7) | 132 (118–147) | 0.06 |
| <90 | 0 | 3 (1.4) | 3 (0.8) | 0.13 |
| 90–120 | 50 (25.3) | 51 (23.8) | 117 (29.6) | |
| 121–139 | 58 (29.3) | 85 (39.7) | 130 (32.9) | |
| 140–159 | 54 (27.3) | 50 (23.4) | 93 (23.5) | |
| >159 | 36 (18.2) | 25 (11.7) | 52 (13.17) | |
| Alanine Aminotransferase, No. (%), U/L | ||||
| <40 | 113 (57.1) | 126 (58.9) | 193 (48.9) | <0.001 |
| 40–80 | 39 (19.7) | 46 (21.5) | 50 (12.7) | |
| 81–120 | 15 (7.6) | 14 (6.5) | 10 (2.5) | |
| >120 | 3 (1.5) | 12 (5.6) | 11 (2.8) | |
| Missing | 28 (14.1) | 16 (7.5) | 131 (33.2) | |
| Aspartate Aminotransferase, No. (%), U/L | ||||
| <40 | 74 (37.4) | 87 (40.7) | 150 (38.0) | <0.001 |
| 40–80 | 68 (34.3) | 73 (34.1) | 87 (22.0) | |
| 81–120 | 15 (7.6) | 15 (7.0) | 15 (3.8) | |
| >120 | 12 (6.1) | 23 (10.8) | 11 (2.8) | |
| Missing | 29 (14.7) | 16 (7.5) | 132 (33.4) | |
| Serum Albumin, No. (%), g/dL | ||||
| <2.1 | 5 (2.5) | 8 (3.7) | 3 (0.8) | <0.001 |
| 2.1–2.7 | 47 (23.7) | 33 (15.4) | 46 (11.7) | |
| 2.8–3.5 | 97 (49.0) | 90 (42.1) | 156 (39.5) | |
| 3.6–5.5 | 21 (10.6) | 65 (30.4) | 72 (18.2) | |
| >5.5 | 0 | 3 (1.4) | 6 (1.5) | |
| Missing | 28 (14.1) | 15 (7.0) | 112 (28.4) | |
| Total Bilirubin, No. (%), mg/dL | ||||
| <1.2 | 157 (79.3) | 177 (82.7) | 245 (62.0) | <0.001 |
| 1.2–1.9 | 9 (4.6) | 15 (7.0) | 17 (4.3) | |
| 2.0–5.9 | 5 (2.5) | 6 (2.8) | 5 (1.3) | |
| 6–11.9 | 0 | 0 | 1 (0.3) | |
| Missing | 27 (13.6) | 16 (7.5) | 127 (32.2) | |
| Creatinine, No. (%), mg/dL | ||||
| <1.2 | 84 (42.4) | 107 (50.0) | 193 (48.9) | 0.001 |
| 1.2–1.9 | 55 (27.8) | 57 (26.6) | 98 (24.8) | |
| 2–3.4 | 20 (10.1) | 18 (8.4) | 30 (7.6) | |
| 3.5–4.9 | 7 (3.5) | 3 (1.4) | 9 (2.3) | |
| ≥5 | 30 (15.2) | 27 (12.6) | 36 (9.1) | |
| Missing | 2 (1.0) | 2 (0.9) | 29 (7.3) | |
| Lactate Dehydrogenase, No. (%), U/L | ||||
| <250 | 28 (14.1) | 41 (19.2) | 78 (19.8) | <0.001 |
| ≥250 | 111 (56.1) | 133 (62.2) | 135 (34.2) | |
| Missing | 59 (29.8) | 40 (18.7) | 182 (46.1) | |
| D-dimer, No. (%), ng/mL | ||||
| <500 | 9 (4.6) | 13 (6.1) | 19 (4.8) | <0.001 |
| 500–1,000 | 21 (10.6) | 36 (16.8) | 33 (8.4) | |
| 1,000–2,000 | 25 (12.6) | 35 (16.4) | 33 (8.4) | |
| >2,000 | 28 (14.1) | 32 (15.0) | 32 (8.1) | |
| Missing | 115 (58.1) | 98 (45.8) | 278 (70.4) | |
| Erythrocytes, No. (%), per 1012/L | ||||
| <4 | 75 (37.9) | 72 (33.6) | 111 (28.1) | <0.001 |
| 4–6 | 115 (58.1) | 135 (63.1) | 240 (60.8) | |
| >6 | 4 (2.0) | 5 (2.3) | 5 (1.3) | |
| Missing | 4 (2.0) | 2 (0.9) | 39 (9.9) | |
| Hematocrit, No. (%), % | ||||
| <30 | 30 (15.2) | 13 (6.1) | 33 (8.4) | <0.001 |
| 30–50 | 163 (82.3) | 195 (91.1) | 321 (81.3) | |
| 51–65 | 1 (0.5) | 4 (1.9) | 2 (0.5) | |
| Missing | 4 (2.0) | 2 (0.9) | 39 (9.9) | |
| Leukocytes, No (%), per mm3 | ||||
| <4,000 | 47 (23.7) | 50 (23.4) | 82 (20.8) | <0.001 |
| 4,000–10,000 | 126 (63.6) | 136 (63.6) | 243 (61.5) | |
| >10,000 | 21 (10.6) | 26 (12.2) | 31 (7.9) | |
| Missing | 4 (2.0) | 2 (0.9) | 39 (9.9) | |
| Lymphocytes, No. (%), per mm3 | ||||
| <800 | 56 (28.3) | 64 (29.9) | 75 (19.0) | 0.03 |
| 800–3,000 | 110 (55.6) | 120 (56.1) | 237 (60.0) | |
| >3,000 | 5 (2.5) | 3 (1.4) | 11 (2.8) | |
| Missing | 27 (13.6) | 27 (12.6) | 72 (18.2) | |
| Platelets, No. (%), per mm3 | ||||
| <20,000 | 0 | 0 | 4 (1.0) | <0.001 |
| 20,000–50,000 | 1 (0.5) | 0 | 1 (0.3) | |
| 50,000–100,000 | 15 (7.6) | 11 (5.1) | 17 (4.3) | |
| 100,000–150,000 | 48 (24.2) | 58 (27.1) | 82 (20.8) | |
| ≥150,000 | 126 (63.6) | 143 (66.8) | 250 (63.3) | |
| Missing | 8 (4.0) | 2 (0.9) | 41 (10.4) | |
| Blood Urea Nitrogen, No. (%), mg/dL | ||||
| <20 | 77 (38.9) | 106 (49.5) | 198 (50.1) | 0.07 |
| 20–40 | 64 (32.3) | 62 (29.0) | 108 (27.3) | |
| >40 | 39 (19.7) | 34 (15.9) | 51 (12.9) | |
| Missing | 18 (9.1) | 12 (5.6) | 38 (9.6) | |
| C Reactive Protein, No. (%), mg/L | ||||
| <28 | 82 (41.4) | 113 (52.8) | 150 (38.0) | <0.001 |
| 28–69 | 24 (12.1) | 18 (8.4) | 35 (8.9) | |
| >69 | 40 (20.2) | 55 (25.7) | 59 (14.9) | |
| Missing | 52 (26.3) | 28 (13.1) | 151 (38.2) | |
| Procalcitonin, No. (%), ng/mL | ||||
| 0.01–0.25 | 46 (23.2) | 62 (29.0) | 80 (20.3) | 0.002 |
| 0.25–0.50 | 18 (9.1) | 17 (7.9) | 23 (5.8) | |
| >0.50 | 25 (12.6) | 33 (15.4) | 33 (8.4) | |
| Missing | 109 (55.1) | 102 (47.7) | 259 (65.6) | |
| Troponin I Cardiac, No. (%), ng/L | ||||
| <0.5 | 67 (33.8) | 80 (37.4) | 89 (22.5) | 0.008 |
| 0.5–1.0 | 0 | 1 (0.5) | 4 (1.0) | |
| 1.1–2.5 | 1 (0.5) | 2 (0.9) | 3 (0.8) | |
| 2.6–5.0 | 0 | 1 (0.5) | 1 (0.3) | |
| >5 | 2 (1.0) | 0 | 1 (0.3) | |
| Missing | 128 (64.7) | 130 (60.8) | 297 (75.2) | |
| Erythrocyte Sedimentation Rate, No. (%), mm/h | ||||
| <25 | 9 (4.6) | 16 (7.5) | 14 (3.5) | <0.001 |
| 25–50 | 16 (8.1) | 29 (13.6) | 30 (7.6) | |
| 51–75 | 17 (8.6) | 25 (11.7) | 36 (9.1) | |
| >75 | 12 (6.1) | 29 (13.6) | 26 (6.6) | |
| Missing | 144 (72.7) | 115 (53.7) | 289 (73.2) | |
| Comorbiditiesa, No. (%) | ||||
| Charlson comorbidity indexb, median (IQR) | 3 (1–5) | 2 (0–4) | 2 (1–5) | 0.06 |
| Smoking | 38 (19.2) | 31 (14.5) | 59 (14.9) | 0.33 |
| Hyperlipidemia | 36 (18.2) | 37 (17.3) | 51 (12.9) | 0.16 |
| Asthma | 6 (3.0) | 13 (6.1) | 21 (5.3) | 0.33 |
| Myocardial infarction | 10 (5.1) | 10 (4.7) | 24 (6.1) | 0.74 |
| Congestive heart failure | 50 (25.3) | 37 (17.3) | 76 (19.2) | 0.11 |
| Peripheral vascular disease | 35 (17.7) | 35 (16.4) | 69 (17.5) | 0.92 |
| Cerebrovascular disease | 35 (17.7) | 25 (11.7) | 51 (12.9) | 0.17 |
| Dementia | 25 (12.6) | 12 (5.6) | 49 (12.4) | 0.02 |
| Chronic pulmonary disease | 46 (23.2) | 45 (21.0) | 84 (21.3) | 0.83 |
| Connective tissue disease-rheumatic disease | 5 (2.5) | 5 (2.3) | 2 (0.5) | 0.08 |
| Peptic ulcer disease | 3 (1.5) | 0 | 4 (1.0) | 0.23 |
| Mild liver disease | 18 (9.1) | 23 (10.8) | 29 (7.3) | 0.35 |
| Diabetes without complications | 96 (48.5) | 84 (39.3) | 162 (41.0) | 0.12 |
| Diabetes with complications | 57 (28.8) | 45 (21.0) | 90 (22.8) | 0.15 |
| Paraplegia/hemiplegia | 6 (3.0) | 7 (3.3) | 6 (1.5) | 0.31 |
| Renal disease | 65 (32.8) | 48 (22.4) | 111 (28.1) | 0.06 |
| Cancer | 34 (17.2) | 31 (14.5) | 62 (15.7) | 0.76 |
| Moderate/severe liver disease | 1 (0.5) | 2 (0.9) | 3 (0.8) | 0.88 |
| Metastatic carcinoma | 5 (2.5) | 3 (1.4) | 8 (2.0) | 0.71 |
| HIV/AIDS | 2 (1.0) | 5 (2.3) | 11 (2.8) | 0.38 |
International System of Units (SI) conversion factors: to convert creatinine to micromoles per liter, multiply by 88.4; alanine aminotransferase, aspartate aminotransferase, lactate dehydrogenase to microkatals per liter, multiply by 0.0167; leukocytes, lymphocytes to ×109 per liter, multiply by 0.001; serum albumin to grams per liter, multiply by 10.0; total bilirubin to micromoles per liter, multiply by 17.1. AZ, azithromycin; HC, hydroxychloroquine; IQR, interquartile range; NA, not applicable.
Defined as medical diagnoses included in medical history by ICD-10 coding
Charlson comorbidity index predicts the 10-year mortality. The median score of 2 or 3 corresponds to a 90% or 77% estimated 10-year survival, respectively.
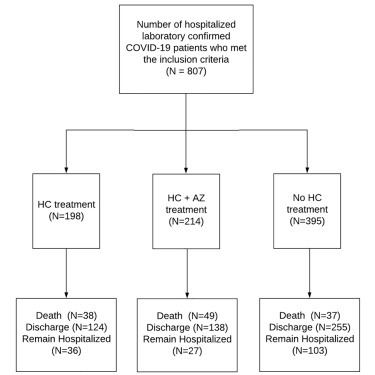
Among the 807 patients, 198 (24.5%) and 214 (26.5%) patients were treated with HC and HC+AZ, respectively, although 395 (49.0%) patients did not receive HC at any time during their hospitalization (Figure 1 ). Among the 412 (51.1%) patients who received HC, 355 (86.2%) patients were started on HC treatment before the institution of mechanical ventilation. The median daily doses (interquartile range [IQR]) of HC were 400 (400–480) mg and 422.2 (400–480) mg in the HC and HC+AZ groups, respectively. The median (IQR) durations of treatment with HC were 5 (3–5) days and 5 (4–6) days in the HC and HC+AZ groups, respectively.
Figure 1.
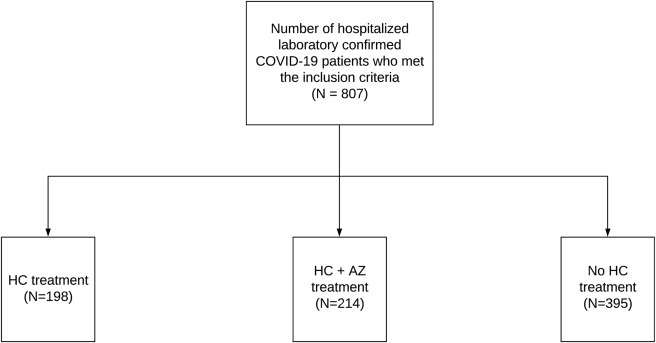
Distribution of Treatment Cohorts in the Full Study Cohort of 807 Hospitalized COVID-19 Patients
AZ, azithromycin; CI, confidence interval; HC, hydroxychloroquine;
Of these 807 patients, 124 (15.4%) died, 517 (64.1%) were discharged alive, and 166 (20.6%) remained hospitalized at the end of the study period. The unadjusted mortality rates were 19.2%, 22.9%, and 9.4% in the HC, HC+AZ, and no HC groups, respectively (p < 0.001), in patients who were treated with HC at any time during the hospitalization period (Table 2 ). The unadjusted rates of mechanical ventilation were 19.0%, 20.5%, and 19.9% in the HC, HC+AZ, and no HC groups, respectively (p = 0.94), in patients who were treated with HC prior to mechanical ventilation (Table 2). The unadjusted rates of invasive mechanical ventilation were 16.7%, 19.1%, and 14.6% in the HC, HC+AZ, and no HC groups, respectively (p = 0.37), in patients who were treated with HC prior to invasive mechanical ventilation (Table 2). Among patients who received HC treatment before mechanical ventilation, the unadjusted rates of mortality at any time were 14.0%, 15.9%, and 15.7% in the HC, HC+AZ, and no HC groups, respectively (p = 0.84; Table 2). Among patients who underwent mechanical ventilation and did not receive HC treatment before ventilation, the unadjusted mortality rates were 58.6%, 60.7%, and 33.3% in the HC, HC+AZ, and no HC groups, respectively (p = 0.05; Table 2).
Table 2.
Treatment Outcomes in the Full Study Cohort of 807 Hospitalized COVID-19 Patients
| HC Treatment Initiated at Any Time during the Hospitalization Period | ||||
|---|---|---|---|---|
| Outcome | HC (n = 198) | HC+AZ (n = 214) | No HC (n = 395) | p Value |
| Death - no. (%) | 38 (19.2) | 49 (22.9) | 37 (9.4) | <0.001 |
| Discharge - no. (%) | 124 (62.6) | 138 (64.5) | 255 (64.6) | 0.89 |
| Remain hospitalized - no. (%) | 36 (18.2) | 27 (12.6) | 103 (26.1) | <0.001 |
| HC Treatment Initiated before Mechanical Ventilationa,b | ||||
| Outcome | HC (n = 179) | HC+AZ (n = 176) | No HC (n = 452) | p Value |
| Ventilation - no. (%) | 34 (19.0) | 36 (20.5) | 90 (19.9) | 0.94 |
| Death before mechanical ventilation - no. (%) | 11 (6.2) | 9 (5.1) | 26 (5.8) | 0.91 |
| Death after mechanical ventilation - no. (%) | 14 (7.8) | 19 (10.8) | 45 (10.0) | 0.61 |
| Overall deathc – no. (%) | 25 (14.0) | 28 (15.9) | 71 (15.7) | 0.84 |
| Discharge before mechanical ventilation - no. (%) | 110 (61.5) | 118 (67.1) | 246 (54.4) | 0.01 |
| Discharge after mechanical ventilation - no. (%) | 10 (5.6) | 9 (5.1) | 24 (26.7) | 0.98 |
| Hospitalized and without mechanical ventilation - no. (%) | 24 (13.4) | 13 (7.4) | 90 (19.9) | <0.001 |
| Hospitalized in mechanical ventilation - no. (%) | 10 (5.6) | 8 (4.6) | 21 (4.7) | 0.87 |
| HC Treatment Initiated before Invasive Mechanical Ventilationa | ||||
| Outcome | HC (n = 174) | HC+AZ (n = 173) | No HC (n = 460) | p Value |
| Invasive ventilation - no. (%) | 29 (16.7) | 33 (19.1) | 67 (14.6) | 0.37 |
| Death before invasive ventilation - no. (%) | 11 (6.3) | 9 (5.2) | 33 (7.2) | 0.66 |
| Death after invasive ventilation - no. (%) | 15 (8.6) | 20 (11.6) | 36 (7.8) | 0.33 |
| Overall deathc – no. (%) | 26 (14.9) | 29 (16.8) | 69 (15) | 0.85 |
| Discharge before invasive ventilation - no. (%) | 110 (63.2) | 118 (68.2) | 265 (57.6) | 0.04 |
| Discharge after invasive ventilation - no. (%) | 5 (2.9) | 5 (2.9) | 14 (3.0) | >0.99 |
| Hospitalized and without invasive mechanical ventilation - no. (%) | 24 (13.8) | 13 (7.5) | 95 (20.7) | <0.001 |
| Hospitalized in invasive mechanical ventilation - no. (%) | 9 (5.2) | 8 (4.6) | 17 (3.7) | 0.68 |
| HC Treatment Initiated after Mechanical Ventilationb,d | ||||
| Outcome | HC (n = 29) | HC+AZ (n = 28) | No HC (n = 33) | p Value |
| Death - no. (%) | 17 (58.6) | 17 (60.7) | 11 (33.3) | 0.05 |
| Discharge - no. (%) | 8 (27.6) | 7 (25.0) | 9 (27.3) | 0.97 |
| Remain hospitalized - no. (%) | 4 (13.8) | 4 (14.3) | 13 (39.4) | 0.02 |
Patients may be in more than one category (e.g., ventilation and discharge after mechanical ventilation)
Mechanical ventilation includes both non-invasive and invasive mechanical ventilation
Overall death includes patients who died before and after mechanical ventilation
Patients who received hydroxychloroquine before mechanical ventilation were excluded
After propensity score adjustment for clinical characteristics, the risk of death from any cause was higher in the HC group (adjusted hazard ratio, 1.83; 95% confidence interval [CI], 1.16–2.89; p = 0.009), but not in the HC+AZ group (adjusted hazard ratio, 1.31; 95% CI, 0.80–2.15; p = 0.28), when compared to the no HC group (Table 3 ). The propensity-score-adjusted risk of mechanical ventilation was not significantly different in the HC group (adjusted hazard ratio, 1.19; 95% CI, 0.78–1.82; p = 0.42) or in the HC+AZ group (adjusted hazard ratio, 1.09; 95% CI, 0.72–1.66; p = 0.69), compared to the no HC group (Table 3).
Table 3.
Adjusted Hazard Ratios for the 807 Hospitalized COVID-19 Patients Using the Right-Censored, Length-Biased Cox Proportional Hazards Model after Propensity Score Adjustment
| Mechanical Ventilationa |
Invasive Ventilation |
Death |
Death after Mechanical Ventilationa |
Death after Invasive Ventilation |
|||||||
|---|---|---|---|---|---|---|---|---|---|---|---|
| aHR (95% CI) | p Value | aHR (95% CI) | p Value | aHR (95% CI) | p Value | aHR (95% CI) | p Value | aHR (95% CI) | p Value | ||
| HC | versus no HC | 1.19 (0.78–1.82) | 0.42 | 1.27 (0.81–2.0) | 0.30 | 1.83 (1.16–2.89) | 0.009 | 2.11 (0.96–4.62) | 0.06 | 0.75 (0.20–2.79) | 0.67 |
| HC+AZ | 1.09 (0.72–1.66) | 0.69 | 1.12 (0.71–1.76) | 0.62 | 1.31 (0.80–2.15) | 0.28 | 1.25 (0.59–2.68) | 0.56 | 0.46 (0.11–1.79) | 0.28 | |
aHR, adjusted hazard ratio; HR, hazard ratio
Mechanical ventilation includes both non-invasive and invasive mechanical ventilation
We then performed a subanalysis by examining the cohort of patients who were admitted during the first 4 weeks of the study period (March 9–April 6, 2020). This cohort of 425 patients had dispositions of death or discharge by the end of the study period and thus did not encounter the issue of length-biased sampling and differential rates of right-censored observations among the groups. The baseline demographics, comedications, comorbidities, and clinical and laboratory characteristics of this subcohort, presented in Table S1, were similar to those of the entire patient cohort. In this cohort, 114 (26.8%) and 148 (34.8%) patients were treated with HC and HC+AZ, respectively, although 163 (38.4%) patients did not receive HC at any time during the hospitalization period (Figure S1). The median daily total doses of HC treatment in this cohort were 414.2 (400–480) mg and 433.3 (400–480) mg in the HC and HC+AZ groups, respectively. The median (IQR) durations of treatment with HC were 5 (3–6) and 5 (4–6) days in the HC and HC+AZ groups, respectively (Table S1). Among these 425 patients, there were 87 (20.5%) deaths and 338 (79.5%) hospital discharges. The unadjusted mortality rates in this cohort were 26.3%, 26.4%, and 11.1% in the HC, HC+AZ, and no HC groups, respectively, when HC treatment was initiated at any time during the hospitalization period (p < 0.001) and 19.2%, 16.2%, and 23.4% in the HC, HC+AZ, and no HC groups, respectively, in patients who received HC treatment before mechanical ventilation (p = 0.28; Table S2).
After propensity score adjustment for clinical characteristics in this subcohort, there was no significant difference in risk of death from any cause in the HC group (adjusted hazard ratio, 0.99; 95% CI, 0.50–1.92; p = 0.98) or in the HC+AZ group (adjusted hazard ratio, 0.89; 95% CI, 0.45–1.77; p = 0.74), when compared to the no HC group (Table S3). The propensity-score-adjusted risk of mechanical ventilation in this subcohort was not significantly different in the HC group (adjusted hazard ratio, 1.36; 95% CI, 0.78–2.39; p = 0.28) or in the HC+AZ group (adjusted hazard ratio, 1.14; 95% CI, 0.62–2.09; p = 0.67) compared to the no HC group (Table S3).
Among these 425 patients, the unadjusted median (IQR) lengths of stay (days) were 7 (4–12), 8 (5.0–13), and 4 (1–7) in the HC, HC+AZ, and no HC groups, respectively (Table 4 ). After propensity score adjustment, the length of hospital stay was 33% (95% CI, 6%–67%; p = 0.01) longer in the HC group and 38% (95% CI, 11%–72%; p = 0.004) longer in the HC+AZ group (Table 4) when compared to the no HC group.
Table 4.
Length of Stay Comparison between the Treatment Groups in the Subcohort of 425 Patients
| Cumulative Distribution Function of the Length of Hospital Stay | |||||
|---|---|---|---|---|---|
| Length of Stay (Days) | |||||
| 25% | 50% | 75% | p Value | ||
| No HC | 1 | 4 | 7 | <0.001 | |
| HC | 4 | 7 | 12 | ||
| HC+AZ | 5 | 8 | 13 | ||
| Length of Stay Ratio and 95% CIs of Patients Who Received Hydroxychloroquine and Hydroxychloroquine with Azithromycin Compared to Patients Who Did Not Receive Hydroxychloroquine Using Gamma Distributions with Log Links and Propensity Score Adjusted | |||||
| Length of Stay Ratio (95% CI) | p Value | ||||
| HC | versus no HC | 1.33 (1.06–1.67) | 0.01 | ||
| HC+AZ | 1.38 (1.11–1.72) | 0.004 | |||
CI, confidence interval
Discussion
HC and remdesivir are the only two drugs that have received emergency use authorizations from the FDA for the treatment of COVID-19.3 , 10 Given the longer development, testing, and approval times for novel chemical entities, repurposing drugs already approved for other indications is a promising approach to rapidly identify an effective therapy. HC is at the forefront of repurposing drug candidates. Although ongoing prospective, randomized, controlled studies are expected to provide more evidence about HC in the near future, the outcomes observed in our retrospective study provide substantial information about the use of HC with or without AZ from the largest integrated healthcare system in the United States. Specifically, we found that HC use with or without co-administration of AZ did not improve mortality or reduce the need for mechanical ventilation.
Subsequent to the release of preliminary data from our study on April 21, 2020,11 two different groups from New York confirmed our findings in larger cohorts.12 , 13 The findings of our study are similar to the observational study from a New York hospital, which reported no beneficial effect of HC treatment on respiratory failure or mortality in patients hospitalized with COVID-19.12 However, that study did not report on the effectiveness of HC when co-administered with AZ. In addition, we present the hazards of mortality and use of ventilation separately, unlike that study, which considered both these outcomes as a composite measure. Given the number of clinical trials currently testing the combination of HC and AZ for COVID-19 and the potential synergistic toxicity of these drugs,4 , 8 it is important to gather insights into the outcomes of patients treated with both HC and AZ. The results of our study are also similar to another recent study from 25 New York hospitals, which reported that use of HC, with and without AZ, was not associated with reduced mortality but did not report on the risk of mechanical ventilation.13 That study found that patients receiving HC and AZ had a higher risk of cardiac arrest. Recently, a large multinational registry analysis study demonstrated an increased risk in mortality and ventricular arrhythmias in patients treated with HC or chloroquine with or without macrolides.14 Although that study reported an absence of difference in baseline characteristics among the groups, it considered only two measures of disease severity and did not correct for many relevant laboratory variables. The results of our nationwide study not only confirm findings from both regional studies from New York but, in addition, after propensity score adjustment based on multiple variables, showed comparable mortality and mechanical ventilation rates to the multinational study. In addition to these retrospective observational studies, a recent randomized control trial assessing the efficacy of HC for mild to moderate COVID-19 did not observe any beneficial effect of HC treatment.15
The overall mortality rate—19.3% of the patients with known outcomes of death/discharge by April 29, 2020—in our study was lower compared to large descriptive studies from China (28%)16 and Italy (26%)17 and similar to a large case series reported from New York City (21%).18 The multinational study reported a mortality rate of 9.3% in the control group and a range of 16.4%–23.8% in all groups with chloroquine or HC with or without macrolides.14 Despite the increased baseline disease severity in HC and HC+AZ groups, the vast majority of them survived (78.9%). It also bears noting that patients with increased baseline disease severity (low oxygen saturation, high systolic blood pressure, elevated D-dimers, and lymphopenia) or with comorbidities associated with poor outcomes (cancer, chronic pulmonary disease, and diabetes) were not only in the HC or HC+AZ groups, as a substantial fraction of these patients were also in the no HC group.
In our study, 19.1% of patients required invasive ventilation compared to 17% and 12.2% reported by the studies from China and New York, respectively.16 , 17 Further, 56% of patients received HC as treatment for COVID-19, which is similar to the data from a questionnaire survey of physicians from 30 countries that reported that 61% of them prescribed HC for COVID-19 and also similar to a recent study reporting on the outcomes of HC for COVID-19, in which 59% of patients were treated with HC.12 , 19
HC has been reported to inhibit SARS-CoV-2 replication in vitro with a 50% maximal effective concentration (EC50) ranging from 4.5 μM to 17 μM.1 However, the approved dosing regimens (200 mg twice daily, which was also the median dose in our study) for HC in patients with rheumatoid arthritis or lupus generate substantially lower peak serum drug concentrations (~1 μM).20 , 21 Administering higher doses of HC to achieve presumed antiviral concentrations might increase the risk of adverse events. Of note, a randomized, controlled trial of high-dose chloroquine, the parent compound of HC that also has been reported to have in vitro antiviral activity against SARS-CoV-2 and similar peak serum concentrations in humans, was halted prematurely due to cardiac toxicity and higher fatality rates in the high-dose chloroquine-treated COVID-19 patients.22
In this retrospective study, after adjusting for several relevant confounders, no benefit from HC treatment with or without AZ was observed in survival outcomes, the need for mechanical ventilation, or length of stay among hospitalized COVID-19 patients. The results of our study benefit from certain strengths. For example, because we studied data from a comprehensive electronic medical record rather than from an administrative health insurance claims database, we used rigorously identified covariates and outcomes. We studied patients in an integrated national healthcare system; therefore, the data are less susceptible to biases of single-center or regional studies. The median drug dosage and treatment duration of HC of patients in this study indicate that the treatment regimen used was similar to the treatment regimens in The Outcomes Related to COVID-19 Treated with Hydroxychloroquine among In-Patients with Symptomatic Disease (ORCHID) trial conducted by the NIH and several other randomized clinical trials evaluating the efficacy of HC for COVID-19.23, 24, 25, 26, 27, 28, 29 The mortality rates (overall as well as before or after ventilation) and the rates of mechanical ventilation in our study are similar to those reported in a large retrospective case series of 5,700 patients from New York City.18 Ultimately, forthcoming results of prospective randomized clinical trials of HC conducted in several countries both in the inpatient and outpatient setting are expected to provide more definitive guidance in the coming months.
Limitations of Study
Our study has certain limitations, including those inherent to all retrospective analyses, especially the non-randomization of treatments, which could significantly impact the results. We did, however, adjust for a large number of COVID-19-relevant confounders, including comorbidities, medications, and clinical and laboratory values. Despite propensity score adjustment for a large number of relevant confounders, we cannot rule out the possibility of selection bias or residual confounding. Additionally, the use of codes (e.g., international classification of diseases [ICD]-10) to identify clinical characteristics and study outcomes cannot be considered equivalent to medical chart review or prospective data collection. Our study cohort comprised patients whose median age was 70 years, not dissimilar to the median age reported in the large studies from Italy and New York.17 , 18 Although a quarter of the patients in our study ranged in ages from 22 to 60 years, the results still may not necessarily reflect outcomes in younger hospitalized populations, nor can they be extrapolated to pediatric patients. As 91% of all US veterans are male,30 our findings may also be influenced by the demographic composition of patients in our cohort, the majority of whom were black, mirroring the disproportionately higher rates of COVID-19-related hospitalization among the black population in the United States.31 , 32 Our results do not pertain to the use of HC, with or without AZ, in the outpatient setting, nor do they provide insights regarding the efficacy of pre-exposure or post-exposure prophylaxis. However, the FDA and the US National Institutes of Health (NIH) have both recently recommended against the use of HC in outpatient settings and outside of clinical trials.33 , 34 Finally, there are many factors that can influence the management decisions that cannot be accounted for in retrospective studies. For example, the do-not-resuscitate status/level of patients, which could impact treatment patterns, was not evaluated in this study.
STAR★Methods
Resource Availability
Lead contact
Further information and requests for resources should be directed to and will be fulfilled by the Lead Contact, Jayakrishna Ambati, MD, University of Virginia School of Medicine, 415 Lane Road, Charlottesville, VA 22908 (ja9qr@virginia.edu)
Materials availability
This study did not generate new unique reagents.
Data and code availability
These analyses were performed using raw data that are available only within the US Department of Veterans Affairs secure research environment, the VA Informatics and Computing Infrastructure (VINCI). All relevant data outputs are within the paper and its supplemental information.
Experimental Model and Subject Details
This national retrospective cohort study evaluated information on hospitalized patients with confirmed SARS-CoV-2 infection using data from the Department of Veterans Affairs (VA). Data were extracted from the Veterans Affairs Informatics and Computing Infrastructure (VINCI), which includes inpatient, outpatient data (coded with International Classification of diseases (ICD) revision 9-CM, revision 10-CM), laboratory, and pharmacy claims. The completeness, utility, accuracy, validity, and access methods are described on the VA website, https://www.virec.research.va.gov. The study was conducted in compliance with the Department of Veterans Affairs requirements, received VA Institutional Review Board, and VA Research & Development approval.
Method Details
Study population
We developed a cohort of hospitalized patients with positive results on SARS-CoV-2 testing. SARS-CoV-2 status was classified by laboratory results that were extracted from the VA laboratory data. A text search for SARS-CoV-2 laboratory tests was used to query VA lab results. The study index was based on the date of a hospitalization with a positive SARS-CoV-2 laboratory test within one day prior to hospitalization. This strict time criterion was included for the following reasons: 1) As the number of VA outpatient clinics vastly outnumber the number of medical centers, many patients tested at these outpatient clinics and confirmed with COVID-19 could have been admitted at other hospital centers and then transferred to VA medical centers and the baseline data at admission from these patients would not be completely accessible; 2) The prehospitalization usage of hydroxychloroquine would be unknown if the time lag between the positive test and hospitalization were longer and could result in placing these patients in the wrong cohort; and 3) This time criterion also will exclude potential hospital admission for other reasons. Index dates ranged from March 9, 2020 to April 28, 2020, and patients were followed from index until April 29, 2020, hospital discharge or death. The period prior to index is designated as the baseline period and on or after index is designated the follow-up period. Inclusion Criteria: Patients were included in the study if their information contained 1) a body mass index, 2) vital signs during an encounter (temperature, heart rate and blood pressure), and were 3) either discharged, died in hospital or were currently hospitalized as of the study end date. Exclusion Criteria: Patients were excluded if they did not meet these criteria.
Outcomes and exposure coding
The study outcomes are the result of the hospitalization (discharge or death), whether ventilation was required, the type of ventilation and the result of hospitalization among patients requiring ventilation. Mechanical ventilation included patients receiving both noninvasive and invasive forms of ventilation. Mechanical and invasive ventilation were coded using HCPCS/CPT/ICD-10-PCS codes (Table S4). The results of the hospitalization were coded from the discharge disposition status on the inpatient record. Hospitalization data were taken from the VA inpatient hospitalization data.
Patients were assigned to one of three cohorts based on medication exposure: 1) HC-treated; 2) HC- and AZ-treated; or 3) HC-untreated. Patients were exposed to hydroxychloroquine if they had a dispensed drug from the VA bar code medication administration (BCMA) data file during their hospitalization. Similarly, if patients received azithromycin with hydroxychloroquine during their hospitalization, they were categorized HC- and AZ-treated. Patients with no hydroxychloroquine exposure were coded as HC unexposed. To examine the HC treatment association with study outcomes, hydroxychloroquine and azithromycin exposures were coded dynamically.
Covariates
At baseline (date of admission), for each patient, we extracted demographic, comorbid, clinical (vital signs) and pharmacy data including variables associated with increasing severity of Covid-19.16 , 35 Demographic and clinical characteristics included age, sex, race, and body mass index (BMI). For comorbid conditions, we utilized ICD-10-CM codes and the Charlson comorbidity index. Vital sign data include heart rate, pulse oximetry, respirations, temperature, and blood pressure (BP). All vital sign data were collected at the first set of vital results during the patient’s hospitalization and all were prior to ventilation if applicable. Laboratory data during hospitalization were also evaluated for each patient and consisted of liver function tests, albumin, bilirubin, creatinine, blood urea nitrogen, erythrocytes, hematocrit, platelets, white blood cells, C-reactive protein, procalcitonin, troponin, D-Dimer, lactate hydrogenase, and erythrocyte sedimentation rate.
Quantification and Statistical Analysis
Statistical Analysis
The statistical analysis for this study was conducted in multiple steps. First, we generated summaries of the baseline demographic, comorbid, and clinical characteristics for each treatment cohort group (HC, HC+AZ, and no HC). Continuous variables were analyzed with the ANOVA F-test and categorical variables with the chi-square test, or where applicable Fisher’s exact test. Second, we compared the frequencies of patients who required ventilation, died or were discharged alive from the hospital by treatment status using the chi-square or Fisher’s exact test. In our study cohort of hospitalized COVID-19 patients, the date of onset of symptoms is unknown and, while we include important baseline clinical factors, bias may still result. Length-bias may occur because there are potentially systematic differences in the time from symptom onset to hospitalization in our sample, compared to the general, non-VA, population. We used a Cox proportional hazards model for length-biased and right censored data36 implemented in the R package CoxPhLb. The Cox model was fit using time-dependent treatment and propensity score adjustment. We utilized a time-dependent propensity score37 fit using a multinomial logistic regression, including all baseline factors and time in hours. We estimated the propensity scores for HC treatment alone, as well as HC and AZ combination treatment. We included these propensity scores into the Cox proportional hazards model using restricted cubic splines with 3 knots.38 , 39 We did not use inverse probability of treatment weighting (IPTW) for two reasons: 1) in the presence of multinomial treatments IPTW can produce extreme weights and unreliable estimates40; and 2) the results are more sensitive to model specification when weighting directly on the propensity score.41 Statistical analyses were performed with the use of SAS software, version 9.4 (SAS Institute) and R software, version 3.6.1 (the R project [http://www.r-project.org]).
Subanalysis
We conducted a subanalysis of 425 patients who were admitted during the first 4 weeks of study (March 9 to April 6, 2020) to avoid the potential biases that could emerge from length biased sampling and right censoring of data from patients in the original cohort who remained in the hospital as of the study end date. Among this subset we utilized a time-dependent Cox model to estimate hazard ratios for treatment and outcome. Finally among this subset we use a generalized linear model with a gamma distribution and log link to estimate differences in lengths of stay, in hours, between the treatment groups. To account for differences in the cohorts we include restricted cubic splines of the propensity scores into the length of stay model.
Acknowledgments
No funding agency had a role in study design or conduct, data collection, analysis, interpretation, or manuscript writing. The content of this article is solely the responsibility of the authors and does not necessarily represent the official views of the National Institutes of Health and US Department of Veterans Affairs, nor does mention of trade names, commercial products, or organizations imply endorsement by the US government. This paper represents original research conducted using data from the Department of Veterans Affairs and is, in part, the result of work supported with resources and the use of facilities at the Dorn Research Institute, Columbia VA Health Care System, Columbia, South Carolina. J.A. is supported by National Institutes of Health (USA) grants (R01EY028027 andR01EY029799); the DuPont Guerry, III, Professorship; and the University of Virginia Strategic Investment Fund.
Author Contributions
J.M., S.S.S., and J.A. conceived the project. J.M. performed statistical analyses. S.N., F.P., T.H.C., J.W.H., S.S.S., and J.A. assisted with the development of methods and the statistical analysis plan. J.M., S.N., F.P., S.S.S., and J.A. wrote the paper with assistance from T.H.C. and J.W.H. All authors had the opportunity to discuss the results and comment on the manuscript.
Declaration of Interests
J.A. is a co-founder of iVeena Holdings, iVeena Delivery Systems, and Inflammasome Therapeutics; he has received consultancy fees from Allergan, Biogen, Boehringer Ingelheim, Immunovant, Janssen, Olix Pharmaceuticals, Retinal Solutions, and Saksin LifeSciences, all for ophthalmic topics unrelated to COVID-19. J.A. is named as an inventor on a patent application filed by the University of Virginia relating to COVID-19 but unrelated to this work or to any ongoing COVID-19 clinical trials. S.S.S. has received research grants from Boehringer Ingelheim, Gilead Sciences, Portola Pharmaceuticals, and United Therapeutics, all for projects unrelated to COVID-19. J.W.H. has received consulting fees from Celgene Corporation unrelated to this work. The other authors declare no competing interests.
Published: June 5, 2020
Footnotes
Supplemental Information can be found online at https://doi.org/10.1016/j.medj.2020.06.001.
Supplemental Information
Abbreviation: HC, Hydroxychloroquine; AZ, Azithromycin; IQR, Interquartile range; NA, not applicable. International System of Units (SI) conversion factors: to convert creatinine to micromoles per liter, multiply by 88.4; alanine aminotransferase, aspartate aminotransferase, lactate dehydrogenase to microkatals per liter, multiply by 0.0167; leukocytes, lymphocytes to x109 per liter, multiply by 0.001; serum albumin to grams per liter, multiply by 10.0; total bilirubin to micromoles per liter, multiply by 17.1 a Defined as medical diagnoses included in medical history by ICD-10 coding b Charlson Comorbidity Index predicts the 10-year mortality. The median score of 2 or 3 correspond to a 90% or 77% estimated 10-year survival, respectively.
References
- 1.Liu J., Cao R., Xu M., Wang X., Zhang H., Hu H., Li Y., Hu Z., Zhong W., Wang M. Hydroxychloroquine, a less toxic derivative of chloroquine, is effective in inhibiting SARS-CoV-2 infection in vitro. Cell Discov. 2020;6:16. doi: 10.1038/s41421-020-0156-0. [DOI] [PMC free article] [PubMed] [Google Scholar]
- 2.Gautret P., Lagier J.C., Parola P., Hoang V.T., Meddeb L., Mailhe M., Doudier B., Courjon J., Giordanengo V., Vieira V.E. Hydroxychloroquine and azithromycin as a treatment of COVID-19: results of an open-label non-randomized clinical trial. Int. J. Antimicrob. Agents. 2020 doi: 10.1016/j.ijantimicag.2020.105949. Published online March 20, 2020. [DOI] [PMC free article] [PubMed] [Google Scholar]
- 3.Food and Drug Administration . 2020. Fact sheet for health care providers: emergency use authorization (EUA) of hyroxychlroquine sulfate supplied from the strategic national stockpile for treatment of COVID-19 in certain hospitalized patients.https://www.fda.gov/media/136537/download [Google Scholar]
- 4.Chorin E., Dai M., Shulman E., Wadhwani L., Bar-Cohen R., Barbhaiya C., Aizer A., Holmes D., Bernstein S., Spinelli M. The QT interval in patients with COVID-19 treated with hydroxychloroquine and azithromycin. Nat. Med. 2020 doi: 10.1038/s41591-020-0888-2. Published online April 24, 2020. [DOI] [PubMed] [Google Scholar]
- 5.Chen J., Liu D., Liu L., Liu P., Xu Q., Xia L., Ling Y., Huang D., Song S., Zhang D. A pilot study of hydroxychloroquine in treatment of patients with moderate COVID-19. J. Zhejiang Univ. (Med. Sci.) 2020;49:215–219. doi: 10.3785/j.issn.1008-9292.2020.03.03. [DOI] [PMC free article] [PubMed] [Google Scholar]
- 6.Mahévas M., Tran V.T., Roumier M., Chabrol A., Paule R., Guillaud C., Fois E., Lepeule R., Szwebel T.A., Lescure F.X. Clinical efficacy of hydroxychloroquine in patients with covid-19 pneumonia who require oxygen: observational comparative study using routine care data. BMJ. 2020;369:m1844. doi: 10.1136/bmj.m1844. [DOI] [PMC free article] [PubMed] [Google Scholar]
- 7.Bessière F., Roccia H., Delinière A., Charrière R., Chevalier P., Argaud L., Cour M. Assessment of QT intervals in a case series of patients with coronavirus disease 2019 (COVID-19) infection treated with hydroxychloroquine alone or in combination with azithromycin in an intensive care unit. JAMA Cardiol. 2020 doi: 10.1001/jamacardio.2020.1787. Published online May 1, 2020. [DOI] [PMC free article] [PubMed] [Google Scholar]
- 8.Mercuro N.J., Yen C.F., Shim D.J., Maher T.R., McCoy C.M., Zimetbaum P.J., Gold H.S. Risk of QT interval prolongation associated with use of hydroxychloroquine with or without concomitant azithromycin among hospitalized patients testing positive for coronavirus disease 2019 (COVID-19) JAMA Cardiol. 2020 doi: 10.1001/jamacardio.2020.1834. Published online May 1, 2020. [DOI] [PMC free article] [PubMed] [Google Scholar]
- 9.London A.J., Kimmelman J. Against pandemic research exceptionalism. Science. 2020;368:476–477. doi: 10.1126/science.abc1731. [DOI] [PubMed] [Google Scholar]
- 10.Food and Drug Administration (FDA) 2020. Fact sheet for patients and parent/caregivers: emergency use authorization (EUA) of remdesivir for coronavirus disease 2019 (COVID-19)https://www.fda.gov/media/137565/download [Google Scholar]
- 11.Magagnoli J., Narendran S., Pereira F., Cummings T., Hardin J.W., Sutton S.S., Ambati J. Outcomes of hydroxychloroquine usage in United States veterans hospitalized with Covid-19. medRxiv. 2020 doi: 10.1101/2020.04.16.20065920. [DOI] [PMC free article] [PubMed] [Google Scholar]
- 12.Geleris J., Sun Y., Platt J., Zucker J., Baldwin M., Hripcsak G., Labella A., Manson D., Kubin C., Barr R.G. Observational study of hydroxychloroquine in hospitalized patients with Covid-19. N. Engl. J. Med. 2020 doi: 10.1056/NEJMoa2012410. Published online May 7, 2020. [DOI] [PMC free article] [PubMed] [Google Scholar]
- 13.Rosenberg E.S., Dufort E.M., Udo T., Wilberschied L.A., Kumar J., Tesoriero J., Weinberg P., Kirkwood J., Muse A., DeHovitz J. Association of treatment with hydroxychloroquine or azithromycin with in-hospital mortality in patients with COVID-19 in New York state. JAMA. 2020 doi: 10.1001/jama.2020.8630. Published online May 11, 2020. [DOI] [PMC free article] [PubMed] [Google Scholar]
- 14.Mehra M.R., Desai S.S., Ruschitzka F., Patel A.N. Hydroxychloroquine or chloroquine with or without a macrolide for treatment of COVID-19: a multinational registry analysis. Lancet. 2020 doi: 10.1016/S0140-6736(20)31180-6. Published online May 22, 2020. [DOI] [PMC free article] [PubMed] [Google Scholar] [Retracted]
- 15.Tang W., Cao Z., Han M., Wang Z., Chen J., Sun W., Wu Y., Xiao W., Liu S., Chen E. Hydroxychloroquine in patients with mainly mild to moderate coronavirus disease 2019: open label, randomised controlled trial. BMJ. 2020;369:m1849. doi: 10.1136/bmj.m1849. [DOI] [PMC free article] [PubMed] [Google Scholar]
- 16.Zhou F., Yu T., Du R., Fan G., Liu Y., Liu Z., Xiang J., Wang Y., Song B., Gu X. Clinical course and risk factors for mortality of adult inpatients with COVID-19 in Wuhan, China: a retrospective cohort study. Lancet. 2020;395:1054–1062. doi: 10.1016/S0140-6736(20)30566-3. [DOI] [PMC free article] [PubMed] [Google Scholar]
- 17.Grasselli G., Zangrillo A., Zanella A., Antonelli M., Cabrini L., Castelli A., Cereda D., Coluccello A., Foti G., Fumagalli R., COVID-19 Lombardy ICU Network Baseline characteristics and outcomes of 1591 patients infected with SARS-CoV-2 admitted to ICUs of the Lombardy Region, Italy. JAMA. 2020;323:1574–1581. doi: 10.1001/jama.2020.5394. [DOI] [PMC free article] [PubMed] [Google Scholar]
- 18.Richardson S., Hirsch J.S., Narasimhan M., Crawford J.M., McGinn T., Davidson K.W., Barnaby D.P., Becker L.B., Chelico J.D., Cohen S.L., and the Northwell COVID-19 Research Consortium Presenting characteristics, comorbidities, and outcomes among 5700 patients hospitalized with COVID-19 in the New York City area. JAMA. 2020;323:2052–2059. doi: 10.1001/jama.2020.6775. [DOI] [PMC free article] [PubMed] [Google Scholar]
- 19.Sermo . 2020. Sermo reports jury is still out on Remdesivir; 31% of physicians who have used Remdesivir rate it as highly effective; 31% rate it with low effectiveness; 38% rate it as somewhere in the middle.https://www.sermo.com/press-releases/sermo-reports-jury-is-still-out-on-remdesivir-31-of-physicians-who-have-used-remdesivir-rate-it-as-highly-effective-31-rate-it-with-low-effectiveness-38-rate-it-as-somewhere-in-the-middle/ [Google Scholar]
- 20.Laaksonen A.L., Koskiahde V., Juva K. Dosage of antimalarial drugs for children with juvenile rheumatoid arthritis and systemic lupus erythematosus. A clinical study with determination of serum concentrations of chloroquine and hydroxychloroquine. Scand. J. Rheumatol. 1974;3:103–108. doi: 10.3109/03009747409115809. [DOI] [PubMed] [Google Scholar]
- 21.Tett S.E., Cutler D.J., Day R.O., Brown K.F. Bioavailability of hydroxychloroquine tablets in healthy volunteers. Br. J. Clin. Pharmacol. 1989;27:771–779. doi: 10.1111/j.1365-2125.1989.tb03439.x. [DOI] [PMC free article] [PubMed] [Google Scholar]
- 22.Borba M.G.S., Val F.F.A., Sampaio V.S., Alexandre M.A.A., Melo G.C., Brito M., Mourão M.P.G., Brito-Sousa J.D., Baía-da-Silva D., Guerra M.V.F. Effect of high vs low doses of chloroquine diphosphate as adjunctive therapy for patients hospitalized with severe acute respiratory syndrome coronavirus 2 (SARS-CoV-2) infection: a randomized clinical trial. JAMA Netw. Open. 2020;3:e208857. doi: 10.1001/jamanetworkopen.2020.8857. [DOI] [PubMed] [Google Scholar]
- 23.Seto T. 2020. A randomized controlled clinical trial: hydroxychloroquine for the treatment of COVID-19 in hospitalized patients (OAHU-COVID19)https://clinicaltrials.gov/show/NCT04345692 [Google Scholar]
- 24.Hill M. 2020. ALBERTA HOPE COVID-19 for the prevention of severe COVID19 disease.https://clinicaltrials.gov/show/NCT04329611 [Google Scholar]
- 25.Lu H. 2020. Efficacy and safety of hydroxychloroquine for treatment of COVID-19.https://clinicaltrials.gov/show/NCT04261517 [Google Scholar]
- 26.University Hospital . 2020. Evaluation of the efficacy of the hydroxychloroquine-azithromycin combination in the in the prevention of COVID-19 related SDRA (TEACHCOVID)https://clinicaltrials.gov/show/NCT04347512 [Google Scholar]
- 27.Thompson B.T. 2020. Outcomes related to COVID-19 treated with hydroxychloroquine among in-patients with symptomatic disease (ORCHID)https://clinicaltrials.gov/show/NCT04332991 [Google Scholar]
- 28.Stout J. 2020. Pragmatic factorial trial of hydroxychloroquine, azithromycin, or both for treatment of severe SARS-CoV-2 infection.https://clinicaltrials.gov/show/NCT04335552 [Google Scholar]
- 29.Hussain S. 2020. Randomized comparison of combination azithromycin and hydroxychloroquine vs. hydroxychloroquine alone for the treatment of confirmed COVID-19.https://clinicaltrials.gov/show/NCT04336332 [Google Scholar]
- 30.US Department of Veterans Affairs . 2017. Profile of veterans: 2017.https://www.va.gov/vetdata/docs/SpecialReports/Profile_of_Veterans_2017.pdf [Google Scholar]
- 31.Garg S., Kim L., Whitaker M., O’Halloran A., Cummings C., Holstein R., Prill M., Chai S.J., Kirley P.D. Hospitalization rates and characteristics of patients hospitalized with laboratory-confirmed coronavirus disease 2019 — COVID-NET, 14 states, March 1–30, 2020. MMWR Morb. Mortal. Wkly. Rep. 2020;69:458–464. doi: 10.15585/mmwr.mm6915e3. [DOI] [PMC free article] [PubMed] [Google Scholar]
- 32.Azar K.M.J., Shen Z., Romanelli R.J., Lockhart S.H., Smits K., Robinson S., Brown S., Pressman A.R. Disparities in outcomes among COVID-19 patients in a large health care system in California. Health Aff. (Millwood) 2020 doi: 10.1377/hlthaff.2020.00598. Published online May 21, 2020. [DOI] [PubMed] [Google Scholar]
- 33.Food and Drug Administration (FDA) 2020. FDA cautions against use of hydroxychloroquine or chloroquine for COVID-19 outside of the hospital setting or a clinical trial due to risk of heart rhythm problems.https://www.fda.gov/drugs/drug-safety-and-availability/fda-cautions-against-use-hydroxychloroquine-or-chloroquine-covid-19-outside-hospital-setting-or [Google Scholar]
- 34.National Institutes of Health (NIH) 2020. Coronavirus Disease 2019 (COVID-19)Treatment Guidelines.https://www.covid19treatmentguidelines.nih.gov/ [PubMed] [Google Scholar]
- 35.Guan W.J., Ni Z.Y., Hu Y., Liang W.H., Ou C.Q., He J.X., Liu L., Shan H., Lei C.L., Hui D.S.C., China Medical Treatment Expert Group for Covid-19 Clinical characteristics of coronavirus disease 2019 in China. N. Engl. J. Med. 2020;382:1708–1720. doi: 10.1056/NEJMoa2002032. [DOI] [PMC free article] [PubMed] [Google Scholar]
- 36.Qin J., Shen Y. Statistical methods for analyzing right-censored length-biased data under cox model. Biometrics. 2010;66:382–392. doi: 10.1111/j.1541-0420.2009.01287.x. [DOI] [PMC free article] [PubMed] [Google Scholar]
- 37.Ray W.A., Liu Q., Shepherd B.E. Performance of time-dependent propensity scores: a pharmacoepidemiology case study. Pharmacoepidemiol. Drug Saf. 2015;24:98–106. doi: 10.1002/pds.3727. [DOI] [PMC free article] [PubMed] [Google Scholar]
- 38.Tian Y., Baro E., Zhang R. Performance evaluation of regression splines for propensity score adjustment in post-market safety analysis with multiple treatments. J. Biopharm. Stat. 2019;29:810–821. doi: 10.1080/10543406.2019.1657138. [DOI] [PubMed] [Google Scholar]
- 39.Hade E.M., Lu B. Bias associated with using the estimated propensity score as a regression covariate. Stat. Med. 2014;33:74–87. doi: 10.1002/sim.5884. [DOI] [PMC free article] [PubMed] [Google Scholar]
- 40.Yang S., Imbens G.W., Cui Z., Faries D.E., Kadziola Z. Propensity score matching and subclassification in observational studies with multi-level treatments. Biometrics. 2016;72:1055–1065. doi: 10.1111/biom.12505. [DOI] [PubMed] [Google Scholar]
- 41.Rubin D.B. On principles for modeling propensity scores in medical research. Pharmacoepidemiol. Drug Saf. 2004;13:855–857. doi: 10.1002/pds.968. [DOI] [PubMed] [Google Scholar]
Associated Data
This section collects any data citations, data availability statements, or supplementary materials included in this article.
Supplementary Materials
Abbreviation: HC, Hydroxychloroquine; AZ, Azithromycin; IQR, Interquartile range; NA, not applicable. International System of Units (SI) conversion factors: to convert creatinine to micromoles per liter, multiply by 88.4; alanine aminotransferase, aspartate aminotransferase, lactate dehydrogenase to microkatals per liter, multiply by 0.0167; leukocytes, lymphocytes to x109 per liter, multiply by 0.001; serum albumin to grams per liter, multiply by 10.0; total bilirubin to micromoles per liter, multiply by 17.1 a Defined as medical diagnoses included in medical history by ICD-10 coding b Charlson Comorbidity Index predicts the 10-year mortality. The median score of 2 or 3 correspond to a 90% or 77% estimated 10-year survival, respectively.
Data Availability Statement
These analyses were performed using raw data that are available only within the US Department of Veterans Affairs secure research environment, the VA Informatics and Computing Infrastructure (VINCI). All relevant data outputs are within the paper and its supplemental information.