. 2020 May 27;9:e53853. doi: 10.7554/eLife.53853

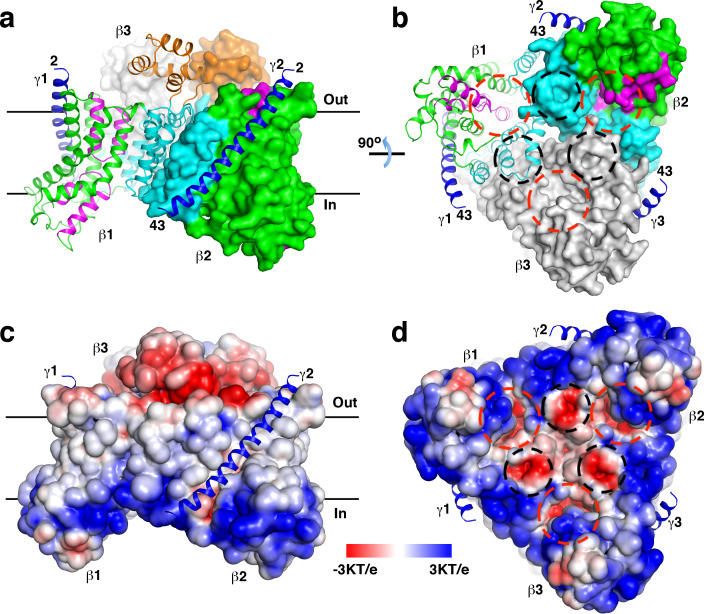
Figure 1. Overall structure of the StOAD βγ sub-complex.

(a)-(b) Structure of the StOAD β3γ3 hetero-hexamer. The γ subunits are colored in blue and shown in cartoon representation. The first and second β subunits (β1 and β2) are colored with the scaffold domain in cyan, core domain in green, domain E in orange and the helical hairpins in magenta. This coloring scheme is used throughout the manuscript unless otherwise indicated. The third β subunit (β3) is colored in gray. Cartoon representation of β1 and the molecular surfaces of β2 and β3 are shown. The first and last residues in the γ subunit visible in our structure are indicated (residues 2 and 43, respectively). Structural figures were prepared with PyMOL (www.pymol.org). (c)-(d) Electrostatic potential at the solvent assessable surface of the StOAD β subunit trimer. The views of panels (c) and (d) are identical to the views of panels (a) and (b), respectively. The γ subunits are presented in cartoon representation and colored in blue. The red and black circles in panels (b) and (d) indicate the first and second negatively charged regions in the β subunit cytoplasmic face, respectively. The black lines in panels (a) and (c) indicate the boundaries of the membrane bilayer.

Figure 1.

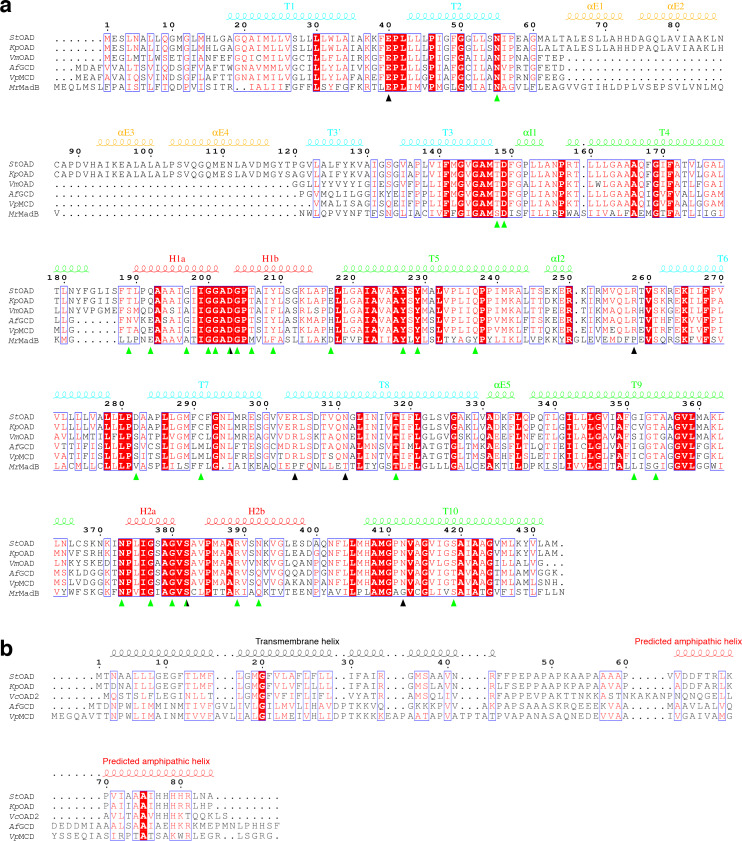
Figure 1—figure supplement 1. Sequence alignment of the OAD β (a) and γ (b) subunits and their equivalents in other decarboxylase sodium pumps.

Figure 1—figure supplement 1.

Residues numbers and secondary structure elements for the Salmonella typhimurium OAD (StOAD) are shown. Secondary structure elements for the β subunit are colored as in Figure 1. The black and green triangles indicate residues characterized by our study and previous studies on the Klebsiella pneumonia OAD (KpOAD), respectively. The predicted amphipathic helix at the C-terminal region of the γ subunit is indicated in red. VmOAD, Vibrio mediterranei OAD; AfGCD, Acidaminococcus fermentans GCD; VpMCD, Veillonella parvula MCD; MrMadB, Malonomonas rubra MadB; VcOAD2, Vibrio cholerae OAD isoform 2.
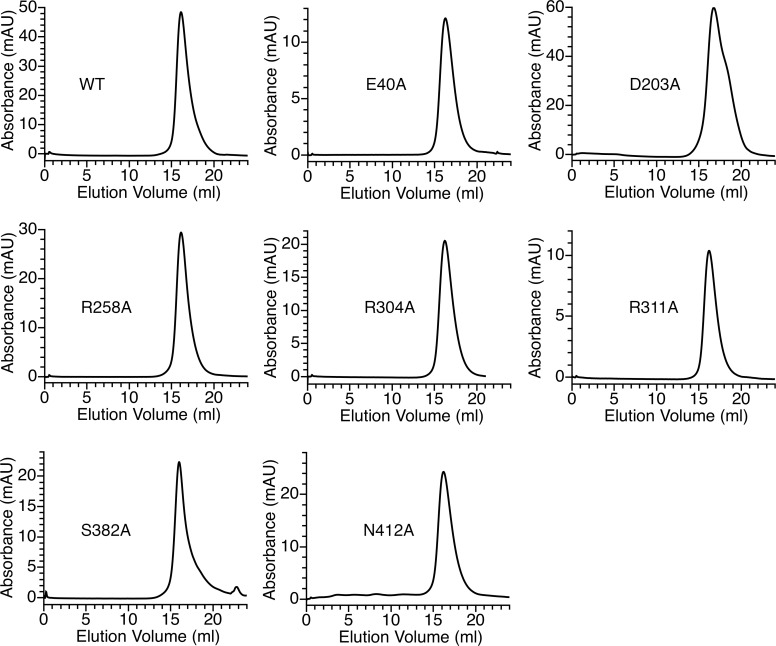
Figure 1—figure supplement 2. Gel filtration characterization of the wild type and substituted StOAD βγ sub-complex.

Figure 1—figure supplement 2.

The experiments were performed on a Supersose 6 column as described in Materials and methods.
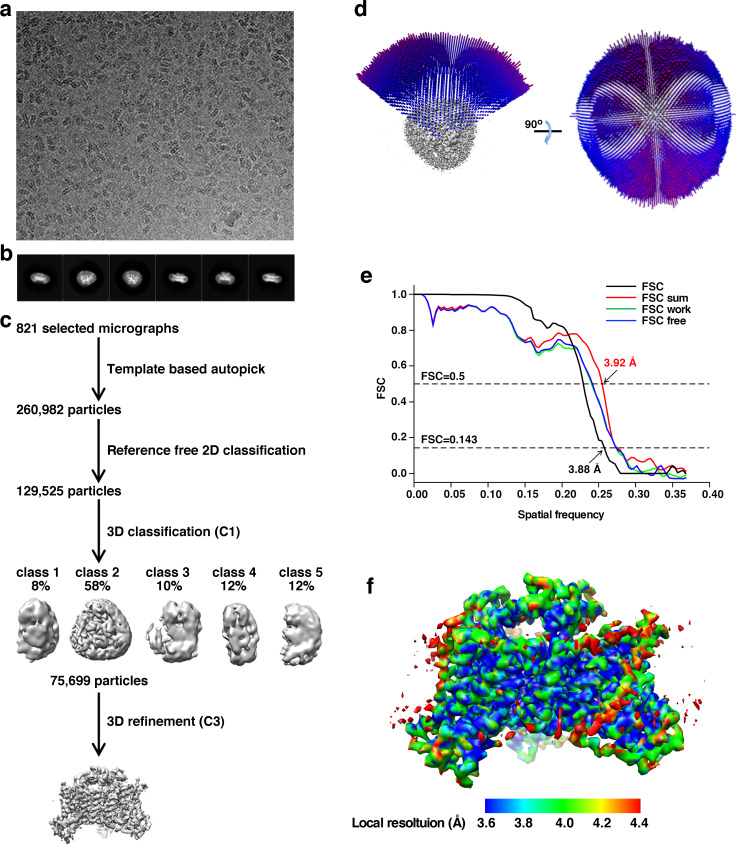
Figure 1—figure supplement 3. Structure determination of the StOAD βγ sub-complex by cryo-EM.

Figure 1—figure supplement 3.

(a) A representative cryo-EM micrograph. (b) Representative reference-free 2D averages. (c) Workflow of the 3D reconstruction. (d) Angular distribution of particles in the 3D reconstruction. (e) Fourier Shell Correlation (FSC) curves of the 3D reconstruction. FSC, gold-standard FSC curve between the two half maps; FSC sum, FSC between the atomic model and the map; FSC work, FSC between the first half map and the atomic model refined against this map; FSC free, FSC between the second half map and the atomic model refined against the first half map. Resolutions for FSC = 0.143 and FSC sum = 0.50 are indicated. (f) Local resolution of the cryo-EM map.
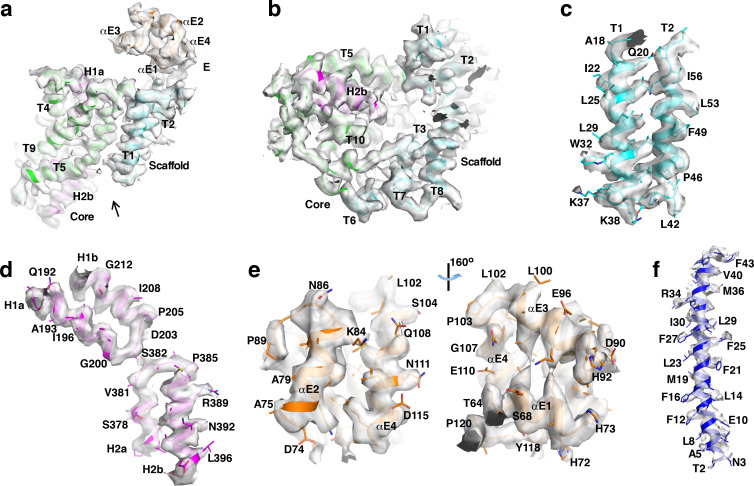
Figure 1—figure supplement 4. Cryo-EM densities.

Figure 1—figure supplement 4.

(a)-(b) Density for the β subunit. In panel (b), one views along the arrow in panel (a). (c)-(e) Densities for representative regions in the β subunit: helices T1 and T2 (c), the helical hairpins (d), the E domain (e). (f) Density for the γ subunit. Densities for the β and γ subunits are contoured at 5σ and 4σ, respectively. The refined structure is shown for reference.
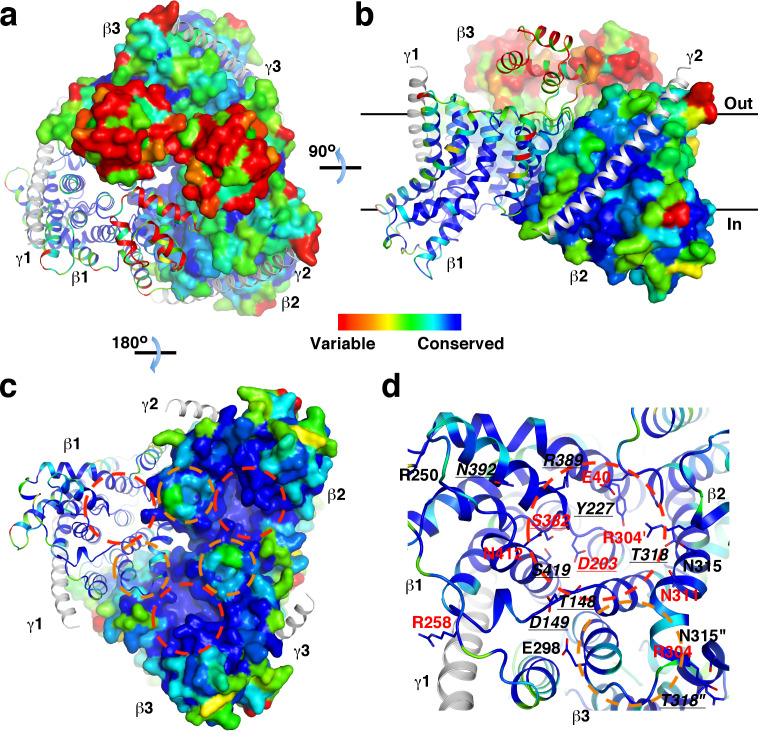
Figure 1—figure supplement 5. Conservation of individual residues in the β subunit.

Figure 1—figure supplement 5.

Residues in the StOAD β subunit are colored according to their conservation calculated from 150 sequences of OAD, MCD or GCD identified by the Dali server. The γ subunits are presented in cartoon representation and colored in gray. (a)-(c) Conservation of residues in the β subunit. One of the β subunits in the StOAD βγ sub-complex is presented in cartoon representation and the other two are in surface representation. (d) Conserved residues with polar or charged side chains in the β subunit cytoplasmic face. Residues labeled in red and with underlined labels were characterized by our study and previous studies on KpOAD, respectively. The ′ and ″ signs indicate residues in the second and third β subunits in the βγ sub-complex, respectively. The red and orange cycles in (c) and (d) indicate the first and second negatively charged regions in the β subunit cytoplasmic face, respectively.
Figure 1—figure supplement 6. The γ subunit C-terminal tail plays a critical role in the interaction between the α subunit and the βγ sub-complex.
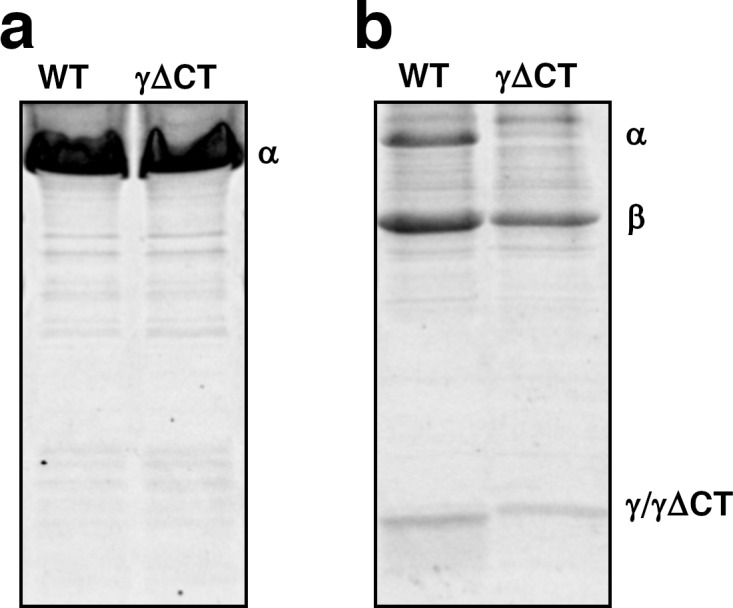
Figure 1—figure supplement 6.

(a) The γΔCT truncation does not significantly change the protein level of the α subunit in the soluble fraction. SDS-PAGE analysis of the α subunit purified by monomeric avidin agarose from the soluble fraction is shown. (b) The γΔCT truncation severely inhibits the interaction between α subunit and the βγ sub-complex. SDS-PAGE analysis of proteins in the membrane fraction purified by Ni-NTA agarose is shown. The resin binds to the 6x Histidine tag engineered to the N-terminus of the γ subunit. The StOAD subunits are indicated. The identity of γΔCT has been confirmed by mass spectrometry.