Abstract
Real-time object identification and classification are essential in many microfluidic applications especially in the droplet microfluidics. This paper discusses the application of convolutional neural networks to detect the merged microdroplet in the flow field and classify them in an on-the-go manner based on the extent of mixing. The droplets are generated in PMMA microfluidic devices employing flow-focusing and cross-flow configurations. The visualization of binary coalescence of droplets is performed by a CCD camera attached to a microscope, and the sequence of images is recorded. Different real-time object localization and classification networks such as You Only Look Once and Singleshot Multibox Detector are deployed for droplet detection and characterization. A custom dataset to train these deep neural networks to detect and classify is created from the captured images and labeled manually. The merged droplets are segregated based on the degree of mixing into three categories: low mixing, intermediate mixing, and high mixing. The trained model is tested against images taken at different ambient conditions, droplet shapes, droplet sizes, and binary-fluid combinations, which indeed exhibited high accuracy and precision in predictions. In addition, it is demonstrated that these schemes are efficient in localization of coalesced binary droplets from the recorded video or image and classify them based on grade of mixing irrespective of experimental conditions in real time.
I. INTRODUCTION
Droplet microfluidics generates and manipulates discrete droplets having tiny-volumes inside microchannel networks through two or more immiscible multiphase flows.1–3 Furthermore, droplet microfluidics plays a decisive role in many microfluidic applications, particularly in lab-on-a-chip (LOC) or micro-total-analysis systems (TAS) owing to its immense potential with regard to on-demand droplet generation, manipulation of tiny volumes, precise encapsulation, programmability, reconfigurability, high throughput, and so on.2,4–7 Moreover, it offers many technical advantages8 and are being deployed in many applications involving single-cell encapsulation and analysis,9 rapid screening, effective volume control, fast species mixing, accurate extraction and separation, efficient chemical synthesis,10–13 and so on. With such microfluidic platforms, the mono-dispersed droplets can easily be created, transported, stored, splitted, and sorted by passive or active means to accomplish desired functionality.14–17 Many a time, these droplets act as a micro-reactor in which chemical or bio-chemical analysis such as titration, precipitation, hydrolysis, particle synthesis, enzyme or protein analysis, cell culture, and barcoding are executed.2,15,18
The basic requirement for generating such tiny chemical reactors inside a microchannel is two or more immiscible fluids in continuous and discrete phases as well as a junction to shear off the fluid. Typically, flow geometries such as T-junction,19 co-flow, and flow-focusing configurations20–22 are being used for passive droplet generation by employing continuous and dispersed fluids.23 The droplet break-up regimes are ensued based on the capillary number, flow ratio, and viscosity of fluids.24–26 The droplets formed encompass different types of reagents and mixing of species occurred due to chaotic advection rather than dispersion.27 Another strategy is formation of alternative droplets having desired reagents exclusively and allow them to coalesce inside the channel by a passive manner.28–31 Moreover, binary droplet coalescence in microchannels was obtained by means of expansion sections,32 diverging–converging geometries,33 circular sections,10 pillar-induced fusion,34 and sequential fusion.35 Thus, binary droplet merging techniques in conjunction with microfluidics is a promising technology in many scientific and engineering disciplines.36–42 The colorimetric and fluorescent images play a major role in on-line monitoring of the homegenization of multi-species occurring in such micro-reactors.43–50 Note that binary droplet mixing in a microchannel depends on many factors such as the flow velocity, the diffusion coefficient, viscosities of fluids, interfacial tension, capillary pressure, the insertion angle, and wettability.28,51–53 The analytical detection methods employed are bright-field and fluorescence microscopies, laser-induced fluorescence, Raman, mass, and nuclear magnetic resonance spectroscopies, electrochemistry, capillary electrophoresis, absorption detection, and chemiluminescence. Nevertheless, optofluidic techniques are currently predominant to detect mixing inside binary-coalesced droplets owing to its flexibility, rapidness, and sensitivity.10,28,46,54,55
Typically, in a micro-reactor, Janus-like droplets having two species move along the channel and sample homogenization enhances due to chaotic advection. Real-time estimation of mixing inside such droplets is very important for monitoring the extent of the chemical reaction/biochemical analysis.31,54 Indeed, a continuous color/pattern change inside the droplet corresponds to the degree of mixing.46,56 For instance, binary droplet fusion in a microchannel is continuously quantified using a laser-induced fluorescence technique57 and micro-particle image velocimetry (μ-PIV) visualization.40 The quantification of mixing within the merged binary droplet was estimated deterministically using grayscale optical images56,58 by calculating the standard deviation of pixel intensities. However, in practical microfluidic applications, where the droplet specific features such as the color of mixtures, the type of reagents used, fluid convection inside, the presence of proteins or biological cells, etc., limits its applicability. Therefore, a better approach to quantify micromixing irrespective of experimental, lighting, and reagent properties is required for real-time applications. Most importantly, the real-time detection of biological or synthetic targets is an important functionality that an efficient TAS should possess.59–62 The technological advancements in computer hardware and computer vision algorithms paved the way for the emergence of artificial intelligence (AI) techniques for pattern recognition and detection in microfluidic applications in general and biotechnology, in particular.63–68
Artificial neural networks encompass many connected neurons so as to learn to perform tasks when trained with relevant data such as images, audios, videos, and so on. An advanced version of it, convolutional neural networks (CNNs) are such huge networks especially used for extracting features from data in an unsupervised manner.64,69 Such new generation networks are used in fluid dynamics problems such as positional information tracking,70 bubble recognition in two phase bubbly jets,71 and so on. However, for applications such as lab-on-a-chip where microchannel flows have to be continuously monitored, real-time optical image processing and feature extraction are of high demand.59–62,64,72 Furthermore, CNNs such as the You Only Look Once (YOLO) series73–75 and the Singleshot Multibox Detector (SSD)76 are fast in detection tasks and can be used in real time with low computational cost. Though the mixing patterns inside the microdroplets are very complex, the CNN may be employed to quantify the magnitude of mixing, avoiding conventional approach of determining the standard deviation of pixel intensities inside droplets under consideration. Since droplet microfluidics is the most promising technology in terms of both detection and isolation, the adaptation of deep learning schemes in microfluidics is expected to be a game changer.77 To the best of the authors’ knowledge, real-time detection of droplets and quantification mixing in fused binary droplets using optical images and deep neural networks are not performed. In the present work, two different CNN schemes are deployed to detect and classify the degree of mixing inside binary merged droplets passing through microchannels in a real-time manner.
This paper is structured as follows: Sec. II briefs about the methodology of microfluidic device fabrication, fluid flow visualization, data acquisition, neural network architecture, and training. Section III details on microdroplet generation and mixing associated with different channel geometries and reagent properties. Furthermore, the neural network training and testing in connection with droplet mixing is discussed before the conclusion in Sec. IV.
II. METHODOLOGY
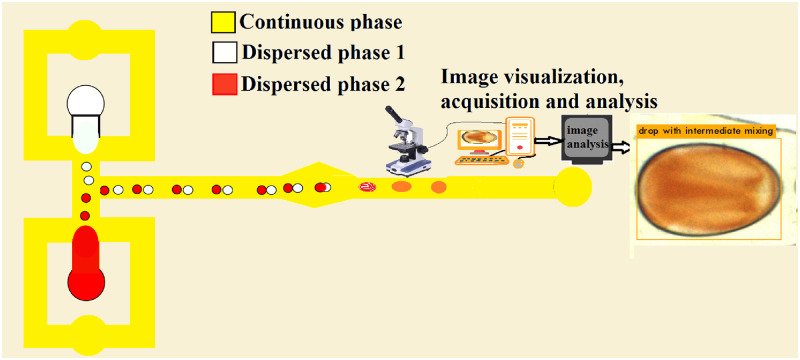
In this section, fabrication of microchannels, droplet generation and coalescence, visualization of mixing inside droplets, dataset creation, and CNN architecture are presented in detail as in the workflow chart given in Fig. 1. Microfluidic devices for conducting experiments are fabricated using the polymethylmethacrylate (PMMA) material. The channel is made precisely by computer numerical control (CNC) milling and closed with a cover plate of the same material using thermal bonding. Thereafter, to generate droplets, silicone oil is used as the continuous phase, and aqueous solutions of reagents are used as a dispersed phase. Fluids are pumped into the device using two injection pumps, flow visualization is carried out by an inverted bright-field microscope, and image acquisition is performed by the associated CCD camera unit. The mixing efficiency determination of individual droplets in the flow field is carried out using ImageJ software and a custom python program to enhance the classification efficiency. Droplet classification and labeling are performed manually using LabelImg software. Neural network recreation and training are carried out using Keras, TensorFlow, and Darknet deep learning libraries compiled with OpenCV and custom python scripts. The developed model is re-trained several times by fine-tuning the hyper-parameters until a high detection accuracy is achieved.
FIG. 1.
Schematic diagram of droplet generation in a flow-focusing microchannel, droplet fusion, and image analysis and prediction using a deep neural network. Alternate droplets with different properties are produced in upper and lower branches, and merging occur in the diverging–converging section.
A. Microfluidic device fabrication
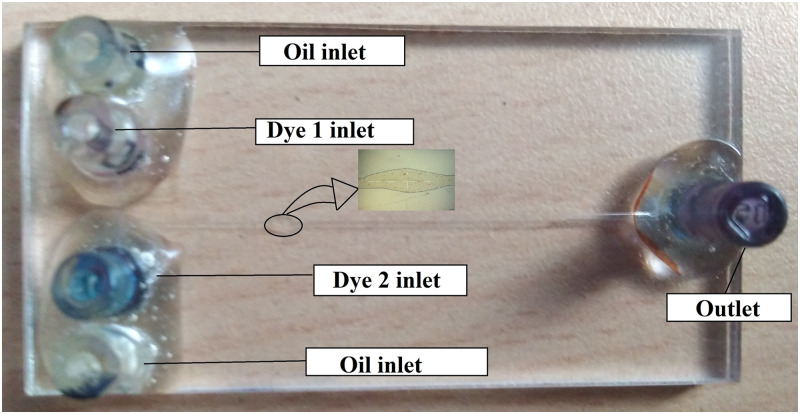
In this section, steps involved in the fabrication of microfluidic devices used for conducting experiments are discussed. Generally, PMMA is a quality material to fabricate microfluidic devices due to its low cost, less preparation time, high transparency, good machinability, and scope for easiness in an automated fabrication process.78 The microchannel is modeled in the Vcarve software, and the output CNC code is deployed to operate the ShopBot machine. Channels are milled on a PMMA sheet of 2 mm thickness using a tungsten carbide end milling tool of 250 diameter. The milling process is done in two steps; a coarse-cut at a spindle speed of 12 000 rpm, followed by a fine-cut at a spindle speed of 18 000 rpm, keeping the feed and depth of cut at 0.5 mm/min and 50 , respectively. The milled microchannel plate and cover plates are cleaned using the iso-propyl alcohol and distilled water. The channel geometry is rectangular in shape with an average width of m for a single pass of the tool. The entire microchip is cut off from a PMMA sheet with a dimension using a laser cutting machine (Epilog Engraver, USA). Corresponding cover plates with connector holes that are concentric to reservoirs in the channel plate are also made with the same dimensions as that of the channel plate as shown in Fig. 2.
FIG. 2.
Flow-focusing device fabricated using a CNC milled PMMA sheet thermally bonded with a cover plate and connections attached.
The thermal bonding is an effective and simple method to close a microchannel permanently.79 Here, the microchip counterparts are kept in physical contact with uniform pressure for a pre-defined period of time under a temperature more than the glass transition temperature. The minimum pressure to be applied uniformly on the two sheets simultaneously to facilitate thermal bonding is found to be 200 kPa. A compression spring loaded fixture is fabricated to provide the necessary uniform pressure on a metal plate assembly. The compression springs are calibrated initially by conducting a load test, and the average stiffness of springs under a range of operation is found to be 8 kgf/mm. The compression required is calculated by the pressure to be applied on the chip surface area. It is estimated that a 0.4 mm compression for individual springs is sufficient for the bonding process. The whole assembly is heated for 120 min from room temperature, C to C in a muffle furnace (3 kW) followed by air cooling. The channel plate and cover plate are bonded together, thereby closing the channel. The maximum depth variation from the bonding procedure is found to be 50 . Thus, the channel cross sectional dimensions obtained are . The reproducibility of the procedure is ensured by measuring dimensions of a few selected micro-chips.
Thereafter, flexible capillary tubes of an inner diameter of 1.3 mm and an outer diameter of 3.7 mm are used as a connector for the microfluidic chip. The cover-plate holes are already drilled using a laser cutter such that a connector tube ensures a tight fit. The connection is made leak proof by the combination of Araldite® and M-seal® epoxy adhesives. The leak test is done by passing water through the channel at velocity 50 times higher than the maximum velocity required during the experiment. The device did not exhibit any water leakage and found to be good for conducting experiments since it is resilient to high pressures.
B. Passive droplet generation and coalescence
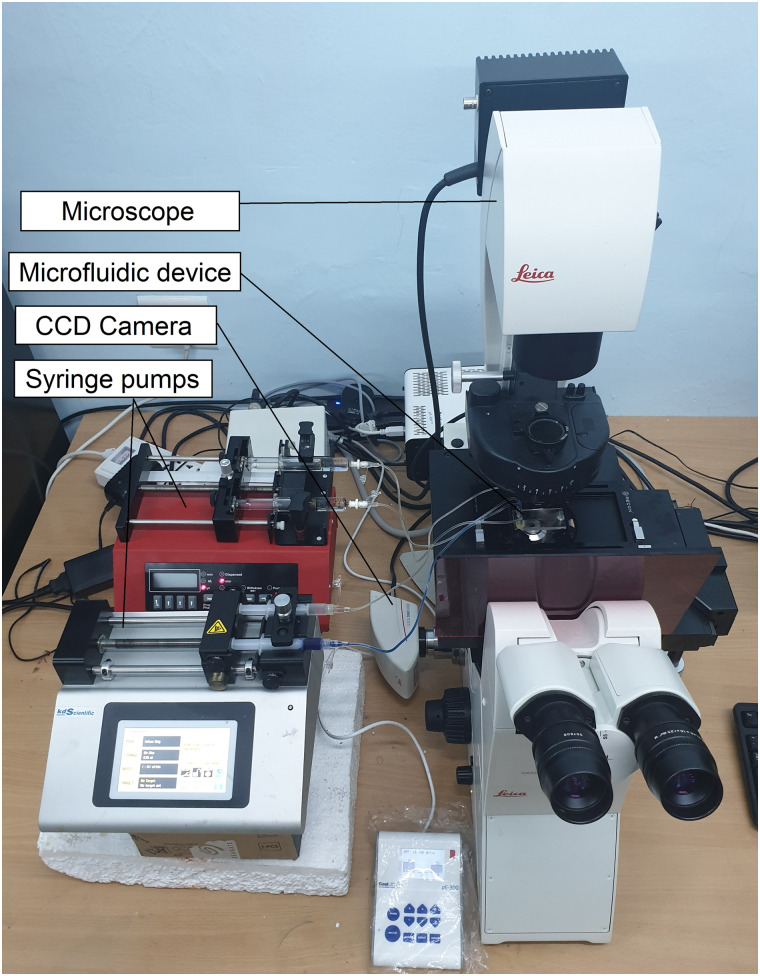
In this study, two different microchannel configurations are used for droplet generation and merging. Generally, a continuous flow squeezes the dispersed phase and droplets are generated when a shear force overcomes the surface tension force.80 Here, a double T-junction and a flow-focusing device are used to produce alternative mono-disperse droplets of two reagents and are allowed to merge passively in the channel. The droplet fusion section is varied in dimensions (a diverging section) to retard succeeding droplets to ensure binary merging and to visualize different mixing patterns.35 The droplet generation in the microchannel depends on the capillary number of the continuous phase, where is the mean flow velocity, is the dynamic viscosity, and is the interfacial tension between continuous and dispersed phase fluids. The flow rate of the continuous phase varied from 2 to 10 as well as that of the dispersed phase from 0.5 to 2 such that varies between 0.006 and 0.02. The microfluidic device is connected to syringe pumps (NE4002X and KDS Legato 111 Makes), and the flow is visualized by a microscope (Leica DMi8) working under 4 optical magnification. Then, images are captured using a CCD camera (DMC4500) as shown in Fig. 3. Image resolution is varied from to pixels depending on the area of the droplet merging region, and both static images and time lapsed videos of the binary droplets are recorded. Silicone oil (dynamic viscosity 0.971 Pa s and interfacial tension 37.8 mN/m81) is used as the continuous phase, and aqueous solutions of reagents given in Table I are used as the dispersed phases.
FIG. 3.
Experimental setup consisting of two syringe pumps, a microfluidic device, a microscope, a CCD camera, and a computer system for image acquisition and analysis.
TABLE I.
Details of dyes used to generate droplets for binary merging.
| Species | Molecular mass (g/mol) | Concentration (moles/l) |
|---|---|---|
| Potassium thiocyanate | 97.18 | 0.369 |
| Ferric chloride | 162 | 0.123 |
| Iron thiocyanate | 230.09 | 0.123 |
| Methylene blue | 319.85 | 0.075 |
| Sunset yellow | 452.36 | 0.075 |
C. Mixing quantification
All the images obtained are indeed binned into three different categories: low mixing, intermediate mixing, and high mixing for CNN training and testing. The classification of fused droplets is performed by manual and mixing index methods. Mainly, a standard procedure to determine the degree of mixing is adopted to classify images. The approach is to take grayscale pixel values of the entire droplet area for which mixing efficiency is to be estimated and finding the standard deviation of pixel intensities at that section to quantify mixing. In this regard, relative mixing index (RMI) is chosen, and it is the ratio of the standard deviation of pixel intensities in a cross section to that of the unmixed state. The RMI value is obtained as
| (1) |
furthermore, mixing efficiency also is defined as
| (2) |
where is the th pixel intensity, is the mean pixel intensity in the selection, is the mean pixel intensity in the unmixed state, and is the total number of pixels in the selection.58 Low-mixing, intermediate-mixing, and high-mixing categories are labeled according to values of 0–0.5, 0.5–0.75, and 0.75–1, respectively. However, it is noticed later that the mixing efficiency that is expected to increase with a time lapse is decreasing drastically for a few outliers especially in the intermediate mixing cases. Furthermore, the coalescence of droplets that leads to a completely new color leads to an inaccurate RMI prediction owing to the deficiency of proper reference values. In these situations, the binning is carried out by visual judgment. Therefore, approximately 20% of the images are categorized manually to appropriate classes.
D. Convolutional neural networks for real-time object detection
A CNN refers to an artificial neural network capable of converting unstructured data into structured to build complex concepts from simple ones. In this study, the CNN adopted is a specialized neural network, which uses image/video data for the training and extracts features to distinguish later. It is noteworthy that, different dye combinations, various sizes and shapes of droplets and complicated diffusion and convection patterns inside the droplets necessitate an advanced neural network to handle this scenario. For real-time applications, the network should be capable to process a large number of images per second. Networks such as YOLO series73–75 and SSD76 are much faster and can be used on-line for the object detection and categorization tasks. More specifically, lightweight real-time object detection networks, YOLOv3-Tiny(YOLOv3) and SSD300, are chosen for the present investigation. The difference between two networks lies in the detection part; while the YOLOv3 divides images into grids and finds the confidence score of each object being processed, the SSD predicts default bounding boxes instead of anchor boxes used in YOLOv3. Speciality of these networks is the ability to perform efficiently by the expense of limited computational resources. The comparison of the number of trainable parameters in each network is shown in Table II.
TABLE II.
Trainable parameters of neural networks.
| Network | Trainable parameters |
|---|---|
| SSD300 | 24 013 232 |
| YOLOV3-TINY | 8 674 496 |
The convolutional filters before the YOLOv3 anchor layer are changed based on the number of classes. The network architectures of YOLOv3 and SSD are shown in Fig. S1 of the supplementary material. The YOLOv3 network achieves more accuracy compared to their predecessors YOLOv1 and YOLO9000 by introducing batch normalization and scaling and short-cut pathways. The droplets are enclosed using bounding boxes and labeled to a pre-defined class which they belong using a LabelImg tool. For more implementation details of the CNN architecture, refer the previous work.82 The network training and testing was performed on a Dell precision tower 5810 with a 3.5 GHz Intel Pentium II Xeon processor, 16 GB of RAM, and 2 GB Nvidia Quadro K620 GPU.
III. RESULTS AND DISCUSSION
This section details about the droplet generation, its binary coalescence by experimental means, and mixing quantification employing deep neural networks.
A. Droplet generation
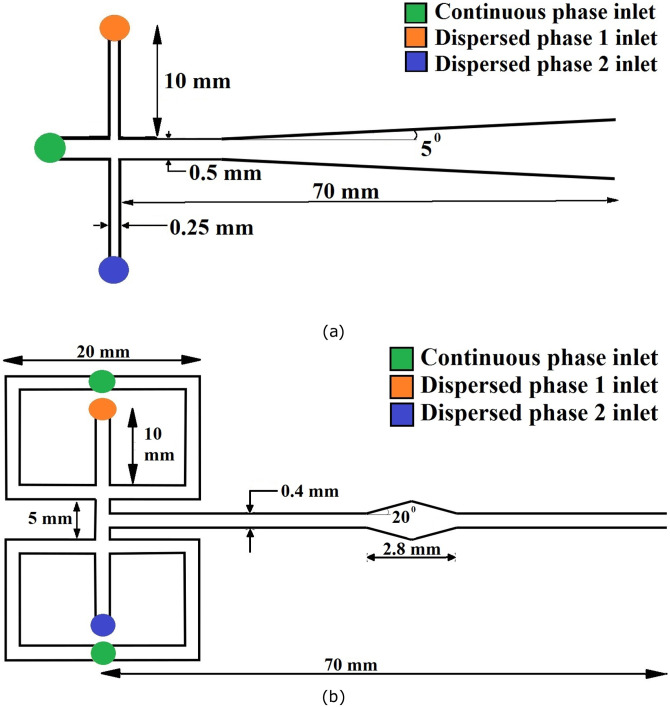
In this study, flow-focusing devices and double T-junction microchannel configurations are deployed for droplet generation. Both coaxial and off-setted double T-junctions are used for droplet generation and coalescence. At first, the coaxially configured T-junction as sketched in Fig. 4(a) is fed with two fluids having different surface tension and viscosities. A continuous fluid is allowed to pass through the main channel, while the alternating disperse phases are allowed through top and bottom inlets. Once the shearing force of continuous liquid overpowers the surface tension force of dispersed fluid, droplets are formed inside the microchannels.
FIG. 4.
Schematic diagram of (a) a coaxial double T-junction and (b) a flow-focusing microchannel configuration for alternating droplet generation and coalescence.
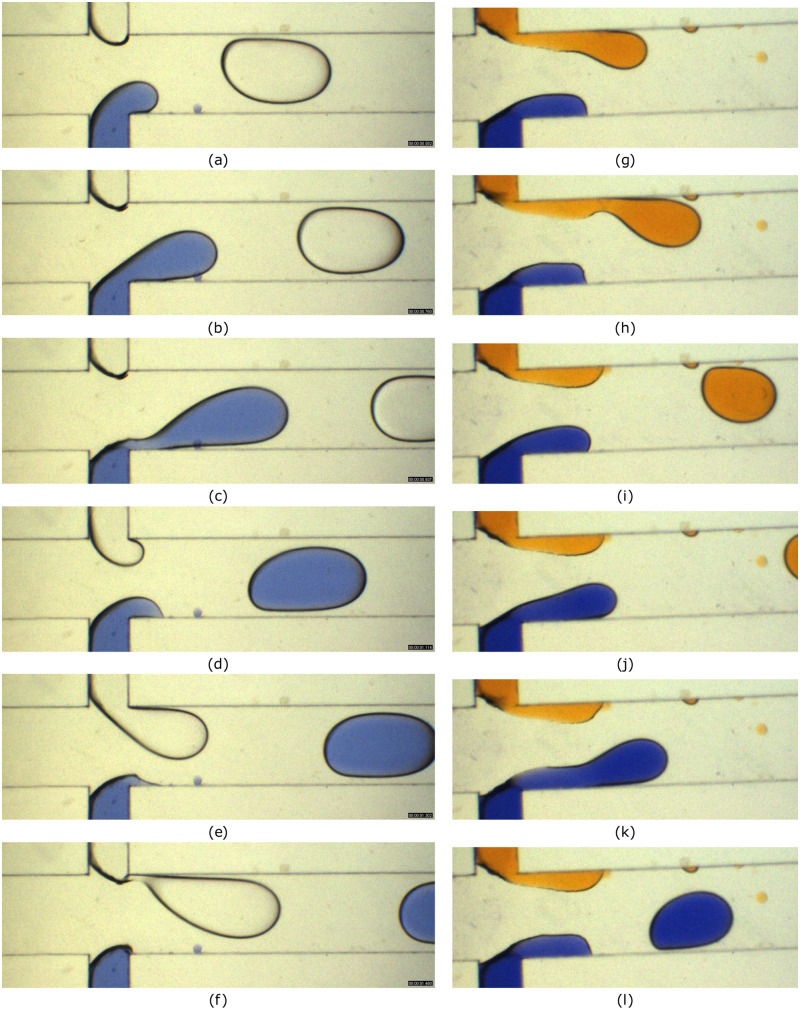
Alternating droplet generation is observed similar to the push–pull mechanism reported83 at a double T-junction device as shown in Figs. 5(a)–5(f). Furthermore, the simultaneous droplet generation is observed for a T-junction device with offset dispersed channels. The rise of the flow rate of the continuous phase resulted in a droplet break-up regime shifting to a dripping regime from a squeezing regime24 as evident in Figs. 5(g)–5(l). Note that, for both cases, different dyes are chosen to provide a generalized dataset for neural network training. Furthermore, at a predefined flow ratio of channel fluids, alternating monodispersed droplets are generated. In addition, by varying the flow-ratio, drops of different sizes are obtained for merging. Here, the ratio of the channel to droplet size is :1.
FIG. 5.
Transition of the droplet regime from squeezing (a)–(f) to dripping (g)–(l) in a microfluidic T-junction. Distilled water, methylene blue, and sunset yellow solutions are used as dispersed phases and silicone oil as a continuous phase. The flow rate of the continuous phase is 6 , and the dispersed phase flow rate is 2 for (a)–(f) (). The flow rate of the continuous phase is 10 , and the dispersed phase flow rate is 2 for (g)–(l) (). Images are captured at an interval of 180 ms for (a)–(f) and 220 ms for (g)–(l).
In contrast, a flow-focusing device as shown in Fig. 4(b) is used to avoid contact of the dispersed phase with channel walls and to increase monodispersity. For instance, the continuous fluid in the top branch squeezes the dispersed fluid from either side and the droplet forms at the middle of the junction as evident in Fig. S2 of the supplementary material. On the other hand, the second phase droplets in distilled water are generated at the lower branch. By varying the flow rate of the continuous phase from 2 to 10 and that of the discontinuous phase from 0.5 to 2 , near mono-disperse droplets of effective diameters ranging from 300 to 600 are obtained. The junction of a flow-focusing device is shown in Fig. 4(b), and due to the geometrical symmetry and the flow rate, the droplet twins meet near the junction. Moreover, these droplets move together through the main channel until it reaches the diverging–converging section where the droplet retards.
B. Droplet coalescence and mixing
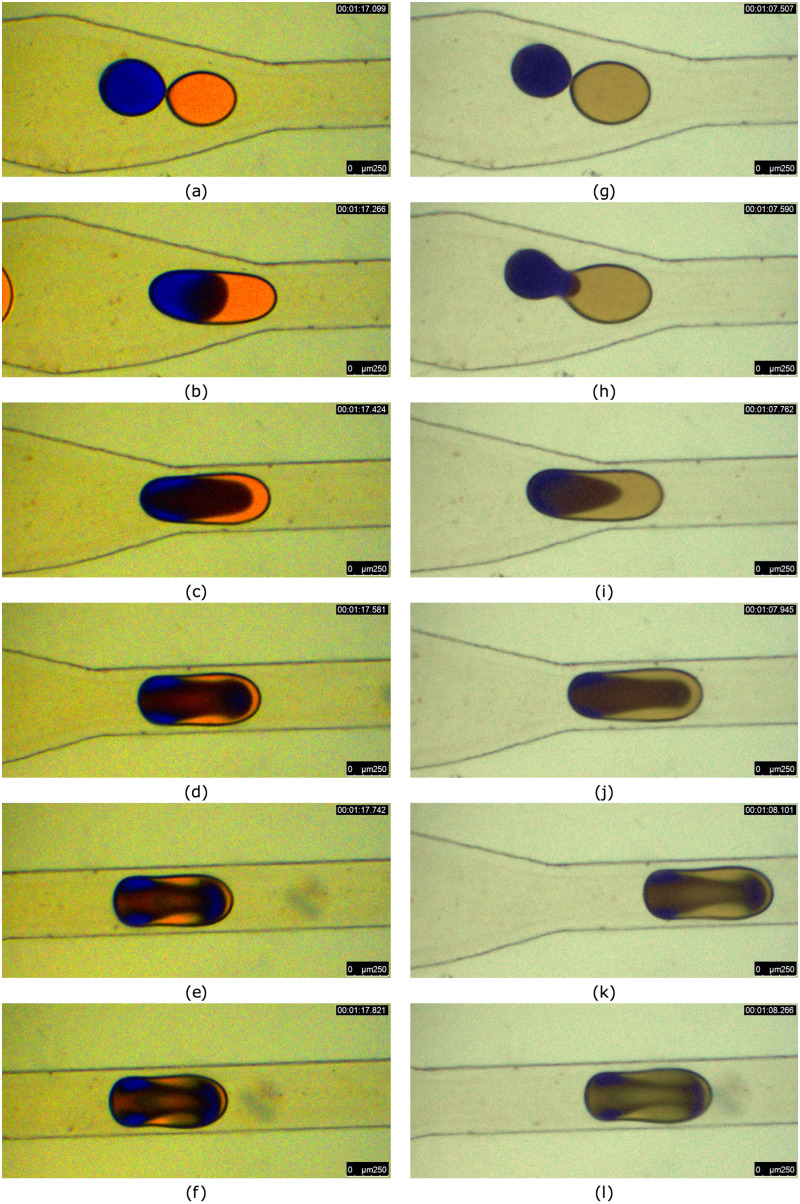
Thereafter, an instability is cased at the interface, which causes merging of two droplets, referred as decompression merging.33 The droplet fusion in a microchannel is a sequential process, including attachment, film drainage, interface coalescence, rupturing, and penetration depending on the channel geometry.55 Various dye (non-fluorescent) combinations are also used in order to visualize the mixing process under different conditions. The mixing modes include reactive mixing, diffusive mixing, and convective mixing. Moreover, there exists mixing resulted in a third color during binary reactive mixing as well. The RMI is used primarily for the estimation of mixing efficiency so as to classify the degree of mixing for all dye combinations used for the experiment. In some of the cases, irrespective of the initial conditions, the mixing patterns turned out to be similar in nature. For instance, the merging of droplets with equal and unequal sizes results in an identical mixing pattern, as observed in Fig. 6. It is noteworthy that the sunset yellow and methylene blue are used for mixing in both the cases. Even though the droplet size and dye intensity differ, the mixing patterns developed inside are similar as seen in Figs. 6(f) and 6(l).
FIG. 6.
Droplet merging in a diverging–converging section due to decompression. Sunset yellow and methylene blue solution are used as dispersed phases and silicone oil as a continuous phase. (a)–(e) represent mixing of equal droplets and (g)–(l) represent mixing of unequal droplets. The flow rate of the continuous phase is 5 and the dispersed phase flow rate is 1 . Images are captured at an interval of 180 ms.
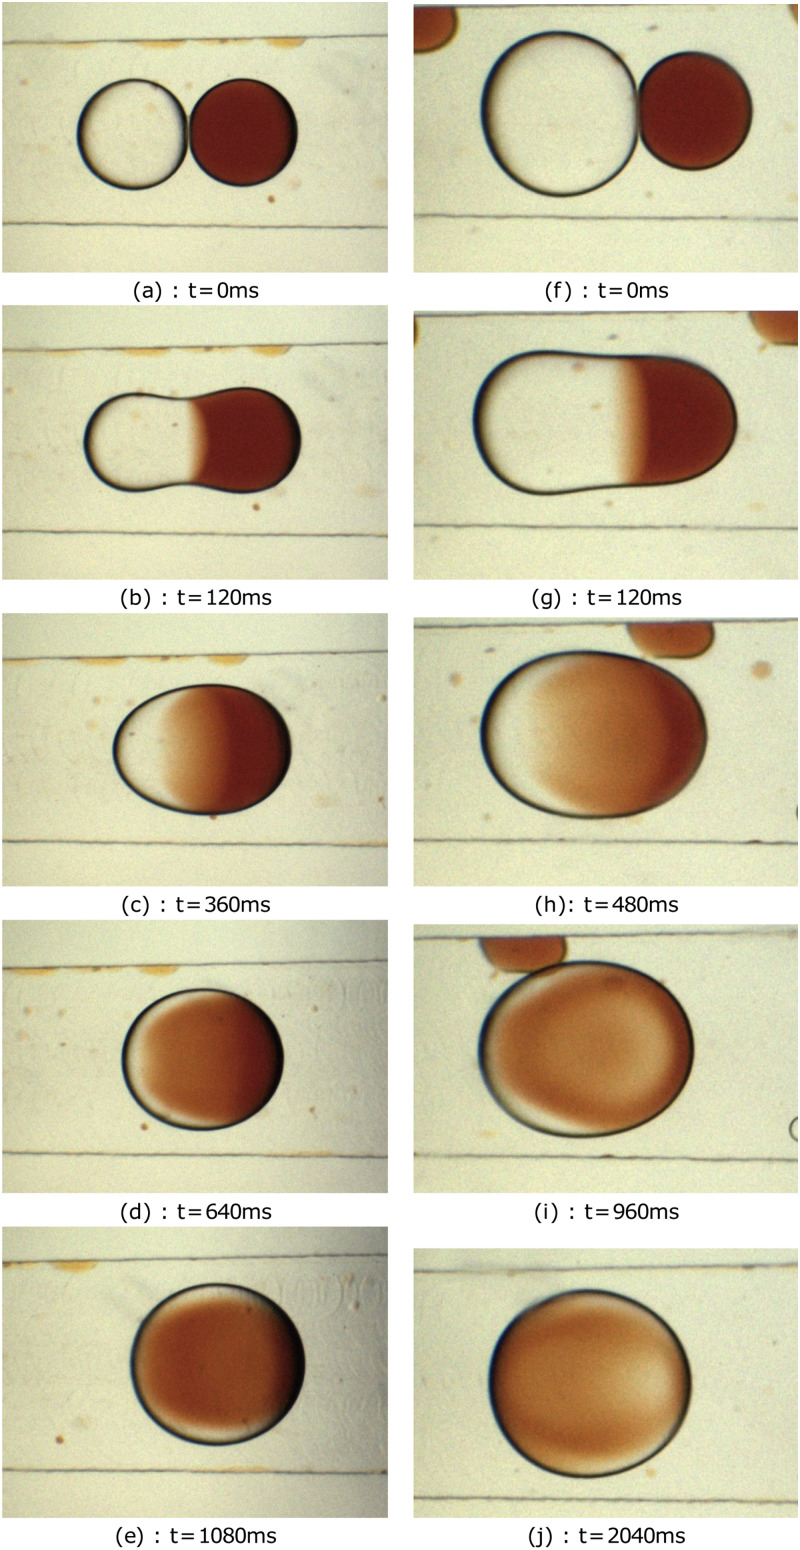
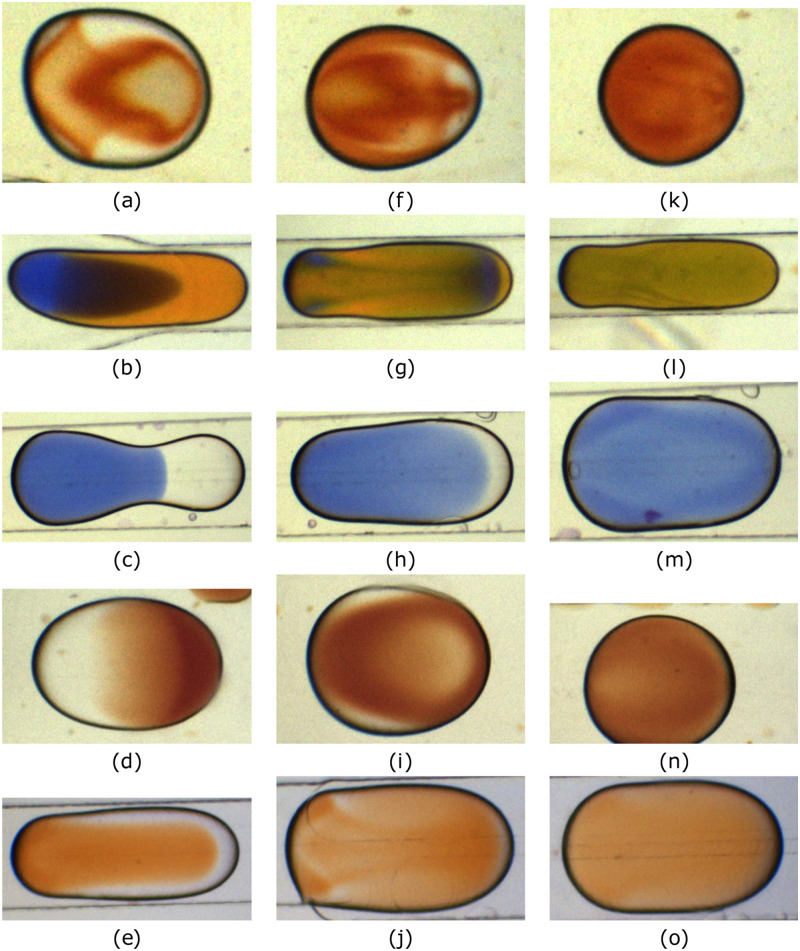
Next, Fig. 7 depicts mixing patterns developed by the merging of water and iron-thyocyanate droplets in a microchannel. Here, the multicomponent droplets are identical in size as in Figs. 7(a)–7(e). In contrary, Figs. 7(f)–7(j) demonstrate fusion of droplets having un-identical sizes and shapes. Moreover, when the merged droplet traverses the microchannel, the level of mixing changes from low to intermediate and finally to high as shown in Fig. 8. Indeed, these three classifications are used in the current study to categorize the degree of mixing inside the coalesced droplets. Initially, just after the droplet fusion is initiated, the fluid from one of the parent droplet penetrates into the other as seen in Figs. 8(a)–8(e) in the low-mixing category. Note that the geometry of the binary droplet in this regime is not symmetric and is complex. Thereafter, the droplet transported downstream and mixing promoted further due to diffusion and convection, and an intermediate state is reached as in Figs. 8(f)–8(j). The droplet advances stream-wise and mixing completes. Then, the concentration of fluids in the droplet reaches uniformity throughout the volume and high mixing is accomplished. Later, these categorizations are employed by the neural networks to classify the recorded images. Importantly, the shape, size, color, and concentration values of the merged droplets are different; consequently, the detection and classification turn to be a difficult task for the neural network. The merging droplet micrographs are collected, classified, and labeled manually. The dataset consists of 1273 images consisting of 1442 manually labeled bounding box annotations for each of the merging droplet. In order to distinguish merging droplets perfectly, some unmixed droplets were intentionally present in the flow field and they remained unlabeled. Labelled images were split as training and testing datasets as shown in Tables III and IV.
FIG. 7.
Droplet coalescence and mixing of iron thyocyanate and water droplets of (a)–(e) unequal and (f)–(j) equal sizes in a T-junction microchannel. Diameters of unequal droplets are 600 and 400 and the diameter of equal droplets is 500 .
FIG. 8.
Sample image dataset and classes. (a)–(e) belong to a class of low-mixing droplets, (f)–(j) belong to droplets with intermediate mixing, and (k)–(o) belong to a class of highly mixed droplets.
TABLE III.
Merged droplet dataset.
| Total number of images | 1273 |
|---|---|
| Training dataset | 1020 |
| Validation dataset | 127 |
| Testing dataset | 126 |
TABLE IV.
Labeled classes and the number of images.
| Label | Total count | Training | Testing |
|---|---|---|---|
| Drop with less mixing | 248 | 200 | 48 |
| Drop with intermediate mixing | 611 | 493 | 118 |
| Drop with high mixing | 583 | 473 | 110 |
C. Training and testing of CNN
This section elaborates on the creation of the image data set of merged droplets, training of CNN, and testing to classify the degree of mixing. The experiment and visualization are conducted using different reagent pairs and microchannel geometries, which contributed to a custom dataset of images for training and testing of CNNs. The various mixing patterns are generated inside the droplets, which are influenced by the channel geometry, the flow rate, the type of fluid, the size of the droplet, the droplet color, convection currents inside drops, the diffusion coefficient of fluids, and the sequence of merging. The CCD camera exposure rate is controlled randomly to avoid biasing of the training data. In order to avoid over-fitting of the training data, image augmentation techniques such as horizontal and vertical flipping, resizing, and random cropping are performed on acquired images to improve detection and classification accuracy. Thus, the initial image dataset with 1273 color images resulted in 6365 images after the augmentation.
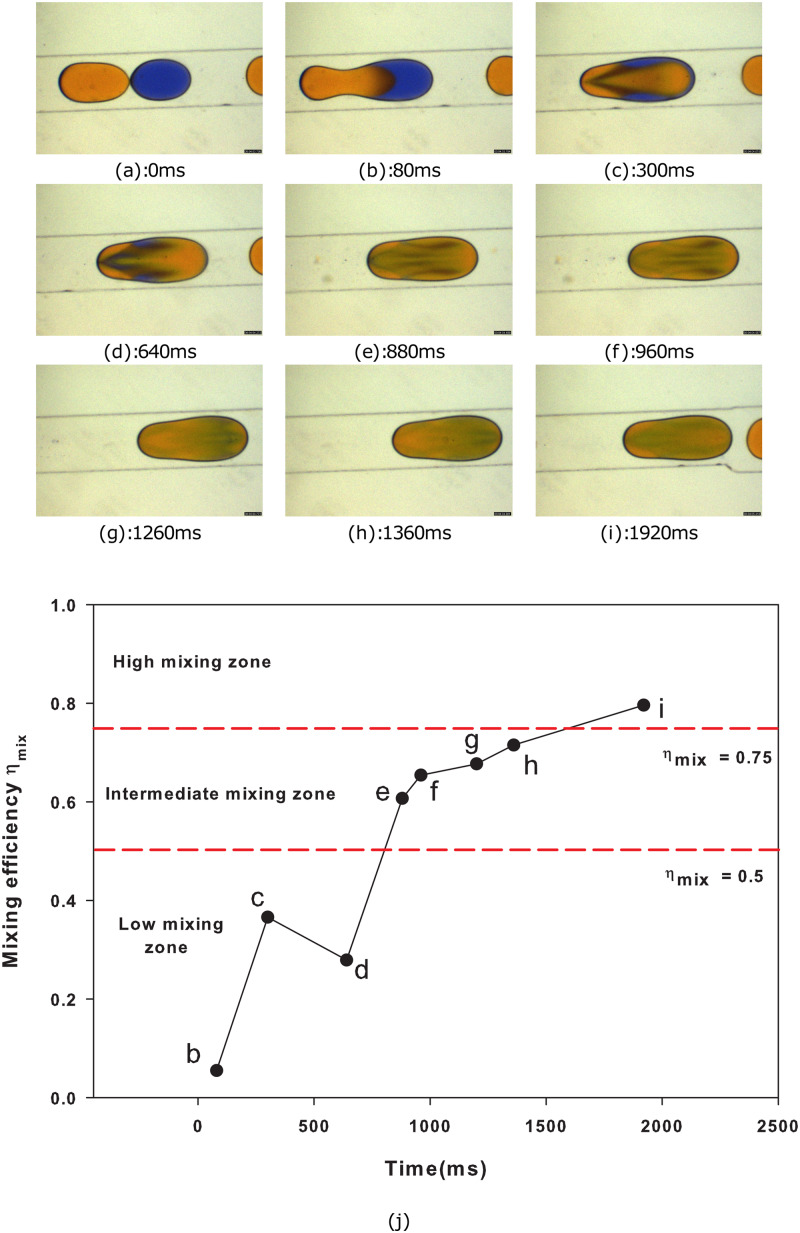
The classifications to train CNN are based on the extent of mixing, which is calculated by the RMI method for individual droplets or by manual means. The droplet boundary is selected and pixel intensities inside the selected boundary; initial pixel intensity values of individual droplets are measured using ImageJ software, and is evaluated using a custom python program employing Eq. (2). In boundary value cases, based on the value, the droplets are classified into low-mixing, intermediate-mixing, and high-mixing classes. For instance, Fig. 9 demonstrates the time evolution of mixing in a merged droplet generated from sunset yellow and methylene blue. Here, the droplet merging starts at time ms and that elevates as the droplet moves along the flow. Then, the mixing progresses to an intermediate stage around ms. Later, complete mixing takes place and homogenization of species is occurred. The values of the droplet against time are plotted in Fig. 9(j), which helped in identifying marginal cases.
FIG. 9.
Mixing efficiency determination of the merged droplet in a diverging channel using the RMI method. Methylene blue and sunset yellow are used as dispersed phases and silicone oil as a continuous phase. The continuous phase flow rate is 10 and the dispersed phase flow rate is 2 . (a)–(i) Sequence of images shows merging of droplets, and (j) depicts variations of the mixing efficiency of a fused droplet against time. The duration of species homogenization for low-mixing, intermediate-mixing, and high-mixing categories is 0–360 ms, 360 ms–1400 ms, and 1400 ms–2400 ms, respectively. Iso-efficiency lines demarcate all the three classes.
Extreme care is taken while preparing the dataset such that no other parameters such as the droplet size, shape, and color of droplets becoming a distinguishable feature of any of the classes. To this end, the droplets having identical sizes with different reagents are allowed to merge, and subsequent images are recorded to avoid the size dependence of data. Thereafter, experiments are repeated for different droplets with sizes spanning from 125 to 280 . Furthermore, the droplet merging is monitored for the same size and shape, instead with different reagents to circumvent data biasing toward the color. A wide range of droplet merging intermediate shapes are also taken at different locations in the channel to mitigate the data skewing. Though provides satisfactory estimation for low mixing and high mixing, an intermediate mixing regime finds to be fluctuating with a zig-zag pattern due to internal circulation of droplets. In addition, mixing efficiency determination of the reactive mixing process with is pointless as unmixed pixel intensities have no relation with mixed state pixel intensities. In such cases, classification is done by manual inspection. Since localization of the merging droplet is necessary during detection, the merging droplets in the training and validation dataset are bounded by rectangular boxes, and the coordinates of these boxes are also fed to networks along with images in order to distinguish between classes as well as background features such as channel walls, unmixed droplets, and other noisy features of images.
The resolution of images taken from a CCD camera is varied according to the field of view. Images of resolution that vary from pixels to pixels are used for training purposes. Due to high computational cost, full resolution images cannot be directly used for CNN training. All images are resized to a uniform resolution before feeding to the network. For the SSD network, the input image dimension was pixel RGB color images, whereas input pixels for the YOLOv3 network are pixel RGB color images. The sample dataset used for CNN training consisted of all the classes (low, intermediate, and high) as shown in Fig. 8.
In the present investigation, SSD and YOLOv3 networks that are optimized to train in mid-tier GPU are deployed for training and testing. The YOLOv3 is trained on a Darknet deep learning library84 for 10 000 steps, with a batch size of 32 and subdivisions of 8 for YOLO models, whereas the SSD network is implemented in Keras with Tensorflow as a back-end. Furthermore, the SSD network, being computationally heavy compared to YOLOv3, is trained for 70 epochs and at a batch size of 1 image per batch.
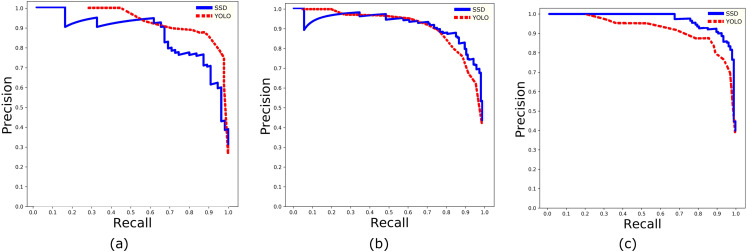
Two defining parameters to compare the performance of CNN networks are and . The is defined as the fraction of the number of true positive predictions to the total number of positive predictions, whereas is the ratio of the number of true positive predictions to a number of total predicted results. Precision-recall curves are drawn for both the networks according to different confidence thresholds ranging from 0 to 1 as shown in Fig. 10. The average precision is calculated based on the standard approach of 11 point recall values85 for each mixing class as in Table V. In addition, by estimating the mean of average precision of each class, a parameter (mean average precision) is calculated for SSD and YOLOv3 networks and is given in Table VI. Note that both the networks are employed with the same dataset for training and testing. From the precision-recall curves, it is evident that the SSD network provides a better compromise between precision and recall, whereas the YOLOv3 network surpasses SSD in the case of speed of detection as mentioned in Table VI. Furthermore, based on 11-recall points is better for SSD as compared to the YOLOv3 network. In comparison, real-time prediction can be done using the YOLOv3 network in mid-tier computers by sacrificing some amount of prediction accuracies; meanwhile, SSD networks can be deployed on high-end computers in such cases where detection accuracy cannot be compromised. To circumvent the data biasing, the fivefold cross-validation is employed during the training phase of both the networks and used early stopping when losses are minimum.
FIG. 10.
Precision-recall curves for (a) low-mixing, (b) intermediate-mixing, and (c) high-mixing classes evaluated on trained SSD and YOLOv3 models by using a combined testing and validation dataset.
TABLE V.
Average precision comparison of networks in classifying the degree of droplet mixing in three categories.
| Classes | Average precision (SSD) | Average precision (YOLOv3) |
|---|---|---|
| Low mixing | 0.853 | 0.827 |
| Intermediate mixing | 0.905 | 0.833 |
| High mixing | 0.933 | 0.828 |
TABLE VI.
Comparison between test results of SSD and YOLOv3 networks.
| Network | Input size | mAP | FPS |
|---|---|---|---|
| SSD | 300 × 300 | 0.897 | 7 |
| YOLOv3 | 416 × 416 | 0.8298 | 39 |
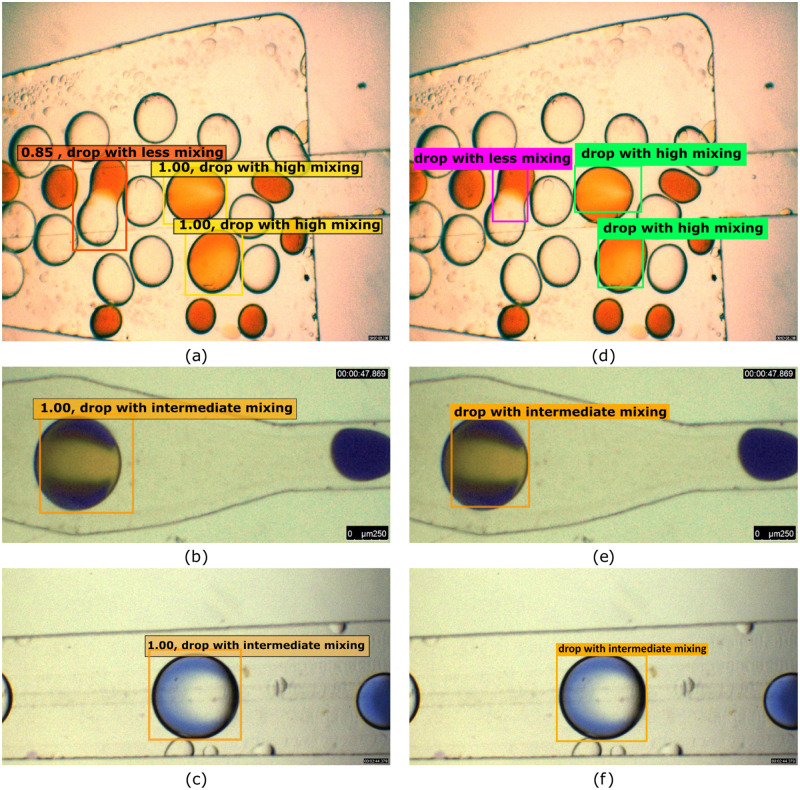
After training and validation, another mutually exclusive set of testing images is used to evaluate the performance of the networks. The testing data consist of images taken at different light exposures, reagent combinations, and mixing patterns. The performance of both networks for the same input images is compared in Fig. 11. It is observed that both the networks excel in a classification task; however, SSD seems to be better in terms of localization of the droplet with a bounding box that encloses the droplet. Both the models also avoided unmixed droplet images to be wrongly detected as perfectly homogenized droplets even though they have close resemblance in terms of color and uniformity. Nevertheless, the SSD network is efficient in the localization task, and the classification of the droplet seems to be difficult with some reagents and patterns as seen in Fig. 11(b). Precision and recall parameters that are used to evaluate network performance are compared for SSD and YOLOv3 networks in Table VI. It is evident that YOLOv3 provides better class prediction meantime, and the SSD network provides better bounding box prediction for a merging droplet dataset.
FIG. 11.
A comparison of droplet detection and classification by (a)–(c) the SSD network and (d)–(f) the YOLOV3 network.
In addition to the image input, the models are tested with a video input as well to check its validity in classifying binary-coalesced droplets in real time. It is demonstrated that both networks are able to localize the droplet and classify it irrespective of the droplet shape, color of reagents, size, and background. However, the YOLOv3 network can handle up to 39 frames per second (FPS), while SSD can do it for 7 FPS (see Table VI). Hence, for the purpose of classification from the video data input where the exact location of object is of less concern, the YOLOv3 network is preferred. It is evident from Figs. 11(a) and 11(d) that multiple droplet localization and classification can be executed simultaneously from a single frame efficiently. To reconfirm the applicability of the proposed networks, the classification of binary droplet fusion reported in the literature34,86 is performed (refer to Fig. S3 in the supplementary material). Even though the experimental conditions, reagents, and channel dimensions are entirely different and these images are not part of the current dataset, the classification is carried out by both the networks with good precision. Most importantly, this microfluidic configuration and deep neural network framework can easily be extended to a much more complicated analysis such as detection of biological cells, DNA, exosomes, etc., encapsulated in droplets in a real-time manner. In particular, bio-analytical applications such as detection of targeted cells, microfluidic nucleic acid amplification, microfluidic pathogen incubation, etc.,15,62,87–89 which involves target specific dyes/primers also can adopt this AI strategy after generating a corresponding dataset.
IV. SUMMARY
In this work, detection and classification of binary-coalesced droplets inside microchannels based on the degree of mixing using a deep neural network is performed. Different microchannel configurations are fabricated on the PMMA material using micro-milling techniques in conjunction with thermal bonding. Monodispersed droplets are generated using flow-focusing and cross-flow microchannel geometries, and the droplets are allowed to coalesce passively. Owing to the complex internal flow dynamics, volume ratio, different dye combinations, etc., various mixing patterns have been visualized from the commencement of coalescence to the end of homogenization. A large image dataset of binary droplets is generated with distinct features. The microdroplet detection and classification based on the extent of mixing is carried out using the pattern recognition capability of deep neural networks. Real-time object detection models, SSD and YOLOv3, are deployed in this examination. The trained CNN models are able to detect merged droplets at different stages and classify based on pattern recognition irrespective of experimental conditions such as fluid color, dye properties, volume ratio, lighting, and so on. The real-time monitoring of mixing efficiency is carried out with a mid-tier GPU equipped computer and achieved 39 FPS speed of frame processing with the YOLOv3 network, which is fast enough to implement on real-time applications. The current droplet microfluidic platform in conjunction with the AI framework can be explored in future for a bio-macromolecule analysis and developing diagnostic systems by modifying the training dataset and neural network architecture.
SUPPLEMENTARY MATERIAL
The supplementary material involving relevant supporting figures is available for the reader’s reference.
ACKNOWLEDGMENTS
The authors would like to acknowledge the All India Council for Technical Education (AICTE), Government of India for providing funding under the RPS scheme [No. 8-49/RIFD/RPS(Policy-1)/2016-17] to execute this project. The authors also acknowledge the funding obtained under the FIST-DST scheme (No. SR/FST/384). The authors sincerely thank Professor Linu Shine, Computer Vision Lab for fruitful discussions on deep learning techniques.
DATA AVAILABILITY
The data that support the findings of this study are available from the corresponding author upon reasonable request.
REFERENCES
- 1.Rosenfeld L., Lin T., Derda R., and Tang S. K., Microfluid. Nanofluidics 16, 921 (2014). 10.1007/s10404-013-1310-x [DOI] [Google Scholar]
- 2.Shang L., Cheng Y., and Zhao Y., Chem. Rev. 117, 7964 (2017). 10.1021/acs.chemrev.6b00848 [DOI] [PubMed] [Google Scholar]
- 3.Suea-Ngam A., Howes P. D., Srisa-Art M., and DeMello A. J., Chem. Commun. 55, 9895 (2019). 10.1039/C9CC04750F [DOI] [PubMed] [Google Scholar]
- 4.Sun X., Tang K., Smith R. D., and Kelly R. T., Microfluid. Nanofluidics 15, 117 (2013). 10.1007/s10404-012-1133-1 [DOI] [PMC free article] [PubMed] [Google Scholar]
- 5.Thorsen T., Roberts R. W., Arnold F. H., and Quake S. R., Phys. Rev. Lett. 86, 4163 (2001). 10.1103/PhysRevLett.86.4163 [DOI] [PubMed] [Google Scholar]
- 6.Teh S.-Y., Lin R., Hung L.-H., and Lee A. P., Lab Chip 8, 198 (2008). 10.1039/b715524g [DOI] [PubMed] [Google Scholar]
- 7.Chou W.-L., Lee P.-Y., Yang C.-L., Huang W.-Y., and Lin Y.-S., Micromachines 6, 1249 (2015). 10.3390/mi6091249 [DOI] [Google Scholar]
- 8.Song H., Chen D. L., and Ismagilov R. F., Angew. Chem. Int. Ed. 45, 7336 (2006). 10.1002/anie.200601554 [DOI] [PMC free article] [PubMed] [Google Scholar]
- 9.Roman G. T., Chen Y., Viberg P., Culbertson A. H., and Culbertson C. T., Anal. Bioanal. Chem. 387, 9 (2007). 10.1007/s00216-006-0670-4 [DOI] [PubMed] [Google Scholar]
- 10.Liu K., Ding H., Chen Y., and Zhao X.-Z., Microfluid. Nanofluidics 3, 239 (2007). 10.1007/s10404-006-0121-8 [DOI] [Google Scholar]
- 11.Gu H., Duits M. H., and Mugele F., Int. J. Mol. Sci. 12, 2572 (2011). 10.3390/ijms12042572 [DOI] [PMC free article] [PubMed] [Google Scholar]
- 12.Solvas X. C. I. and DeMello A., Chem. Commun. 47, 1936 (2011). 10.1039/C0CC02474K [DOI] [PubMed] [Google Scholar]
- 13.Liu W.-W. and Zhu Y., Anal. Chim. Acta 1113, 66–84 (2020). 10.1016/j.aca.2020.03.011 [DOI] [PubMed] [Google Scholar]
- 14.Zeng S., Liu X., Xie H., and Lin B., in Microfluidics (Springer, 2011), pp. 69–90. [DOI] [PubMed]
- 15.Zhu Y. and Fang Q., Anal. Chim. Acta 787, 24 (2013). 10.1016/j.aca.2013.04.064 [DOI] [PubMed] [Google Scholar]
- 16.Zhu P. and Wang L., Lab Chip 17, 34 (2017). 10.1039/C6LC01018K [DOI] [PubMed] [Google Scholar]
- 17.Wang W., Yang C., and Li C. M., Lab Chip 9, 1504 (2009). 10.1039/b903468d [DOI] [PubMed] [Google Scholar]
- 18.Duncombe T. A. and Dittrich P. S., Curr. Opin. Biotechnol. 60, 205 (2019). 10.1016/j.copbio.2019.05.004 [DOI] [PubMed] [Google Scholar]
- 19.Garstecki P., Fuerstman M. J., Stone H. A., and Whitesides G. M., Lab Chip 6, 437 (2006). 10.1039/b510841a [DOI] [PubMed] [Google Scholar]
- 20.Anna S. L., Bontoux N., and Stone H. A., Appl. Phys. Lett. 82, 364 (2003). 10.1063/1.1537519 [DOI] [Google Scholar]
- 21.Garstecki P., Stone H. A., and Whitesides G. M., Phys. Rev. Lett. 94, 164501 (2005). 10.1103/PhysRevLett.94.164501 [DOI] [PubMed] [Google Scholar]
- 22.Doufène K., Tourné-Péteilh C., Etienne P., and Aubert-Pouëssel A., Langmuir 35, 12597 (2019). 10.1021/acs.langmuir.9b02179 [DOI] [PubMed] [Google Scholar]
- 23.Baroud C. N., Gallaire F., and Dangla R., Lab Chip 10, 2032 (2010). 10.1039/c001191f [DOI] [PubMed] [Google Scholar]
- 24.De Menech M., Garstecki P., Jousse F., and Stone H., J. Fluid Mech. 595, 141 (2008). 10.1017/S002211200700910X [DOI] [Google Scholar]
- 25.Wehking J. D., Gabany M., Chew L., and Kumar R., Microfluid. Nanofluidics 16, 441 (2014). 10.1007/s10404-013-1239-0 [DOI] [Google Scholar]
- 26.Hong Y. and Wang F., Microfluid. Nanofluidics 3, 341 (2007). 10.1007/s10404-006-0134-3 [DOI] [Google Scholar]
- 27.Nguyen N.-T., Micromixers: Fundamentals, Design and Fabrication (William Andrew, 2011). [Google Scholar]
- 28.Surya H. P. N., Parayil S., Banerjee U., Chander S., and Sen A. K., Biochip J. 9, 16 (2015). 10.1007/s13206-014-9103-1 [DOI] [Google Scholar]
- 29.Zheng B., Tice J. D., and Ismagilov R. F., Adv. Mater. 16, 1365 (2004). 10.1002/adma.200400590 [DOI] [PMC free article] [PubMed] [Google Scholar]
- 30.Hess D., Yang T., and Stavrakis S., Anal. Bioanal. Chem. 412, 3265–3283 (2020). 10.1007/s00216-019-02294-z [DOI] [PubMed] [Google Scholar]
- 31.Liu C., Li Y., and Liu B.-F., Talanta 205, 120136 (2019). 10.1016/j.talanta.2019.120136 [DOI] [PubMed] [Google Scholar]
- 32.Sivasamy J., Chim Y. C., Wong T.-N., Nguyen N.-T., and Yobas L., Microfluid. Nanofluidics 8, 409 (2010). 10.1007/s10404-009-0531-5 [DOI] [Google Scholar]
- 33.Bremond N., Thiam A. R., and Bibette J., Phys. Rev. Lett. 100, 024501 (2008). 10.1103/PhysRevLett.100.024501 [DOI] [PubMed] [Google Scholar]
- 34.Niu X., Gulati S., Edel J. B., and deMello A. J., Lab Chip 8, 1837 (2008). 10.1039/b813325e [DOI] [PubMed] [Google Scholar]
- 35.Tan Y.-C., Ho Y. L., and Lee A. P., Microfluid. Nanofluidics 3, 495 (2007). 10.1007/s10404-006-0136-1 [DOI] [Google Scholar]
- 36.Song H., Bringer M. R., Tice J. D., Gerdts C. J., and Ismagilov R. F., Appl. Phys. Lett. 83, 4664 (2003). 10.1063/1.1630378 [DOI] [PMC free article] [PubMed] [Google Scholar]
- 37.Gach P. C., Iwai K., Kim P. W., Hillson N. J., and Singh A. K., Lab Chip 17, 3388 (2017). 10.1039/C7LC00576H [DOI] [PubMed] [Google Scholar]
- 38.Mashaghi S., Abbaspourrad A., Weitz D. A., and van Oijen A. M., TrAC Trends Anal. Chem. 82, 118 (2016). 10.1016/j.trac.2016.05.019 [DOI] [Google Scholar]
- 39.Song H., Tice J. D., and Ismagilov R. F., Angew. Chem. Int. Ed. 42, 768 (2003). 10.1002/anie.200390203 [DOI] [PubMed] [Google Scholar]
- 40.Jin B.-J. and Yoo J. Y., Exp. Fluids 52, 235 (2012). 10.1007/s00348-011-1221-0 [DOI] [Google Scholar]
- 41.Mazutis L. and Griffiths A. D., Lab Chip 12, 1800 (2012). 10.1039/c2lc40121e [DOI] [PubMed] [Google Scholar]
- 42.Deng N.-N., Sun S.-X., Wang W., Ju X.-J., Xie R., and Chu L.-Y., Lab Chip 13, 3653 (2013). 10.1039/c3lc50533b [DOI] [PubMed] [Google Scholar]
- 43.Brouzes E., Medkova M., Savenelli N., Marran D., Twardowski M., Hutchison J. B., Rothberg J. M., Link D. R., Perrimon N., and Samuels M. L., Proc. Natl. Acad. Sci. U.S.A. 106, 14195 (2009). 10.1073/pnas.0903542106 [DOI] [PMC free article] [PubMed] [Google Scholar]
- 44.Meng Q.-F., Rao L., Cai B., You S.-J., Guo S.-S., Liu W., and Zhao X.-Z., Micromachines 6, 915 (2015). 10.3390/mi6070915 [DOI] [Google Scholar]
- 45.Gerdts C. J., Sharoyan D. E., and Ismagilov R. F., J. Am. Chem. Soc. 126, 6327 (2004). 10.1021/ja031689l [DOI] [PubMed] [Google Scholar]
- 46.Akartuna I., Aubrecht D. M., Kodger T. E., and Weitz D. A., Lab Chip 15, 1140 (2015). 10.1039/C4LC01285B [DOI] [PubMed] [Google Scholar]
- 47.Nightingale A. M., Phillips T. W., Bannock J. H., and De Mello J. C., Nat. Commun. 5, 3777 (2014). 10.1038/ncomms4777 [DOI] [PMC free article] [PubMed] [Google Scholar]
- 48.Jin S. H., Jeong H.-H., Lee B., Lee S. S., and Lee C.-S., Lab Chip 15, 3677 (2015). 10.1039/C5LC00651A [DOI] [PubMed] [Google Scholar]
- 49.Korczyk P. M., Derzsi L., Jakieła S., and Garstecki P., Lab Chip 13, 4096 (2013). 10.1039/c3lc50347j [DOI] [PubMed] [Google Scholar]
- 50.Kamperman T., Trikalitis V. D., Karperien M., Visser C. W., and Leijten J., ACS Appl. Mater. Interfaces 10, 23433 (2018). 10.1021/acsami.8b05227 [DOI] [PMC free article] [PubMed] [Google Scholar]
- 51.Luo X., Yin H., Ren J., Yan H., Huang X., Yang D., and He L., J. Colloid Interface Sci. 545, 35 (2019). 10.1016/j.jcis.2019.03.016 [DOI] [PubMed] [Google Scholar]
- 52.Ngo I.-L., Woo Joo S., and Byon C., J. Fluids Eng. 138, 052102 (2016). 10.1115/1.4031881 [DOI] [Google Scholar]
- 53.Iqbal S., Bashir S., Ahsan M., Bashir M., and Shoukat S., J. Fluids Eng. 142, 041404 (2020). 10.1115/1.4045366 [DOI] [Google Scholar]
- 54.Feng S., Yi L., Zhao-Miao L., Ren-Tuo C., and Gui-Ren W., Chin. J. Anal. Chem. 43, 1942 (2015). 10.1016/S1872-2040(15)60834-9 [DOI] [Google Scholar]
- 55.Jin B., Kim Y., Lee Y., and Yoo J., J. Micromech. Microeng. 20, 035003 (2010). 10.1088/0960-1317/20/3/035003 [DOI] [Google Scholar]
- 56.Sarrazin F., Prat L., Miceli N. D., Cristobal G., Link D., and Weitz D., Chem. Eng. Sci. 62, 1042 (2007). 10.1016/j.ces.2006.10.013 [DOI] [Google Scholar]
- 57.Carroll B. and Hidrovo C., Exp. Fluids 53, 1301 (2012). 10.1007/s00348-012-1361-x [DOI] [Google Scholar]
- 58.Hashmi A. and Xu J., J. Lab. Autom. 19, 488 (2014). 10.1177/2211068214540156 [DOI] [PubMed] [Google Scholar]
- 59.Girault M., Kim H., Arakawa H., Matsuura K., Odaka M., Hattori A., Terazono H., and Yasuda K., Sci. Rep. 7, 40072 (2017). 10.1038/srep40072 [DOI] [PMC free article] [PubMed] [Google Scholar]
- 60.Zang E., Brandes S., Tovar M., Martin K., Mech F., Horbert P., Henkel T., Figge M. T., and Roth M., Lab Chip 13, 3707 (2013). 10.1039/c3lc50572c [DOI] [PubMed] [Google Scholar]
- 61.Niu X., Zhang M., Peng S., Wen W., and Sheng P., Biomicrofluidics 1, 044101 (2007). 10.1063/1.2795392 [DOI] [PMC free article] [PubMed] [Google Scholar]
- 62.Li Z., Zhao J., Wu X., Zhu C., Liu Y., Wang A., Deng G., and Zhu L., Biotechnol. Biotechnol. Equip. 33, 223 (2019). 10.1080/13102818.2018.1561211 [DOI] [Google Scholar]
- 63.Anagnostidis V., Sherlock B., Metz J., Mair P., Hollfelder F., and Gielen F., Lab Chip 20, 889 (2020). 10.1039/D0LC00055H [DOI] [PubMed] [Google Scholar]
- 64.Riordon J., Sovilj D., Sanner S., Sinton D., and Young E. W., Trends Biotechnol. 37, 310 (2019). 10.1016/j.tibtech.2018.08.005 [DOI] [PubMed] [Google Scholar]
- 65.Liu J., Pan Y., Li M., Chen Z., Tang L., Lu C., and Wang J., Big Data Mining Anal. 1, 1 (2018). 10.26599/BDMA.2018.9020001 [DOI] [Google Scholar]
- 66.Cha Y.-J., Choi W., and Büyüköztürk O., Comput.-Aided Civil Infrastruct. Eng. 32, 361 (2017). 10.1111/mice.12263 [DOI] [Google Scholar]
- 67.Greenspan H., van Ginneken B., and Summers R. M., IEEE Trans. Med. Imaging 35, 1153 (2016). 10.1109/TMI.2016.2553401 [DOI] [Google Scholar]
- 68.Yi J., Wu P., Hoeppner D. J., and Metaxas D., in Proceedings of the IEEE Conference on Computer Vision and Pattern Recognition Workshops (IEEE, 2017), pp. 108–112.
- 69.Shine L. and Jiji C., Multimed. Tools Appl. 79, 1 (2020). 10.1007/s11042-019-7523-6 [DOI] [Google Scholar]
- 70.Lee S. J., Yoon G. Y., and Go T., Exp. Fluids 60, 170 (2019). 10.1007/s00348-019-2818-y [DOI] [Google Scholar]
- 71.Poletaev I., Tokarev M. P., and Pervunin K. S., Int. J. Multiphase Flow 126, 103194 (2019). 10.1016/j.ijmultiphaseflow.2019.103194 [DOI] [Google Scholar]
- 72.Hadikhani P., Borhani N., Hashemi S. M. H., and Psaltis D., Sci. Rep. 9, 8114 (2019). 10.1038/s41598-019-44556-x [DOI] [PMC free article] [PubMed] [Google Scholar]
- 73.Redmon J., Divvala S., Girshick R., and Farhadi A., in Proceedings of the IEEE Conference on Computer Vision and Pattern Recognition (IEEE, 2016), pp. 779–788.
- 74.Redmon J. and Farhadi A., in Proceedings of the IEEE Conference on Computer Vision and Pattern Recognition (IEEE, 2017), pp. 7263–7271.
- 75.Redmon J. and Farhadi A., “YOLOv3: An incremental improvement,” arXiv:1804.02767 (2018).
- 76.Liu W., Anguelov D., Erhan D., Szegedy C., Reed S., Fu C.-Y., and Berg A. C., in European Conference on Computer Vision (Springer, 2016), pp. 21–37.
- 77.Chu A., Nguyen D., Talathi S. S., Wilson A. C., Ye C., Smith W. L., Kaplan A. D., Duoss E. B., Stolaroff J. K., and Giera B., Lab Chip 19, 1808 (2019). 10.1039/C8LC01394B [DOI] [PubMed] [Google Scholar]
- 78.Becker H. and Locascio L. E., Talanta 56, 267 (2002). 10.1016/S0039-9140(01)00594-X [DOI] [PubMed] [Google Scholar]
- 79.Zhu X., Liu G., Guo Y., and Tian Y., Microsyst. Technol. 13, 403 (2007). 10.1007/s00542-006-0224-x [DOI] [Google Scholar]
- 80.Ding Y., Choo J., and Demello A. J., Microfluid. Nanofluidics 21, 58 (2017). 10.1007/s10404-017-1889-4 [DOI] [PMC free article] [PubMed] [Google Scholar]
- 81.Calabrese R. V., Wang C. Y., and Bryner N. P., AIChE J. 32, 677 (1986). 10.1002/aic.690320418 [DOI] [Google Scholar]
- 82.Bastian B. T., Jaspreeth N., Ranjith S. K., and Jiji C., NDT E Int. 107, 102134 (2019). 10.1016/j.ndteint.2019.102134 [DOI] [Google Scholar]
- 83.Hung L.-H., Choi K. M., Tseng W.-Y., Tan Y.-C., Shea K. J., and Lee A. P., Lab Chip 6, 174 (2006). 10.1039/b513908b [DOI] [PubMed] [Google Scholar]
- 84.Redmon J., see http://pjreddie.com/darknet/ for “Darknet: Open Source Neural Networks in C” (2013–2016).
- 85.Zhang E. and Zhang Y., Encyclopedia of Database Systems (Springer, 2009), p. 981.
- 86.Tice J. D., Song H., Lyon A. D., and Ismagilov R. F., Langmuir 19, 9127 (2003). 10.1021/la030090w [DOI] [Google Scholar]
- 87.Kang D.-K., Ali M. M., Zhang K., Pone E. J., and Zhao W., TrAC Trends Anal. Chem. 58, 145 (2014). 10.1016/j.trac.2014.03.006 [DOI] [Google Scholar]
- 88.Wang J. and Lin J.-M., in Cell Analysis on Microfluidics (Springer, 2018), pp. 225–262.
- 89.Kaushik A. M., Hsieh K., Chen L., Shin D. J., Liao J. C., and Wang T.-H., Biosens. Bioelectron. 97, 260 (2017). 10.1016/j.bios.2017.06.006 [DOI] [PMC free article] [PubMed] [Google Scholar]
Associated Data
This section collects any data citations, data availability statements, or supplementary materials included in this article.
Supplementary Materials
The supplementary material involving relevant supporting figures is available for the reader’s reference.
Data Availability Statement
The data that support the findings of this study are available from the corresponding author upon reasonable request.


