Abstract
Objective
We studied the potential of quantitative MRI (qMRI) as a surrogate endpoint in Duchenne muscular dystrophy by assessing the additive predictive value of vastus lateralis (VL) fat fraction (FF) to age on loss of ambulation (LoA).
Methods
VL FFs were determined on longitudinal Dixon MRI scans from 2 natural history studies in Leiden University Medical Center (LUMC) and Cincinnati Children's Hospital Medical Center (CCHMC). CCHMC included ambulant patients, while LUMC included a mixed ambulant and nonambulant population. We fitted longitudinal VL FF values to a sigmoidal curve using a mixed model with random slope to predict individual trajectories. The additive value of VL FF over age to predict LoA was calculated from a Cox model, yielding a hazard ratio.
Results
Eighty-nine MRIs of 19 LUMC and 15 CCHMC patients were included. At similar age, 6-minute walking test distances were smaller and VL FFs were correspondingly higher in LUMC compared to CCHMC patients. Hazard ratio of a percent-point increase in VL FF for the time to LoA was 1.15 for LUMC (95% confidence interval [CI] 1.05–1.26; p = 0.003) and 0.96 for CCHMC (95% CI 0.84–1.10; p = 0.569).
Conclusions
The hazard ratio of 1.15 corresponds to a 4.11-fold increase of the instantaneous risk of LoA in patients with a 10% higher VL FF at any age. Although results should be confirmed in a larger cohort with prospective determination of the clinical endpoint, this added predictive value of VL FF to age on LoA supports the use of qMRI FF as an endpoint or stratification tool in clinical trials.
Duchenne muscular dystrophy (DMD) is characterized by progressive replacement of muscle tissue with fat and fibrosis due to the absence of full-length dystrophin.1 Although the first drugs have now received regulatory approval, there is still a medical need, with many ongoing and planned clinical trials.2 Such trials are challenging in the pediatric population because of the rarity of the disease, a different rate of progression in different patients, and clinical endpoints that can be influenced by patient motivation.3 Objectively quantified and predictive surrogate endpoints could overcome these limitations, but only if a clear interdependence between the outcome measure and clinically meaningful milestones is demonstrated.
Both scientists and regulatory agencies consider muscle fat fraction (FF), measured by quantitative MRI (qMRI) or magnetic resonance spectroscopy, as a potential surrogate endpoint in trials.4–7 qMRI of the lower extremity can noninvasively, objectively, and accurately assess muscle FF in DMD and is reproducible.8–12 Longitudinal DMD studies demonstrated a sigmoidal increase in FF in leg muscles.13,14 The FF of the vastus lateralis (VL) muscle has been shown to have a large effect size in detecting 1-year change compared to other leg muscles.8
Cross-sectional correlations between strength, function, and muscle FF have been described.4,5,9,15–20 However, because FF increases with age, it will always correlate with the declining functional parameters in DMD. Therefore, a simple correlation alone will not suffice. In this study, we show that VL FF has additive predictive value to age on loss of ambulation (LoA).
Methods
Participants and study design
Patients with DMD participated in natural history studies at Leiden University Medical Center (LUMC), the Netherlands, or at Cincinnati Children's Hospital Medical Center (CCHMC), Ohio. The LUMC patients were recruited from the Dutch Dystrophinopathy Database.21 Selected MRI results of this study have been previously reported.13,22,23 The CCHMC participants were recruited from the international Prospective Natural History Study of Progression of Subjects With Duchenne Muscular Dystrophy (PRO-DMD-01) that started in 2012. For this work, LUMC, CCHMC, and the Institute of Myology collaborated as part of the BIOIMAGE-Neuromuscular Diseases (BIOIMAGE-NMD) consortium (project identifier 602485, funded under FP7-HEALTH). Inclusion criteria at both LUMC and CCHMC were a confirmed genetic mutation in the DMD gene and being ≥5 years of age. In addition, at CCHMC, patients had to have a mutation that would be amenable to skipping of exon 44, 45, 51, 52, 53, and 55 and had to be able to walk at least 75 m unassisted in the 6-minute walking test (6MWT); these constraints were not applied in the selection of LUMC patients. Main exclusion criteria at both LUMC and CCHMC were the presence of contraindications for MRI and participation in a clinical study with an investigational medicinal product. MRI examinations took place at LUMC at baseline and 12, 24, and 30 months between August 2013 and December 2016; at CCHMC, examinations took place at baseline and 6, 12, and 18 months between January 2015 and August 2016.
Standard protocol approvals, registrations, and patient consents
The local ethics committee at each site approved the study conducted at that site. Written informed consent was obtained from patients and parents. The PRO-DMD-01 natural history study was registered under the following clinical trial identifier number: NCT01753804.
Determination of clinical endpoint and cohort characteristics
We defined LoA as the patient being unable to walk 5 m without assistance or orthoses. If LoA was established during ongoing yearly follow-up, we used the month and year of LoA registered in clinical documentation. In addition, if there was recent clinical documentation that the patient was still ambulant, we used the date of that documentation as the last follow-up. When it was unknown whether patients were still ambulant or the exact month and year of LoA had not been registered, detailed interviews with patients and parents were conducted by telephone between July 2017 and July 2018. For those still ambulant patients, we defined the last interview date as the last follow-up. History of corticosteroid use was also established from clinical documentation or assessed during this interview. 6MWT data were derived from the natural history study visits. For LUMC patients, data from outpatient visits before and after the natural history study were added.
MRI acquisition
At both sites, the position of the patients was feet first supine. A 16-channel anterior array receive coil was used in combination with a 12-channel array receive coil that was located within the table. FFs were determined from 3-point gradient echo Dixon images of the thigh. At the LUMC, images of the right thigh were acquired on a 3T MRI scanner (Ingenia, Philips Healthcare, Best, the Netherlands), as described previously.23 Dixon scans were acquired with 23 slices, a voxel size of 1 × 1 × 10 mm, and an interslice gap of 5 mm (repetition time [TR]/echo time [TE]/echo time shift [ΔTE] 210/4.41/0.76 milliseconds, flip angle 8°). At CCHMC, images of both thighs were acquired on a 1.5T MRI scanner (Ingenia). Scans consisted of 35 partially overlapping slices with a voxel size of 1 × 1 × 10 mm (TR/TE/ΔTE 11.25/2.4/2.3 milliseconds, flip angle 3°). At both sites, sedation was not necessary, and while the entire scan protocol, including other scan types and lower leg scans, took up to 1 hour, we could acquire the Dixon scan within 10 minutes, including planning and positioning.
MRI analysis
Data were reconstructed with the manufacturer’s software assuming a single peak in the lipid spectrum and without T2* relaxation correction. Recent studies have shown differences in fat replacement along the proximodistal axis of the muscle in DMD,23,24 which necessitated precise definition of the region of interest (ROI) along this axis for comparison of MRI data from both sites. Two observers from LUMC (K.J.N.) and the Institute of Myology (H.R.) determined in consensus the most proximal slice where the biceps femoris short head was still visible.17 This slice was defined as the center slice around which multiple slices covering 70 mm of the VL muscle were analyzed. The observers also determined in consensus which scans had to be excluded because of major movement artifacts, water/fat swaps, or other artifacts in the VL. The observers then independently drew ROIs of the VL muscle using Medical Image Processing, Analysis and Visualization software (mipav.cit.nih.gov). ROIs were drawn on 5 consecutive slices for LUMC and on every second slice for CCMHC for a total of 7 slices around the center slice. The boundaries of the ROIs were drawn exactly on the muscle border. Next, we performed an inward erosion of 2 mm for every ROI to avoid contamination of ROIs with subcutaneous fat and fatty intermuscular septa (figure 1). FF values were calculated per slice as signal intensity (SI) fat/(SI fat + SI water) × 100 from the reconstructed fat and water images. VL FFs were calculated as a weighted mean value based on the number of VL pixels per slice. To correct for differences in TR and flip angle, FF values were corrected for field strength–specific T1 partial saturation effects using literature values for muscle and fat tissue.25
Figure 1. VL ROI.
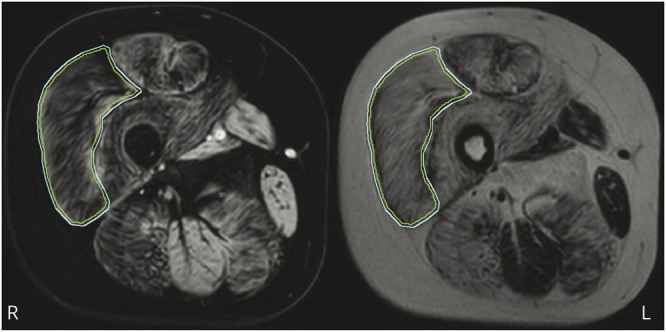
Example of a region of interest (ROI) drawn on the vastus lateralis (VL) (outer line) and the 2-mm inward erosion (inner line) on a water image (left) and corresponding fat image (right).
Statistical analysis
We assessed agreement between VL FFs from the 2 observers using an intraclass correlation coefficient (ICC) with a 2-way random model and absolute agreement.26 Bland-Altman analysis was also performed to determine bias and limits of agreement between both observers. We modeled the VL FFs, calculated the hazard ratios, did a Spearman correlation, and generated the growth charts for the 2 cohorts separately because of the differences in inclusion criteria.
As a percentage, VL FF is bound between values of 0 and 100. Bounded outcomes often have nonstandard probability distributions that make their statistical analysis complex. However, when we apply the logit transformation to FF, the range of the new variable (Y) becomes unbounded, and we can use standard statistical methods that rely on the normal (gaussian) distribution:
 |
To account for the correlation between the longitudinal FF measurements for each patient, we fitted a linear (mixed) model to our outcome Y with age as the only covariate and a random slope per individual. After transformation back to the original scale by application of a logistic transformation, VL FFs of all patients at any time had been predicted.
To calculate the additive predictive value of VL FF to age on LoA, we fitted a Cox proportional hazards model with predicted VL FF as a time-varying covariate. This model defines time intervals for the entire follow-up on the basis of the ages at which an event occurs, that is, either LoA or the end of follow-up. Per time interval, it links the predicted VL FF to the ambulant status at the end of that interval for each patient. An advantage of this method is that LoA events that took place before the first MRI had been acquired (i.e., in patients who were nonambulant at baseline) and all patients with ≥1 VL FF data points can be included in the analysis. The hazard ratio from the model is then calculated as follows:
For this, a value of p < 0.05 tested with the Wald test was considered significant. Next, the increase in instantaneous risk of LoA caused by the number of percent-points increase in VL FF (ΔFF) can be calculated as follows:
We performed Spearman correlation analysis to assess the relationship between age at LoA and the nonnormally distributed individual slope of the predicted VL FF curve. On the basis of the predicted VL FF curves with a normally divided set of slopes, we generated a growth chart with differing slopes for patients at different percentiles of the disease spectrum. Using the hazard ratio, we transformed the predicted VL FF growth curves to survival curves for preserved ambulation, in which, for example, a patient on the third percentile in the VL FF growth chart is also on the third percentile in the survival chart.
Data availability
Anonymized data can be made available to qualified investigators on request.
Results
Data inclusion and cohort characteristics
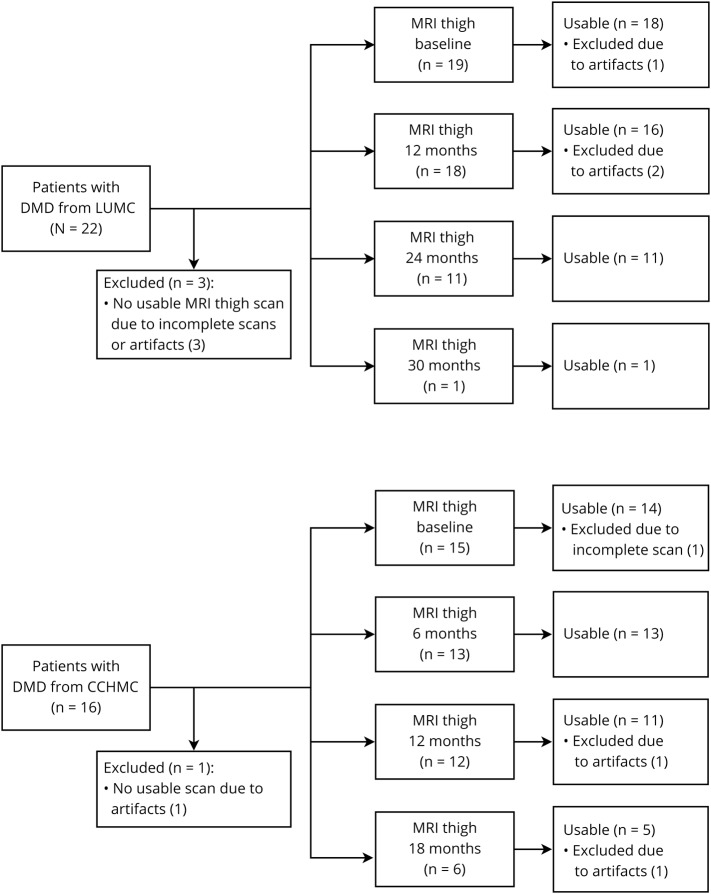
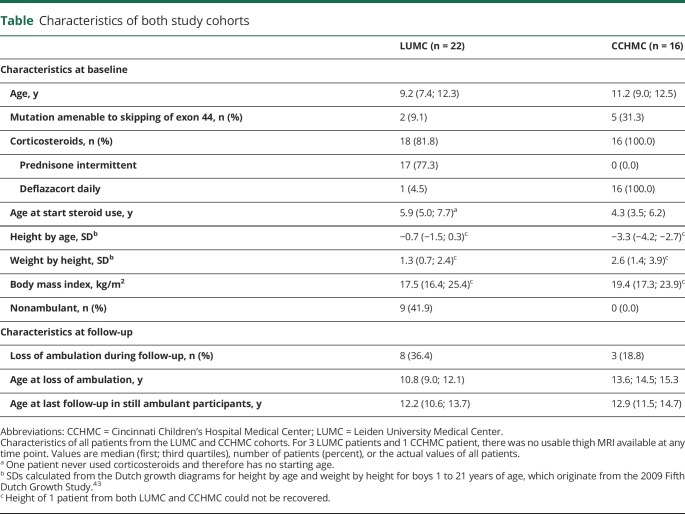
Twenty-two patients from LUMC and 16 from CCHMC participated in both natural history studies. For 3 patients from LUMC and 1 from CCHMC, no useable thigh MRI scan was available at any time point due to either an inability to complete the scan or movement artifacts. This led to the availability of 46 useable MRIs and therefore VL FF data points from 1 to 4 time points of 19 LUMC patients and 43 data points from 1 to 4 time points of 15 CCHMC patients. Figure 2 shows flowcharts of MRI data inclusion, and the table presents characteristics for the LUMC and CCHMC cohorts. On average LUMC patients were younger and taller and had lower body mass index values than CCHMC patients. LUMC patients mostly used prednisone in an intermittent schedule and from a later age than CCHMC patients, who all used daily deflazacort. Furthermore, CCHMC patients were more often eligible for skipping of exon 44. Seven participants from LUMC with available VL FF data were nonambulant at baseline, while all participants from CCHMC were ambulant as a result of the inclusion criteria for that study. During follow-up, LoA occurred in 10 patients with available VL FF data, 7 from LUMC and 3 from CCHMC. On average, LUMC patients lost ambulation at a younger age.
Figure 2. Flowchart of included thigh MRI datasets.
Inclusion of patients with Duchenne muscular dystrophy (DMD) and thigh MRI scan data at Leiden University Medical Center (LUMC) and Cincinnati Children's Hospital Medical Center (CCHMC). Forty-six useable MRIs from 1 to 4 time points were available for 19 LUMC patients, and 43 useable MRIs from again 1 to 4 time points were available for 15 CCHMC patients.
Table.
Characteristics of both study cohorts
Reliability of MRI parameters
The interobserver reliability for VL FF was excellent, with an ICC of 1.0 (95% confidence interval [CI] 1.0–1.0). Using the Bland Altman analysis, we found a mean bias of 0.1% in VL FF with limits of agreement of −0.9% to 1.2%.
Visual relation between ambulation and VL FF
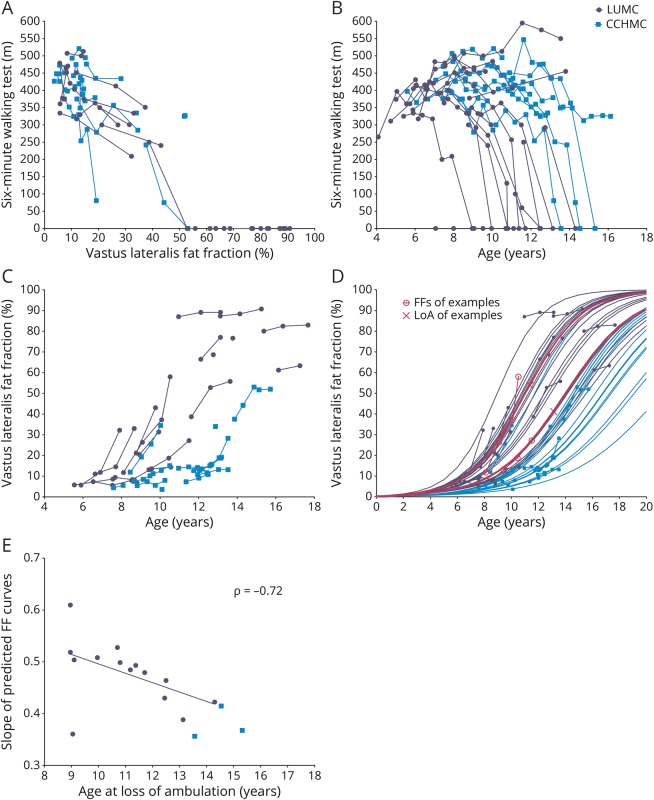
The relation between the absolute 6MWT distances and VL FF was similar in both cohorts (figure 3A). However, CCHMC patients walked longer distances at a later age than LUMC patients although with considerable interindividual variation in the 6MWTs (figure 3B). In parallel, VL FFs were higher and increased faster over time in LUMC patients compared to CCHMC patients, and VL FFs from patients from both centers corresponded visually to the sigmoid curves described previously (figure 3C).13,14
Figure 3. Longitudinal 6MWT and VL FF data.
Longitudinal data of patients with Duchenne muscular dystrophy (DMD) from Leiden University Medical Center (LUMC) (dark circles) and Cincinnati Children's Hospital Medical Center (CCHMC) (lighter squares). (A) 6-Minute walking test (6MWT) results plotted vs vastus lateralis (VL) fat fraction (FF). LUMC and CCHMC patients with similar 6MWT results have similar VL FFs. FFs from nonambulant patients are plotted as 0 m on the 6MWT. (B) 6MWT data plotted vs age. CCHMC patients on average walk longer distances at later ages than LUMC patients. Age at loss of ambulation (LoA) is plotted as 0 m. (C) Original VL FF results plotted vs age. On average VL FF results were higher and increased faster over time in LUMC patients compared to CCHMC patients. Data visually correspond to a sigmoid curve. (D) Original and predicted VL FF results plotted vs age. Patients with higher VL FFs at younger ages or faster FF increases had steeper predicted FF slopes. On average, LUMC patients showed steeper slopes than patients from CCHMC. Logistic curves from 2 LUMC patients at comparable ages are highlighted (pink lines) to illustrate the relationship with their LoA, depicted as an X, at 11.4 and 13.1 years of age. (E) Individual slope of the predicted FF curves plotted vs age at LoA. With the use of a Spearman correlation analysis on the LUMC cohort, there was a negative correlation between these variables (ρ = −0.72, p = 0.001).
Quantitative relation between ambulation and VL FF
Figure 3D shows original and predicted VL FF data. On average, LUMC patients showed steeper slopes for increasing FF than patients from CCHMC. The hazard ratio of a percent-point increase in VL FF for the time to LoA was 1.15 (log hazard ratio 0.14, 95% CI 1.05–1.26, Wald test p = 0.003) in the LUMC dataset, and 0.96 (log hazard ratio −0.04, 95% CI 0.84–1.10, Wald test p = 0.569) in the CCHMC dataset. The hazard ratio in the LUMC cohort of 1.15 corresponds to a 4.11-fold increase of the instantaneous risk of LoA in patients with a 10% higher VL FF at any age. Because of the limited number of events in the CCHMC cohort, we could assess the Spearman rank correlation and the survival chart only in the LUMC cohort. In LUMC patients, FF increased more rapidly (i.e., steeper slope) in those who lost ambulation at an earlier age (ρ = −0.72, p = 0.001, figure 3E). The LUMC VL FF growth chart (figure 4A) and survival chart (figure 4B) illustrate how the different VL FF curves relate to a range of LoA trajectories.
Figure 4. VL FF growth chart and survival chart of preserved ambulation for the LUMC cohort.
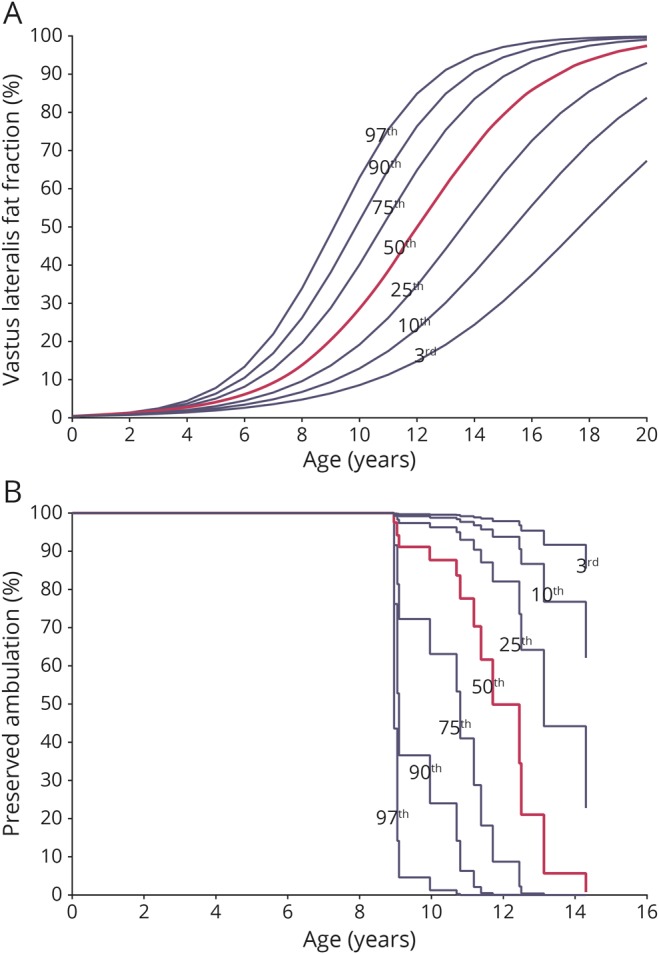
Growth charts based on data of patients with Duchenne muscular dystrophy (DMD) from Leiden University Medical Center (LUMC) plotted vs age. (A) We generated a vastus lateralis (VL) fat fraction (FF) growth chart with a 3rd, 10th, 25th, 50th, 75th, 90th, and 97th percentile curve from the predicted LUMC VL FF data. (B) Using the resulting hazard ratio from the LUMC cohort, we transformed the predicted LUMC VL FF growth curves to survival curves for preserved ambulation. A patient on the third percentile in the VL FF growth chart is also on the third percentile in the survival chart.
Discussion
This study aimed to relate quantitative muscle MRI to a clinically meaningful endpoint in DMD to substantiate the use of qMRI in clinical trials. The elevated hazard ratio in the LUMC cohort supports the use of qMRI as a surrogate outcome measure in clinical trials in DMD because it shows a direct relation between VL FF and losing ambulation.
Natural history studies and multiple placebo cohorts from clinical trials show that DMD progresses at different rates in different patients.27–32 The most commonly used 6MWT and any functional test of individual ambulant patients with DMD are hallmarked by successive periods of increase, stabilization, and decline. This limits their applicability in clinical trials including both early- and late-ambulant boys, especially when studying drugs such as antisense oligonucleotides that aim to prevent deterioration through exon skipping rather than to improve muscle strength. In contrast to clinical parameters in this growing population, FF increases throughout life according to a sigmoidal curve.13,14 The use of qMRI-determined FFs as a surrogate outcome in clinical trials has so far been hampered by the absence of large natural history datasets3 and a clear interrelation with functional and clinically meaningful outcomes. While cross-sectional correlations between muscle FF, strength, and function at the time of qMRI or magnetic resonance spectroscopy have been described extensively in DMD, a correlation does not prove causality.4,5,9,15–20 Even unrelated biological parameters that consistently increase or decrease with age will inherently correlate with functional parameters in a progressive disease. Therefore, such correlations alone are not sufficient to qualify qMRI FF as a surrogate outcome measure. In addition, many of these studies used outcomes of clinical assessments as a correlate rather than milestones such as LoA. This last variable is clearly clinically meaningful in the course of DMD, while, for example, absolute distances on the 6MWT are more difficult to interpret.6,7 Finally, the survival analysis applied here enables the use of previously reached endpoints and longer follow-up without patients having to continue visiting the study site because it relates qMRI FF to a clinical endpoint rather than an assessment performed at the time of MRI.
The excellent interobserver reliability found is important in view of differences in fat replacement along the proximodistal axis of muscles in DMD.23 In facioscapulohumeral muscular dystrophy, FF determination also yielded an excellent interobserver reliability (ICC 0.992).33 Thus, ROIs can confidently be drawn at local sites in clinical trials across multiple institutions, while decisions on scan inclusion and which slices to use should be made with central reading. Furthermore, previous studies reported that FF determination is accurate and reproducible on 1.5T and 3.0T MRI scanners.34 Together with the high intersite reliability and repeatability previously shown in DMD,12 these results even further support the feasibility of the use of qMRI to determine FF in DMD in multicenter studies.
Increasingly, trial designs rely on categorizing patients according to their baseline walking distance35 or the inclusion of patients in whom combined results of functional tests and age predict a certain trajectory (e.g., NCT02851797). Modeling the rate of disease progression by qMRI FF as applied in the current study could be used to determine a patient-specific sigmoidal FF curve that is consistent throughout the course of the disease and to facilitate the inclusion of a targeted population at baseline.36 Similarly, the hazard ratio resulting from the survival analysis and VL FF growth chart could be used in trials to generate a survival chart. Every patient-specific sigmoidal FF curve then corresponds to a percentile curve on the VL FF growth chart and to a percentile curve on the survival chart for a clinical endpoint (figure 4, A and B). Thus, the analysis can be used to stratify randomization to better account for prognostic factors in the small sample sizes that are available in this rare disease.
The 2 cohorts consisted of patients with clinically and genetically confirmed DMD, which was the main inclusion criterion for both natural history studies. Consistent with prior studies,28 individual 6MWT trajectories at both sites showed a high interpatient variability. However, CCHMC patients were clearly at the better end of the disease spectrum. Possible explanations are the selection of only ambulant patients for the natural history study protocol at CCHMC, the earlier start of steroid treatment, the use of another steroid regimen, and the selection of skippable mutations. In previous studies, daily deflazacort and daily prednisone appear to have similar effects on strength and function tests in DMD,37,38 while in other studies, daily deflazacort and daily prednisone seem to have superior effects on ambulation compared to intermittent dosing of prednisone.39,40 Eligibility for skipping of exon 44 is also known to be associated with a milder disease course.41,42 Despite these differences in motor performance by age, the absolute distances walked on the 6MWTs showed a similar relationship with the VL FF in both cohorts, illustrating the tight association between VL FF and ambulatory ability.
Several limitations of the study need to be mentioned. First, the hazard ratio results could not be replicated in the CCHMC cohort. This could be due to the limited number of 3 LoA events that happened during a follow-up period for ambulant patients of 2.2 to 3.0 years. In contrast, 7 of the 19 LUMC patients with VL FF data lost their ambulation before the start of the study, and another 7 lost their ambulation during the follow-up period for ambulant patients of 4.5 to 5.0 years. Second, meticulous determination of LoA is important for the model, and the retrospective design of the current study could have influenced this. We suspect this influence to be minimal because patients and families considered LoA a life-changing event, and LoA was established during regular clinical follow-up for all 3 CCHMC patients and 10 of 14 LUMC patients with VL FF data. Finally, the small sample size and limited number of time points per patient did not allow us to model the intercept of the FF curves. Adding this parameter to the slopes would increase the flexibility of the model and could improve prediction of FF curves.14
We found VL FF to have added predictive value to age on LoA in the LUMC cohort that represented a more severe spectrum of the disease. By applying a well-defined anatomic landmark, we found an excellent interobserver reliability for VL FF determined by quantitative Dixon MRI, which supports the feasibility of multicenter muscle qMRI studies in DMD. In relatively small clinical trials, randomization can be stratified by the patient-specific modeling of a sigmoidal FF curve that corresponds to percentile curves on the VL FF growth chart and the survival chart. Although results should be confirmed in a larger cohort with prospective determination of the clinical endpoint, our results support the use of FF assessed with qMRI as a surrogate endpoint or stratification tool in clinical trials in DMD.
Acknowledgment
The authors thank Susan J. Ward, PhD (founder and executive director of the collaborative Trajectory Analysis Project), for her critical review of the manuscript.
Glossary
- CCHMC
Cincinnati Children's Hospital Medical Center
- CI
confidence interval
- DMD
Duchenne muscular dystrophy
- FF
fat fraction
- ICC
intraclass correlation coefficient
- LoA
loss of ambulation
- LUMC
Leiden University Medical Center
- PRO-DMD-01
Prospective Natural History Study of Progression of Subjects With Duchenne Muscular Dystrophy
- qMRI
quantitative MRI
- ROI
region of interest
- SI
signal intensity
- 6MWT
6-minute walking test
- TE
echo time
- TR
repetition time
- VL
vastus lateralis
Appendix. Authors


Study funding
The LUMC natural history study was funded by the Netherlands Organization for Health Research and Development (ZonMw) (grant 113302001). The PRO-DMD-01 natural history study (NCT01753804) was sponsored by Prosensa Therapeutics B.V. and BioMarin. The EU BIOIMAGE-NMD program with project ID 602485 was funded under FP7-HEALTH-2013-INNOVATION-1.
Disclosure
K.J. Naarding reports no disclosures relevant to the manuscript. H. Reyngoudt reports grants from the European Union (EU) and worked or is working as an investigator of clinical trials for Roche, Sarepta, BioMarin, Genethon, and Sanofi. E.W. van Zwet and M.T. Hooijmans report no disclosures relevant to the manuscript. C. Tian worked as investigator of clinical trials of BMS, Roche, Pfizer, PTC, Sarepta, Summit, Santhera, and Capricor. I. Rybalsky worked as investigator of clinical trials of BMS, Roche, Pfizer, PTC, Sarepta, Summit, Santhera, and Capricor. K.C. Shellenbarger reports no disclosures relevant to the manuscript. J. Le Louër reports grants from the EU and worked or is working as an investigator of clinical trials for Roche, Sarepta, BioMarin, Genethon, and Sanofi. B.L. Wong worked as an investigator of clinical trials of BioMarin and received honoraria from serving on the advisory board of Biomarin. P.G. Carlier reports grants from the EU and allowance for lectures by BioMarin and Santhera and worked or is working as an investigator of clinical trials for Roche, Sarepta, BioMarin, Genethon, and Sanofi. H.E. Kan reports grants from ZonMW, AFM, Duchenne Parent Project, Gratama Stichting, NWO, and the EU; research support from Philips Healthcare; consultancy for BioMarin and aTyr Pharma; and trial support from ImagingDMD-UF. E.H. Niks reports grants from Duchenne Parent Project, ZonMW, and AFM; consultancies for BioMarin, Summit, and WAVE; and worked as an investigator of clinical trials of BioMarin, GSK, Lilly, Santhera, Givinostat, WAVE, and Roche. All reimbursements were received by the LUMC. No personal financial benefits were received. Go to Neurology.org/N for full disclosures.
References
- 1.Cros D, Harnden P, Pellissier JF, Serratrice G. Muscle hypertrophy in Duchenne muscular dystrophy: a pathological and morphometric study. J Neurol 1989;236:43–47. [DOI] [PubMed] [Google Scholar]
- 2.Verhaart IEC, Aartsma-Rus A. Therapeutic developments for Duchenne muscular dystrophy. Nat Rev Neurol 2019;15:373–386. [DOI] [PubMed] [Google Scholar]
- 3.Straub V, Balabanov P, Bushby K, et al. Stakeholder cooperation to overcome challenges in orphan medicine development: the example of Duchenne muscular dystrophy. Lancet Neurol 2016;15:882–890. [DOI] [PubMed] [Google Scholar]
- 4.Barnard AM, Willcocks RJ, Finanger EL, et al. Skeletal muscle magnetic resonance biomarkers correlate with function and sentinel events in Duchenne muscular dystrophy. PLoS One 2018;13:e0194283. [DOI] [PMC free article] [PubMed] [Google Scholar]
- 5.Bonati U, Hafner P, Schädelin S, et al. Quantitative muscle MRI: a powerful surrogate outcome measure in Duchenne muscular dystrophy. Neuromuscul Disord 2015;25:679–685. [DOI] [PubMed] [Google Scholar]
- 6.CDER, CBER. Duchenne muscular dystrophy and related dystrophinopathies: developing drugs for treatment: guidance for industry. Available at: fda.gov/media/92233/download. Accessed May 1, 2019.
- 7.CHMP. Guideline on the clinical investigation of medicinal products for the treatment of Duchenne and Becker muscular dystrophy. Available at: ema.europa.eu/docs/en_GB/document_library/Scientific_guideline/2015/12/WC500199239.pdf. Accessed May 1, 2019.
- 8.Willcocks RJ, Rooney WD, Triplett WT, et al. Multicenter prospective longitudinal study of magnetic resonance biomarkers in a large Duchenne muscular dystrophy cohort. Ann Neurol 2016;79:535–547. [DOI] [PMC free article] [PubMed] [Google Scholar]
- 9.Wokke BH, van den Bergen JC, Versluis MJ, et al. Quantitative MRI and strength measurements in the assessment of muscle quality in Duchenne muscular dystrophy. Neuromuscul Disord 2014;24:409–416. [DOI] [PubMed] [Google Scholar]
- 10.Godi C, Ambrosi A, Nicastro F, et al. Longitudinal MRI quantification of muscle degeneration in Duchenne muscular dystrophy. Ann Clin Transl Neurol 2016;3:607–622. [DOI] [PMC free article] [PubMed] [Google Scholar]
- 11.Azzabou N, Loureiro de Sousa P, Caldas E, Carlier PG. Validation of a generic approach to muscle water T2 determination at 3T in fat-infiltrated skeletal muscle. J Magn Reson Imaging 2015;41:645–653. [DOI] [PubMed] [Google Scholar]
- 12.Forbes SC, Walter GA, Rooney WD, et al. Skeletal muscles of ambulant children with Duchenne muscular dystrophy: validation of multicenter study of evaluation with MR imaging and MR spectroscopy. Radiology 2013;269:198–207. [DOI] [PMC free article] [PubMed] [Google Scholar]
- 13.Hooijmans MT, Doorenweerd N, Baligand C, et al. Spatially localized phosphorous metabolism of skeletal muscle in Duchenne muscular dystrophy patients: 24-month follow-up. PLoS One 2017;12:e0182086. [DOI] [PMC free article] [PubMed] [Google Scholar]
- 14.Rooney WD, Berlow Y, Forbes SC, et al. Imaging in neuromuscular disease 2017: first International Conference on Imaging in Neuromuscular Disease, 19th—21st November 2017, Berlin, Germany; abstract 44: statistical modeling of 5-year longitudinal data from a large cohort of Duchenne muscular dystrophy (DMD) subjects: an interim look at temporal characteristics of disease progression from the ImagingDMD study. J Neuromuscul Dis 2017;4:S1–s63. [Google Scholar]
- 15.Fischmann A, Hafner P, Gloor M, et al. Quantitative MRI and loss of free ambulation in Duchenne muscular dystrophy. J Neurol 2013;260:969–974. [DOI] [PubMed] [Google Scholar]
- 16.Wary C, Azzabou N, Giraudeau C, et al. Quantitative NMRI and NMRS identify augmented disease progression after loss of ambulation in forearms of boys with Duchenne muscular dystrophy. NMR Biomed 2015;28:1150–1162. [DOI] [PubMed] [Google Scholar]
- 17.Akima H, Lott D, Senesac C, et al. Relationships of thigh muscle contractile and non-contractile tissue with function, strength, and age in boys with Duchenne muscular dystrophy. Neuromuscul Disord 2012;22:16–25. [DOI] [PMC free article] [PubMed] [Google Scholar]
- 18.Hogrel JY, Wary C, Moraux A, et al. Longitudinal functional and NMR assessment of upper limbs in Duchenne muscular dystrophy. Neurology 2016;86:1022–1030. [DOI] [PMC free article] [PubMed] [Google Scholar]
- 19.Willcocks RJ, Triplett WT, Forbes SC, et al. Magnetic resonance imaging of the proximal upper extremity musculature in boys with Duchenne muscular dystrophy. J Neurol 2017;264:64–71. [DOI] [PMC free article] [PubMed] [Google Scholar]
- 20.Gaeta M, Messina S, Mileto A, et al. Muscle fat-fraction and mapping in Duchenne muscular dystrophy: evaluation of disease distribution and correlation with clinical assessments: preliminary experience. Skeletal Radiol 2012;41:955–961. [DOI] [PubMed] [Google Scholar]
- 21.van den Bergen JC, Ginjaar HB, van Essen AJ, et al. Forty-five years of Duchenne muscular dystrophy in the Netherlands. J Neuromuscul Dis 2014;1:99–109. [PubMed] [Google Scholar]
- 22.Hooijmans MT, Damon BM, Froeling M, et al. Evaluation of skeletal muscle DTI in patients with Duchenne muscular dystrophy. NMR Biomed 2015;28:1589–1597. [DOI] [PMC free article] [PubMed] [Google Scholar]
- 23.Hooijmans MT, Niks EH, Burakiewicz J, et al. Non-uniform muscle fat replacement along the proximodistal axis in Duchenne muscular dystrophy. Neuromuscul Disord 2017;27:458–464. [DOI] [PubMed] [Google Scholar]
- 24.Chrzanowski SM, Baligand C, Willcocks RJ, et al. Multi-slice MRI reveals heterogeneity in disease distribution along the length of muscle in Duchenne muscular dystrophy. Acta Myol 2017;36:151–162. [PMC free article] [PubMed] [Google Scholar]
- 25.Gold GE, Han E, Stainsby J, Wright G, Brittain J, Beaulieu C. Musculoskeletal MRI at 3.0 T: relaxation times and image contrast. AJR Am J Roentgenol 2004;183:343–351. [DOI] [PubMed] [Google Scholar]
- 26.Cicchetti DV, Sparrow SA. Developing criteria for establishing interrater reliability of specific items: applications to assessment of adaptive behavior. Am J Ment Defic 1981;86:127–137. [PubMed] [Google Scholar]
- 27.Goemans N, Vanden Hauwe M, Signorovitch J, Swallow E, Song J. Individualized prediction of changes in 6-minute walk distance for patients with Duchenne muscular dystrophy. PLoS One 2016;11:e0164684. [DOI] [PMC free article] [PubMed] [Google Scholar]
- 28.Mercuri E, Signorovitch JE, Swallow E, Song J, Ward SJ. Categorizing natural history trajectories of ambulatory function measured by the 6-minute walk distance in patients with Duchenne muscular dystrophy. Neuromuscul Disord 2016;26:576–583. [DOI] [PMC free article] [PubMed] [Google Scholar]
- 29.McDonald CM, Henricson EK, Abresch RT, et al. The 6-minute walk test and other endpoints in Duchenne muscular dystrophy: longitudinal natural history observations over 48 weeks from a multicenter study. Muscle Nerve 2013;48:343–356. [DOI] [PMC free article] [PubMed] [Google Scholar]
- 30.Pane M, Mazzone ES, Fanelli L, et al. Reliability of the performance of upper limb assessment in Duchenne muscular dystrophy. Neuromuscul Disord 2014;24:201–206. [DOI] [PubMed] [Google Scholar]
- 31.Bushby K, Finkel R, Wong B, et al. Ataluren treatment of patients with nonsense mutation dystrophinopathy. Muscle Nerve 2014;50:477–487. [DOI] [PMC free article] [PubMed] [Google Scholar]
- 32.Goemans N, Mercuri E, Belousova E, et al. A randomized placebo-controlled phase 3 trial of an antisense oligonucleotide, drisapersen, in Duchenne muscular dystrophy. Neuromuscul Disord 2018;28:4–15. [DOI] [PubMed] [Google Scholar]
- 33.Mul K, Vincenten SCC, Voermans NC, et al. Adding quantitative muscle MRI to the FSHD clinical trial toolbox. Neurology 2017;89:2057–2065. [DOI] [PMC free article] [PubMed] [Google Scholar]
- 34.Hernando D, Sharma SD, Aliyari Ghasabeh M, et al. Multisite, multivendor validation of the accuracy and reproducibility of proton-density fat-fraction quantification at 1.5T and 3T using a fat-water phantom. Magn Reson Med 2017;77:1516–1524. [DOI] [PMC free article] [PubMed] [Google Scholar]
- 35.McDonald CM, Campbell C, Torricelli RE, et al. Ataluren in patients with nonsense mutation Duchenne muscular dystrophy (ACT DMD): a multicentre, randomised, double-blind, placebo-controlled, phase 3 trial. Lancet 2017;390:1489–1498. [DOI] [PubMed] [Google Scholar]
- 36.Pane M, Mazzone ES, Sivo S, et al. Long term natural history data in ambulant boys with Duchenne muscular dystrophy: 36-month changes. PLoS One 2014;9:e108205. [DOI] [PMC free article] [PubMed] [Google Scholar]
- 37.Griggs RC, Miller JP, Greenberg CR, et al. Efficacy and safety of deflazacort vs prednisone and placebo for Duchenne muscular dystrophy. Neurology 2016;87:2123–2131. [DOI] [PMC free article] [PubMed] [Google Scholar]
- 38.Matthews E, Brassington R, Kuntzer T, Jichi F, Manzur AY. Corticosteroids for the treatment of Duchenne muscular dystrophy. Cochrane Database Syst Rev 2016:CD003725. [DOI] [PMC free article] [PubMed] [Google Scholar]
- 39.Ricotti V, Ridout DA, Scott E, et al. Long-term benefits and adverse effects of intermittent versus daily glucocorticoids in boys with Duchenne muscular dystrophy. J Neurol Neurosurg Psychiatry 2013;84:698–705. [DOI] [PubMed] [Google Scholar]
- 40.McDonald CM, Henricson EK, Abresch RT, et al. Long-term effects of glucocorticoids on function, quality of life, and survival in patients with Duchenne muscular dystrophy: a prospective cohort study. Lancet 2018;391:451–461. [DOI] [PubMed] [Google Scholar]
- 41.Pane M, Mazzone ES, Sormani MP, et al. 6 Minute walk test in Duchenne MD patients with different mutations: 12 month changes. PLoS One 2014;9:e83400. [DOI] [PMC free article] [PubMed] [Google Scholar]
- 42.van den Bergen JC, Ginjaar HB, Niks EH, et al. Prolonged ambulation in Duchenne patients with a mutation amenable to exon 44 skipping. J Neuromuscul Dis 2014;1:91–94. [PubMed] [Google Scholar]
- 43.Schönbeck Y, Talma H, van Dommelen P, et al. The world's tallest nation has stopped growing taller: the height of Dutch children from 1955 to 2009. Pediatr Res 2013;73:371–377. [DOI] [PubMed] [Google Scholar]
Associated Data
This section collects any data citations, data availability statements, or supplementary materials included in this article.
Data Availability Statement
Anonymized data can be made available to qualified investigators on request.


