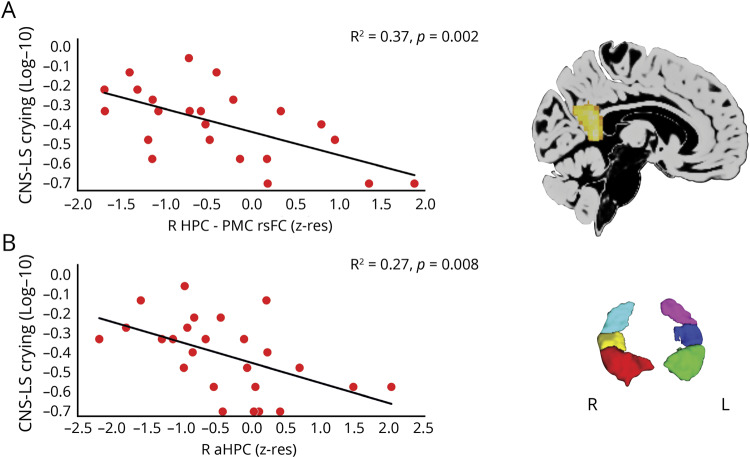
Figure 1. “Labile crying” scores in patients with autoimmune limbic encephalitis: structure/function–behavior relationships.
Bivariate correlations between Center for Neurologic Study–Lability Scale (CNS-LS) scores for labile crying (log-transformed) and measures of structural and functional abnormalities. (A) Correlation with mean resting-state functional connectivity (rsFC) between the right hippocampus (HPC) and posteromedial cortex (PMC). (B) Correlation with volume of the (manually delineated) right anterior HPC (head). Red = right HPC head; yellow = right HPC body; teal = right HPC tail; green = left HPC head; blue = left HPC body; pink = left HPC tail. R, L = right, left (hemisphere); z-res = volumes are residualized against age, sex, total intracranial volume, and study (Memory and Amnesia Project, Oxford Project to Investigate Memory and Ageing) across participants; mean rsFC values are residualized against age and sex across participants.

