Abstract
Objective
To determine if CSF and plasma levels of soluble vascular endothelial (sVE)-cadherin are associated with functional outcome after subarachnoid hemorrhage (SAH) and to investigate sVE-cadherin effects on microglia.
Methods
Serial CSF and plasma were collected from prospectively enrolled patients with nontraumatic SAH from a ruptured aneurysm in the anterior circulation and who required an external ventricular drain for clinical indications. Patients with normal-pressure hydrocephalus without SAH served as controls. For prospective assessment of long-term outcomes at 3 and 6 months after SAH, modified Rankin Scale scores (mRS) were obtained and dichotomized into good (mRS ≤ 2) vs poor (mRS > 2) outcome groups. For SAH severity, Hunt and Hess grade was assessed. Association of CSF sVE-cadherin levels with long-term outcomes, HH grade, and CSF tumor necrosis factor (TNF)-α levels were evaluated. sVE-cadherin effects on microglia were also studied.
Results
sVE-cadherin levels in CSF, but not in plasma, were higher in patients with SAH and were associated with higher clinical severity and higher CSF TNF-α levels. Patients with SAH with higher CSF sVE-cadherin levels over time were more likely to develop worse functional outcome at 3 months after SAH. Incubation of cultured microglia with sVE-cadherin resulted in increased inducible nitric oxide synthase, interleukin-1β, reactive oxygen species, cell soma size, and metabolic activity, consistent with microglia activation. Microinjection of sVE-cadherin fragments into mouse brain results in an increased number of microglia surrounding the injection site, compared to injection of denatured vascular endothelial–cadherin fragments.
Conclusions
These results support the existence of a novel pathway by which sVE-cadherin, released from injured endothelium after SAH, can shift microglia into a more proinflammatory phenotype and contribute to neuroinflammation and poor outcome in SAH.
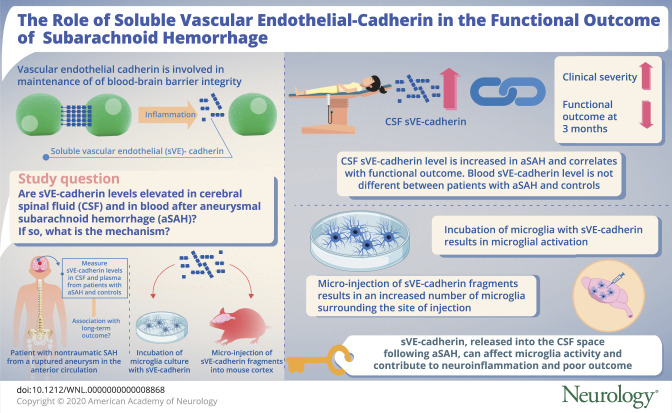
Vascular endothelial (VE)-cadherin is an endothelial adhesion protein essential in endothelial proliferation, survival, and maintenance of barrier function.1–6 During inflammatory states, its extracellular domain is cleaved by proteases into fragments with functions distinct from full-length VE-cadherin.5,7,8 These fragments, referred to collectively as soluble VE (sVE)-cadherin, have been detected in human blood samples in collagen-vascular disease, sepsis, and malignancies8–12 and found to be associated with clinical outcome.9,11,13,14 The role of sVE-cadherin in neurologic diseases is not known.
The current study investigates the role of sVE-cadherin fragments in aneurysmal subarachnoid hemorrhage (SAH), a disease in which inflammation plays a key role.15–18 We hypothesize that sVE-cadherin may be elevated in CSF after SAH, and that its CSF levels may be associated with SAH clinical outcome. Furthermore, since SAH is also associated with an increased incidence of systemic inflammation,16–18 we hypothesize that sVE-cadherin may be increased in the blood of patients with SAH, and that blood sVE-cadherin may be associated with clinical outcome in SAH. In an attempt to identify a mechanistic pathway that might explain the association between CSF sVE-cadherin levels and functional outcome, we performed in vitro studies to determine the effect of sVE-cadherin on microglia, the major effectors of inflammation within the CNS.19,20
Methods
SAH recruitment and biospecimen collection
Serial plasma and CSF were collected from prospectively enrolled patients with nontraumatic SAH if patients had an external ventricular drain (EVD) placed for clinical indications. Consecutive adult patients with SAH with a ruptured aneurysm in the anterior circulation were included.21 Patients with suspected idiopathic normal-pressure hydrocephalus (iNPH) without SAH served as controls.22 CSF was sampled on day 1 and subsequent days in patients with SAH, and sampled once in controls. All patients were enrolled after informed consent and in accordance with institutional review board-approved protocols. For SAH clinical and radiographic severity grades, Hunt and Hess (HH) grade and modified Fisher grade were assessed.23,24 Long-term outcomes were prospectively assessed using the modified Rankin Scale (mRS) and dichotomized into good (mRS ≤ 2) vs poor (mRS > 2) outcome groups. For statistical analysis, logarithmic transformation of sVE-cadherin levels was undertaken due to non-normal distribution. Mixed model repeated measures analysis was performed after logarithmic transformation of sVE-cadherin data.
Quantification of sVE-cadherin in CSF and plasma
Quantification of VE-cadherin in plasma and CSF were assessed by ELISA (R&D Systems, Minneapolis, MN). Since ELISA does not distinguish between full-length VE-cadherin and fragments,8 immunoblotting was used to differentiate these proteins by size. CSF ADAM10 was quantified by ELISA (MyBioSource, San Diego, CA). CSF tumor necrosis factor (TNF)–α was measured using Human Cytokine Assay (R&D Systems). sVE-cadherin in cell-culture media was concentrated by acetone precipitation as described previously.25
Endothelial and microglial culture
Human brain microvascular endothelial cells (HBMEC) were obtained from Cell Systems Corporation (Kirkland, WA) and grown to a confluent monolayer. Microglia were isolated from Sprague-Dawley rat pups as described previously.26,27
Generation of sVE-cadherin for use in in vitro experiments
sVE-cadherin was generated as published previously with several modifications.8 Incubation of recombinant VE-cadherin (50 µg/mL in the reaction mix) and ADAM10 (58 µg/mL in the reaction mix) generated sVE-cadherin fragments along with undigested full-length VE-cadherin. ADAM10 was then removed from the reaction mix using immunoprecipitation (IP) with an antibody to ADAM10. After IP, the supernatant was confirmed to contain mostly sVE-cadherin, with minimal amounts of full-length VE-cadherin and minimal amounts of ADAM10, and was used in experiments by adding to culture media. The final concentration of VE-cadherin proteins (mostly soluble fragments with some residual full length VE-cadherin) was 500 ng/mL. MyD88 inhibitor–peptide (50 μM) or phosphate-buffered saline (PBS) was added to culture media 45 minutes prior to adding sVE-cadherin.
Injection of sVE-cadherin fragments into mouse brain
All experiments were reviewed and approved by the Subcommittee for Research Animal Care of the Massachusetts General Hospital Institutional Animal Care and Use Committee (IACUC). All animal protocols are consistent with the NIH Guide for the Care and Use of Laboratory Animals. Male C57BL/6 mice (12–14 weeks old; The Jackson Laboratory, Bar Harbor, ME) were anesthetized with 2.0% isoflurane and maintained on 1.5% isoflurane in 70% N2O and 30% O2, maintaining the rectal temperature between 36.5°C and 37.5°C with heat-pad feedback system. Animals were secured in a stereotactic frame (KOPF Instruments, Tujunga, CA), and a unilateral craniotomy was performed with a high-speed drill over the left frontoparietal cortex, leaving the dura mater completely intact. By using a glass pipette (custom made), 200 nL of 100 μg/mL recombinant mouse sVE-cadherin fragment (n = 3; Abcam, Cambridge, MA) was injected into 4 locations in the cortex, as described previously with slight modification.28 Control mice were injected with vehicle (artificial CSF, n = 2) or with a heat-denatured (95°C for 10 minutes) sVE-cadherin fragment (n = 3). Mice were killed under deep anesthesia 48 hours after injection. All experiments and measurements were performed in a blinded and randomized fashion.
Immunohistochemistry
Mouse brains were removed 48 hours after injection of a mouse sVE-cadherin fragment into the cortex. Twenty-micrometer-thick coronal sections were fixed for 12 minutes at −20°C with methanol, blocked with 3% bovine serum albumin (Sigma-Aldrich, St. Louis, MO) in PBS, then incubated for 24 hours at 4°C with rabbit antibody against Iba1 (1:200; Fujifilm Wako Pure Chemicals USA, Richmond, VA). Images were obtained using a fluorescence microscope (Nikon, Tokyo, Japan). Quantitative analysis was conducted by counting cells that were positive for Iba1, a microglial marker. The cell count within 0.09 mm2 surrounding the injection site was quantified by a blinded investigator.
Statistics
Continuous data were compared using 2-tailed Student t test or Wilcoxon rank-sum test depending on data normality. sVE-cadherin levels over time were analyzed using mixed-model repeated measures analysis with autoregressive covariance structure and with log-transformation for non-normally distributed sVE-cadherin data (JMP Pro 14). Exploratory analyses of CSF sVE-cadherin on individual days vs Fisher grade or vasospasm status was performed using 1-factor analysis of variance (ANOVA). Model selections were based on optimal goodness of fit assessed using Akaike information criterion values and examination of standardized residuals and residual quantile plot. We did not impute any missing data. Associations between continuous variables were analyzed using Spearman correlation. Differences were considered significant at p < 0.05 for each of the 2 primary hypotheses.
Study approval
Approval for the human study was granted by the local institutional review board (2007P002168), Partners Healthcare, Boston, Massachusetts. All clinical investigations were conducted according to Declaration of Helsinki principles. Written informed consent was received from each patient or health care proxy prior to study enrollment. Samples were collected after informed consent was obtained. Approval for isolation of microglia for primary cultures was granted through an IACUC protocol through the Massachusetts General Hospital Subcommittee on Research Animal care (2011N000064) and in accordance with the NIH Guide for Care and Use of Laboratory Animals.
Data availability
Derived data supporting the findings of this study are available from the corresponding author upon request.
Results
Human participant characteristics
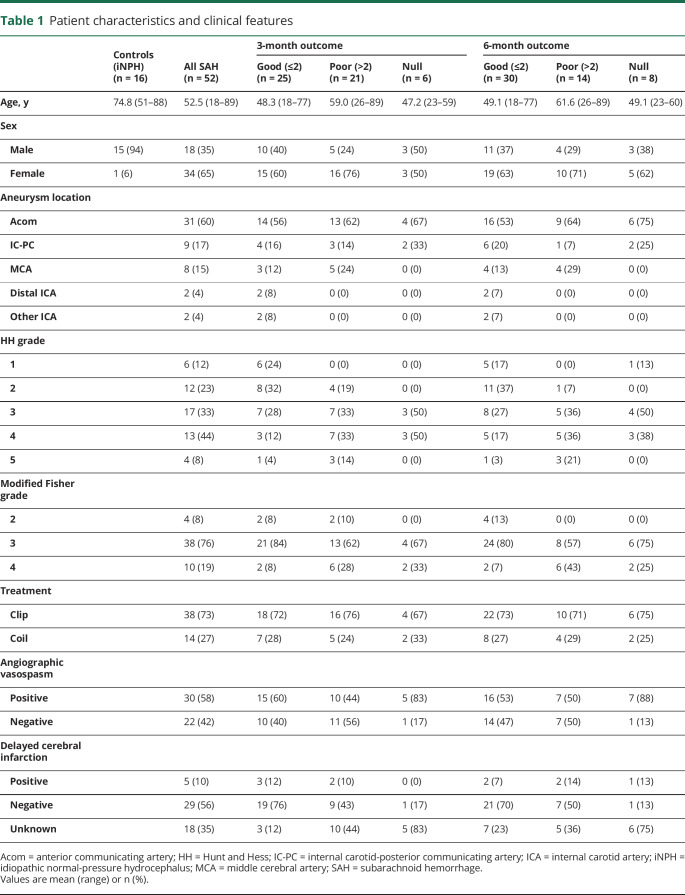
Fifty-two patients with anterior circulation aneurysmal SAH and 16 controls with suspected iNPH without SAH were included (table 1).
Table 1.
Patient characteristics and clinical features
CSF sVE-cadherin level is increased in SAH and correlates with functional outcome
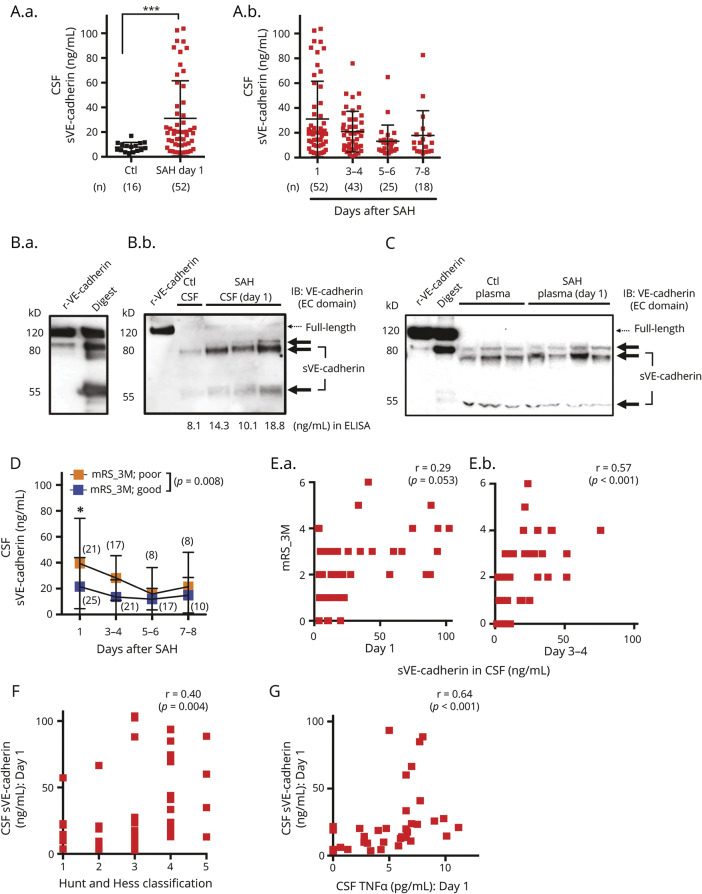
sVE-cadherin is present in CSF and plasma in patients with SAH and in controls (table e-1, doi.org/10.5061/dryad.0622fk2 and figure 1, A–C). CSF sVE-cadherin is significantly higher in patients with SAH on post-SAH day 1 compared to controls (figure 1A; p = 0.0002, Mann-Whitney U test). For our primary hypothesis analysis, we performed mixed model repeated measures regression to determine the relationship between CSF sVE-cadherin levels over time and SAH outcome. Mixed model repeated measures analysis of CSF sVE-cadherin data was performed after logarithmic transformation, which was undertaken due to non-normal distribution. Log-transformed CSF sVE-cadherin levels over time were significantly different between the good outcome group (mRS ≤ 2) and the poor outcome group (mRS > 2) at 3 months post SAH, with higher mean values in the poor outcome group (figure 1D; p = 0.008). An association was observed between log CSF sVE-cadherin levels and functional outcome at 3 months after SAH (figure 1E: [E.a.: day 1] Spearman ρ 0.29, p = 0.053; [E.b.: day 3–4] Spearman ρ 0.57, p < 0.001). A similar pattern of association was observed between log CSF sVE-cadherin levels and functional outcome at 6 months after SAH, but this did not reach statistical significance (figure e-1A, doi.org/10.5061/dryad.0622fk2; p = 0.087, mixed model analysis with autoregressive covariance structure and with log-transformation; figure e-1B, doi.org/10.5061/dryad.0622fk2; [left: day 1] Spearman ρ 0.26, p = 0.092; [right: day 3–4] Spearman ρ 0.49, p = 0.003). Higher post-SAH day 1 CSF sVE-cadherin levels are positively associated with a worse SAH severity (higher HH grade) (figure 1F; Spearman ρ 0.40, p = 0.004).
Figure 1. Soluble vascular endothelial (sVE)-cadherin is present at higher levels in the CSF of patients with subarachnoid hemorrhage (SAH) and is associated with functional outcome.
(A.a.) CSF sVE-cadherin level in patients with SAH on day 1 after SAH compared to that of controls (p = 0.0002, Mann-Whitney U test). (A.b.) CSF sVE-cadherin levels on subsequent days after SAH. No control samples are available on these days. (B.a.) 80 and 55 kD proteins are the predominant forms of sVE-cadherin fragments generated when recombinant human vascular endothelial (VE)-cadherin is incubated with recombinant human ADAM10 (digest). (B.b.) The major forms of VE-cadherin in the CSF of control patients and patients with SAH are also 80 and 55 kD. CSF with higher VE-cadherin levels measured by ELISA contains the same fragments in larger quantities, with minimal amounts of full-length VE-cadherin. (C) A representative Western blot of plasma shows that the major forms of VE-cadherin in the plasma of control patients and patients with SAH are comprised of 80 and 55 kD fragments with minimal amounts of full-length VE-cadherin. (D) Patients with SAH who developed poor outcome (modified Rankin Scale [mRS] > 2) at 3 months had higher CSF sVE-cadherin levels over time compared to those who had good outcome (mRS < 2) at 3 months (p = 0.008 using mixed model analysis with autoregressive covariance structure and with log-transformation for non-normally distributed data). (E) There is a positive correlation between mRS-3M and CSF sVE-cadherin levels collected on day 1 (E.a.; r = 0.29, p = 0.053) and day 3-4 (E.b.; r = 0.57, p < 0.001; Spearman correlation). (F) Initial Hunt and Hess classification and CSF sVE-cadherin level are positively correlated on day 1 after SAH (Spearman correlation, r = 0.40, p = 0.004). (G) CSF TNF- α and CSF sVE-cadherin levels are positively correlated on day 1 (r = 0.64, p < 0.001; Spearman correlation). EC = extracellular; IB = immunoblot; r-VE-cadherin = recombinant human vascular endothelial-cadherin.
Exploratory analyses suggest that CSF sVE-cadherin may be higher in patients with higher modified Fisher grades at the very early time points following SAH: patients with modified Fisher grade 4 SAH had higher CSF sVE-cadherin levels compared to those with grade 3 (figure e-2A, doi.org/10.5061/dryad.0622fk2; p = 0.001 on SAH day 1, p = 0.007 on SAH day 3) and grade 2 (figure e-2A, doi.org/10.5061/dryad.0622fk2; p = 0.002 on SAH day 1, p = 0.009 on SAH day 3) hemorrhages. These differences disappear at later time points. Exploratory analysis showed no association between CSF sVE-cadherin levels and vasospasm status (figure e-2B, doi.org/10.5061/dryad.0622fk2). CSF sVE-cadherin levels in patients with SAH correlated positively with CSF TNF-α levels on post-SAH day 1 (figure 1G; Spearman ρ 0.64, p < 0.001), indicating that sVE-cadherin may be involved in central inflammation. Given the sample size of this study, these exploratory analyses are all underpowered, and follow-up studies with larger sample sizes are needed to validate these findings.
Similar to the analysis of CSF sVE-cadherin, we performed exploratory analysis of plasma sVE-cadherin levels in controls and patients with SAH. Log blood (plasma) sVE-cadherin levels are 10 times higher than CSF levels at baseline, and are not different between controls and patients with SAH (data not shown). No significant differences in log sVE-cadherin blood levels over time were detected between the SAH outcome group at 3 and 6 months (data not shown).
sVE-cadherin fragments in CSF correspond to known sources of sVE-cadherin
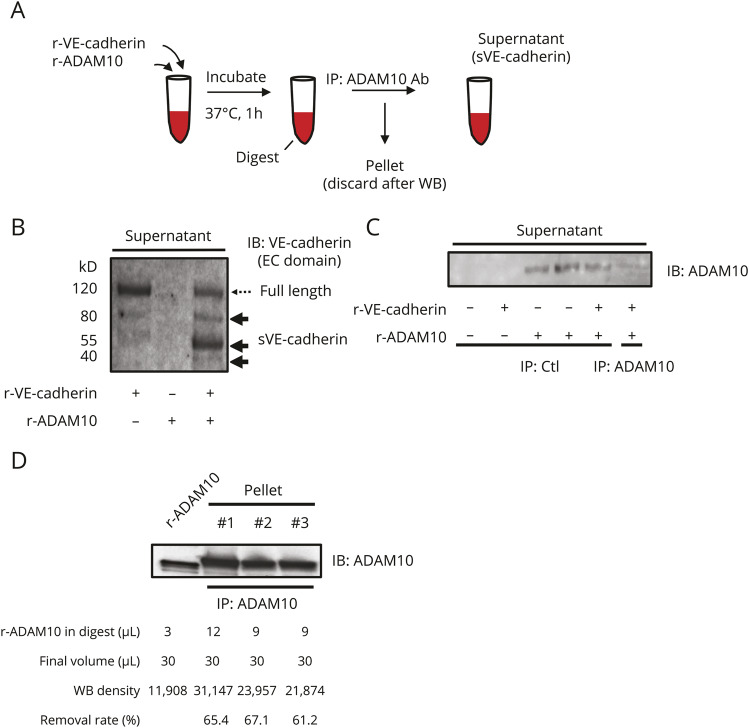
CSF and plasma sVE-cadherin levels were measured via ELISA. The ELISA antibody recognizes the extracellular domain of VE-cadherin, which is present on both full-length VE-cadherin and some sVE-cadherin fragments. To ensure that the ELISA data represent the amount of sVE-cadherin rather than full-length VE-cadherin, CSF and plasma were run on Western blot next to 2 known sources of sVE-cadherin: sVE-cadherin generated by incubating recombinant full-length VE-cadherin with ADAM10 (figures 1B and 3, A and B), which digests VE-cadherin; and sVE-cadherin released from cultured HBMEC during an inflammatory stimulus (figures 2A, C; 18 hours incubation with TNF-α [100 ng/mL]). Using the first approach, recombinant full-length VE-cadherin appears as a major 120 kD band, with small amounts of fragments appearing as 2 bands at 80 kD and 1 band at 55 kD (figures 1B.a.). After incubation with ADAM10, the amount of the 120 kD protein decreases, while the amount of the fragments (80 and 55 kD) increases. Fragments migrating at the same molecular weights are seen in CSF samples (figure 1B.b., right panel), with minimal amounts of full-length VE-cadherin. CSF samples with higher VE-cadherin levels measured by ELISA contain larger quantities of these sVE-cadherin fragments (figure 1B.a.), but not higher quantities of full-length VE-cadherin.
Figure 3. Procedure for generating soluble vascular endothelial (sVE)-cadherin.
(A) Schematic of sVE-cadherin generation from recombinant vascular endothelial (VE)–cadherin. Full-length recombinant human VE-cadherin (r-VE-cadherin) was incubated with ADAM10 and the resultant solution (digest) was subjected to immunoprecipitation (IP) with an antibody to ADAM10. (B) Full-length r-VEcadherin was incubated with ADAM10 and the resultant solution (digest) was probed on immunoblot (IB) with an antibody to the extracellular domain of VEcadherin. Full-length VE-cadherin: 120 kD; sVE-cadherin fragments: ∼80, 55, and 40 kD. (C) IB after IP; the nonimmuoprecipitated fraction (supernatant) was probed on IB using an anti-ADAM10 antibody, demonstrating that IP with an anti-ADAM10 antibody removes ADAM10 from the digest, whereas IP with a control antibody does not. (D) IB indicates that ADAM10 is captured in the pellet after IP. Quantification of amount of recombinant human ADAM10 (r-ADAM10) removed in pellet after IP. EC = extracellular; WB = Western blot.
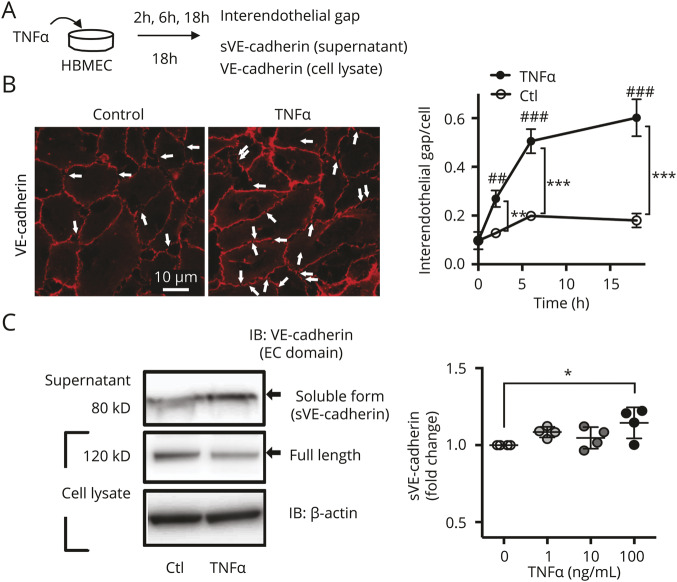
Figure 2. Inflammation induced by tumor necrosis factor (TNF)–α increases formation of interendothelial gaps and secretion of soluble vascular endothelial (sVE)-cadherin.
(A) Scheme of experimental design. Incubation of human brain microvascular endothelial cells (HBMEC) with TNF-α (100 ng/mL) leads to secretion of sVEcadherin fragments into the media, which is analyzed subsequently with ELISA and Western blot. (B) Immunofluorescent staining with an antibody to the extracellular (EC) domain of vascular endothelial (VE)-cadherin. The number of gaps in the VE-cadherin signal is increased after 18 hours incubation with TNF-α (100 ng/mL) (p < 0.001 for time or treatment; 2-way analysis of variance [ANOVA], ** p < 0.01, *** p < 0.001, ## p < 0.01, ### p < 0.001; with Tukey multiple comparison, n = 4). (C) Increased sVE-cadherin is seen in Western blots of concentrated cell culture media (same conditions as in A and B) after 18 hours incubation with TNF-α (p = 0.043 with one-way ANOVA; * p < 0.05 with Dunnett multiple comparison, n = 4). IB = immunoblot.
Using the second approach, HBMEC were incubated for 18 hours with TNF-α (100 ng/mL), resulting in increased disruptions in VE-cadherin seen by immunocytochemistry (figure 2, A and B, white arrows). The number of gaps in the VE-cadherin border was increased after 18 hours incubation with TNF-α (100 ng/mL) (p < 0.001 for time or treatment; 2-way ANOVA, **p < 0.01, ***p < 0.001, ##p < 0.01, ###p < 0.001; with Tukey multiple comparison, n = 4). Analysis of the media shows that sVE-cadherin is released from these cells as an 80 kD fragment (figure 2C), which migrates at the same molecular weight as the 80 kD sVE-cadherin fragment found in CSF of patients with SAH (figure 1B.b.). Increased sVE-cadherin was seen in Western blots of concentrated cell culture media (same conditions as in figure 2B) after 18 hours incubation with TNF-α (figure 2C, p = 0.043 with 1-way ANOVA [*p < 0.05 with Dunnett multiple comparison; n = 4]).
Together, these data support our conclusion that VE-cadherin proteins in CSF are composed mainly of sVE-cadherin fragments rather than full-length VE-cadherin, and differences in CSF VE-cadherin levels measured by ELISA reflect differences in sVE-cadherin fragments and not full-length VE-cadherin.
Similar to CSF, immunoblotting showed that VE-cadherin proteins detected by ELISA in the blood are composed mainly of sVE-cadherin fragments and not full-length VE-cadherin (figure 1C).
sVE-cadherin has downstream effects on microglia function
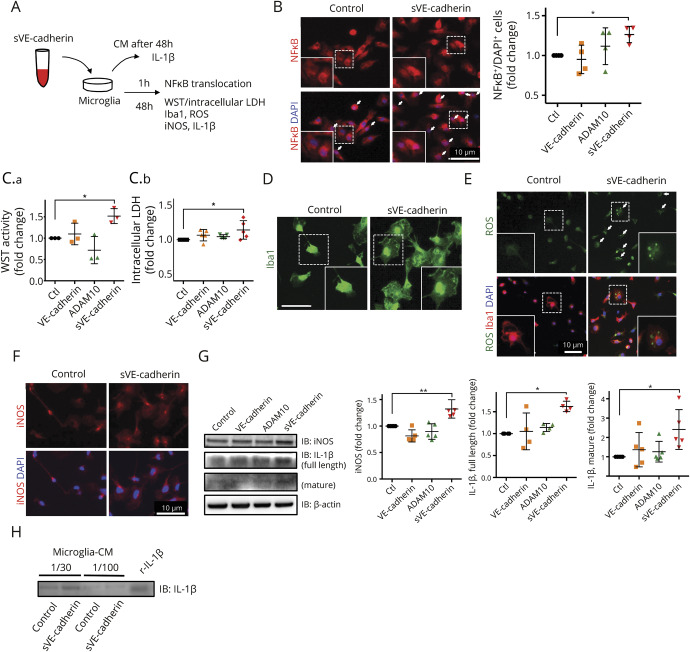
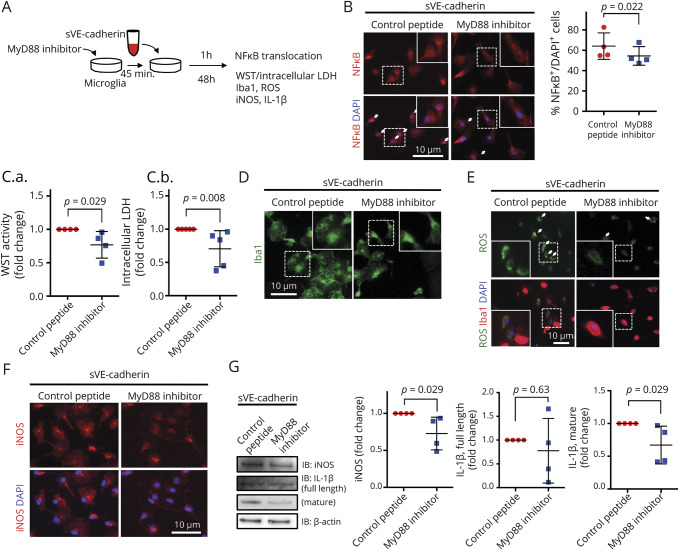
To identify a mechanistic pathway, which may explain the association between CSF sVE-cadherin levels over time and SAH clinical outcome, we examined the effect of sVE-cadherin on cultured microglia sVE-cadherin was generated by incubating recombinant VE-cadherin with recombinant ADAM10. (figure 3). After 1 hour incubation with sVE-cadherin, microglia showed increased NFκB translocation to the nucleus (figure 4B; *p < 0.05 with 1-way ANOVA with Dunnett multiple comparison, n = 4). At 48 hours, inducible nitric oxide synthase (iNOS) and interleukin (IL)-1β (full length and mature) were increased (figure 4, F and G; *p < 0.01, *p < 0.05 with 1-way ANOVA with Dunnett multiple comparison, n = 5). There was increase in the cell soma size (figure 4D) and metabolic activity, suggested by elevated intracellular lactate dehydrogenase (LDH) and WST (figure 4C; n = 3 for WST, n = 5 for LDH, *p < 0.05 with 1-way ANOVA with Dunnett multiple comparison). Increased intracellular reactive oxygen species (ROS) activation was also observed (figure 4E).29 We added an inhibitor to MyD88, an adaptor protein involved in signaling within immune cells (figure 5). Addition of the MyD88 inhibitor protein to microglia at baseline conditions did not result in any changes in WST, LDH, iNOS, full-length IL-1β, or mature IL-1β (figure e-3, doi.org/10.5061/dryad.0622fk2). In experiments in which microglia are incubated with sVE-cadherin, cotreatment with an inhibitor to MyD88 (figure 5A) ameliorates the following sVE-cadherin-induced elevations: NFκB translocation to the nucleus (figure 5B, p = 0.022, Wilcoxon signed-rank test, n = 4); microglia metabolic activity and viability (figure 5C: WST: p = 0.029, Mann-Whitney U test, n = 4; LDH: p = 0.008, Mann-Whitney U test, n = 5); microglia cell soma size (figure 5D); ROS (figure 5E); iNOS expression and iNOS translocation to the nucleus; and expression of IL-1β (figure 5, F and G, p = 0.029 [iNOS], p = 0.63 [IL-1β full-length], p = 0.029 [IL-1β mature], with Mann-Whitney U test [n = 4]). Collectively, these data suggest that sVE-cadherin increases microglial iNOS and IL-1β through a MyD88-and NFκB-mediated pathway (figure e-4, doi.org/10.5061/dryad.0622fk2).
Figure 4. Incubation with soluble vascular endothelial (sVE)-cadherin activates microglia in culture.
(A) Scheme of experimental design of cultured microglia incubated with sVE-cadherin. Conditioned culture media was subjected to Western blot to measure the levels of secreted interleukin (IL)-1β. Immunocytochemistry was performed to assess NFκB translocation, cell soma size, and reactive oxygen species (ROS) levels. Western blot of cell lysate was performed to measure the intracellular expression of inducible nitric oxide synthase (iNOS) and IL-1β. (B) Quantification of NFκB translocation to nucleus. Nuclear translocation of NFκB is defined as NFκB signal superimposed on DAPI signal. After 1 hour incubation with sVE-cadherin, NFκB translocation to the nucleus is seen in a large number of cells (p = 0.063 with 1-way analysis of variance [ANOVA]; *p < 0.05 with Dunnett multiple comparison, n = 4). (C.a.) Incubation with sVE-cadherin increases microglial metabolism/viability assessed by WST activity (p = 0.003 with 1-way ANOVA; *p < 0.05 with Dunnett multiple comparison, n = 3). (C.b.) There is a trend towards increased intracellular lactate dehydrogenase (p = 0.052 with 1-way ANOVA; *p < 0.05 with Dunnett multiple comparison, n = 5). (D) Iba1 immunofluorescence shows increased microglia cell size after incubation with sVE-cadherin (bar = 10 μm). (E) Immunostaining shows that incubation with sVE-cadherin increases ROS in culturedmicroglia (n = 2). (F, G) Forty-eight hours incubation with sVE-cadherin increases iNOS (F, immunostaining; G, Western blot) and IL-1β (G) in microglia. iNOS: p < 0.001 (**p < 0.01 with Dunnett multiple comparison); full-length IL-1β: p = 0.007; mature IL-1β: p = 0.037 with 1-way ANOVA (*p < 0.05 with Dunnett multiple comparison, n = 5). (H) Western blot indicates that IL-1β is secreted into cell culture media after microglia are incubated with sVEcadherin (n = 2). CM = conditioned culture media; VE-cadherin = vascular endothelial-cadherin.
Figure 5. Soluble vascular endothelial (sVE)-cadherin-induced activation of microglia is mediated by a MyD88 signaling pathway.
(A) Scheme of experimental design of in vitro cultured microglia cotreated with sVE-cadherin and MyD88-inhibitor peptide. Immunofluorescence was performed to evaluate NFκB translocation, cell soma size, and reactive oxygen species (ROS). Western blots were performed to measure the expression of inducible nitric oxide synthase (iNOS) and interleukin (IL)-1β. (B) Nuclear translocation of NFκB (after 1 hour incubation of microglia with sVE-cadherin) is decreased by cotreatment with an inhibitor to MyD88 (p = 0.022 with Wilcoxon signed-rank test, n = 4). (C) Cotreatment with an inhibitor to MyD88 decreases sV-cadherin-induced increase inmicroglial metabolism/viability. WST (C.a.): p = 0.029 in Mann-Whitney U test (n = 4); lactate dehydrogenase (LDH) (C.b.): p = 0.008 with Mann-Whitney U test (n = 5). (D) Cotreatment with an inhibitor to MyD88 decreases sVE-cadherin-induced increase in microglia cell size. (E) Immunostaining shows that cotreatment with an inhibitor to MyD88 decreases sVE-cadherin-induced ROS in cultured microglia (n = 2). (F, G) Cotreatment with an inhibitor to MyD88 decreases sVE-cadherin-induced microglial iNOS (F,G) andmature IL-1β expression (G): p = 0.029 (iNOS), p = 0.63 (IL-1β full-length), p = 0.029 (IL-1β mature), with Mann-Whitney U test (n = 4). Abbreviation: ROS = reactive oxygen species.
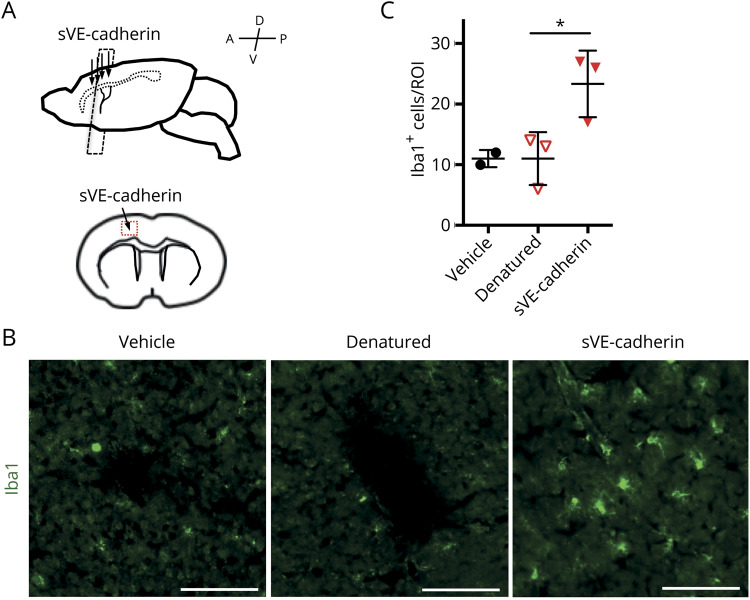
To explore the biological relevance of our in vitro data on sVE-cadherin, we examined the effect of injecting 20 ng of a sVE-cadherin fragment into the cerebral cortex of mice. Control mice were similarly injected with vehicle (artificial CSF) or with a heat-denatured sVE-cadherin fragment. Forty-eight hours after injection, the number of microglia (Iba1-positive cells) was found to be significantly increased around the injected lesion in the sVE-cadherin fragment group (figure 6, p = 0.035, 1-way ANOVA, *p < 0.05 with Dunnett multiple comparison) compared to the vehicle group or the heat-denatured sVE-cadherin fragment group. These results provide further evidence that sVE-cadherin fragments participate in signaling pathways that affect microglia activities.
Figure 6. Injection of soluble vascular endothelial (sVE)–cadherin fragment into mouse brain cortex increases microglial number near the injection site.
(A) Scheme of experimental design of injection of sVE-cadherin fragment in mice. (B, C) Immunohistochemistry with an antibody to Iba1 is used to evaluate microglia number in the area surrounding the injection site (p = 0.035 with 1-way analysis of variance; *p < 0.05 with Tukey multiple comparison; bar = 100 μm). Denatured = heat-denatured sVE-cadherin fragment; ROI = region of interest.
Discussion
In this reverse-translation study, a biological process was identified: that CSF sVE-cadherin levels are elevated in CSF of patients with SAH (table e-1, doi.org/10.5061/dryad.0622fk2; and figure 1, A and B) and associated with clinical outcome after SAH (figure 1, D and E). This observation then generated the hypothesis that during brain inflammation, sVE-cadherin is released from injured brain microvascular endothelium with possible deleterious consequences (figure 2). In vitro (figures 4 and 5) and in vivo (figure 6) experiments were then utilized to find a possible mechanism. Exposure to sVE-cadherin activated microglia (figures 4 and 5) and increased their proinflammatory output (figure 4),or presence (figure 6). Altogether, these clinical and experimental findings may be consistent with the idea that sVE-cadherin contributes to SAH pathophysiology during the early brain injury phase, during which neuroinflammation is a key process (figure e-4, doi.org/10.5061/dryad.0622fk2).30–32 Our data offer one possible mechanistic pathway by which CSF sVE-cadherin amplifies the inflammatory process: in the setting of brain injury, inflammatory cytokines increase the expression or activity state of proteolytic enzymes, which act on the extracellular domain of VE-cadherin and generate sVE-cadherin fragments. These fragments then enter the CSF space either through breaks in the blood-brain barrier (BBB) or through the path of blood flow from the aneurysm site. sVE-cadherin fragments may interact with microglia through an MyD88/NFκB pathway and shift microglia towards a more proinflammatory state, thereby further propagating the inflammatory cycle (figure 5 and figure e-4, doi.org/10.5061/dryad.0622fk2).
To our knowledge, this is the first report of sVE-cadherin involvement in brain injury after SAH. The data here support the existence of a novel role of VE-cadherin: that its proteolytic fragments may shift microglia towards a proinflammatory phenotype, thereby contributing to neuroinflammation. This dual role of providing structural and signaling functions has also been reported for occludin, another tight junction protein,33 and other cell adhesion proteins.34–36 The involvement of a MyD88/NFκB pathway in microglia activation is consistent with previously reported pathways of microglia response to inflammation.37–39 The net effect of sVE-cadherin on neuroinflammation has yet to be determined; although microglia activation may amplify inflammation and injury, activated microglia promote clearance of extravasated red blood cells, a process that would ultimately decrease inflammation.40 Our data suggest that sVE-cadherin levels in the CSF compartment may not only serve as an indirect measure of BBB compromise; sVE-cadherin itself may activate microglia and shift them into a proinflammatory state and potentially contribute to SAH-associated brain injury (figure e-4, doi.org/10.5061/dryad.0622fk2).
We hypothesized that both blood (plasma) and CSF sVE-cadherin levels would be clinically relevant in SAH. However, our data did not detect a difference in blood, only in CSF. The fact that we did not detect significant between-group differences in sVE-cadherin levels in blood may be due to limited power. The presence of numerous other systemic conditions in this critically ill SAH cohort may confound their blood sVE-cadherin levels, since higher sVE-cadherin blood levels have been associated with systemic inflammation.8,10,11 Another possible reason for this lack of difference is that baseline sVE-cadherin levels are 10 times higher in blood than in CSF, making it difficult to detect a small difference between groups.
It is also important to explore the reasons why the data detected an association between CSF sVE-cadherin levels and outcome at 3 months (figure 1, D and E) but not at 6 months (figure e-1, doi.org/10.5061/dryad.0622fk2). Again, this is likely due to inadequate statistical power. Between 3- and 6-month follow-up, the functional status of several patients changed from poor to favorable outcome, and these changes may result from circumstances that are unrelated to the underlying biological processes—for instance, differences in home environment between patients. Two patients were lost to follow-up. This resulted in a decrease in the size of the poor outcome group from 21 patients at 3 months to 14 patients at 6 months (table 1), which limited the statistical power of our analysis for the 6-month outcome endpoint.
There are a few caveats that may suggest future directions to explore. First, our SAH cohort was restricted to higher clinical severity patients with anterior circulation aneurysms who have a clinical indication for EVD placement and did not develop infections (table 1). As patients with SAH with lower clinical severity grades (HH grades 1–2) often do not require an EVD, we do not have access to their CSF samples. This limitation selected for a more severe SAH cohort. The large majority of this study cohort had high modified Fisher grade 3 or 4 (76% of the total cohort had modified Fisher grade 3 and 19% of the total cohort had modified Fisher grade 4 SAH). Due to the limitations listed here, results from this study may not be generalizable to patients with SAH with lower severity or with posterior circulation aneurysms with or without concomitant infections. Given the sample size of this study, the exploratory analyses performed here are all underpowered. Follow-up large sample size studies are needed to determine the association between CSF sVE-cadherin levels and relevant outcomes after SAH.
Another limitation of the study is that the control cohort, consisting of patients with suspected iNPH, were generally older compared to the SAH cohort (table 1) and may have not only underlying neurodegenerative disorders41 but additional systemic pathologies that might distort the results. Moreover, iNPH involves a different underlying pathophysiology that might affect the results in another direction. In addition, it was not possible to determine the precise origin of sVE-cadherin in our CSF samples in this SAH cohort: whether from extravasated blood during aneurysmal rupture,42 from brain endothelium through BBB breakdown, or a combination of both. Finally, we only assessed microglia because these are the key cells for neuroinflammation.19,20 Future studies including the use of in vivo rodent models are warranted to study the role of sVE-cadherin in all cells of the neurovascular unit and determine the network of upstream proteases and downstream effectors in SAH pathophysiology.
This reverse-translation study provides proof-of-concept of a novel pathway whereby sVE-cadherin is released from endothelium after SAH and shifts microglia towards a more proinflammatory phenotype. This finding adds to the expanding knowledge of endothelial signaling that affects brain function43 and should provide insight and opportunities for developing new therapeutic approaches for this devastating CNS disorder.
Acknowledgment
The authors thank the Clinical Research, Investigation, and Systems Modeling of Acute illness (CRISMA) Center for support in biobanking and biomarker analyses.
Glossary
- ANOVA
analysis of variance
- BBB
blood-brain barrier
- EVD
external ventricular drain
- HBMEC
human brain microvascular endothelial cells
- HH
Hunt and Hess
- IACUC
Institutional Animal Care and Use Committee
- IL
interleukin
- iNOS
inducible nitric oxide synthase
- iNPH
idiopathic normal-pressure hydrocephalus
- IP
immunoprecipitation
- LDH
lactate dehydrogenase
- mRS
modified Rankin Scale
- PBS
phosphate-buffered saline
- ROS
reactive oxygen species
- SAH
subarachnoid hemorrhage
- sVE
soluble vascular endothelial
- TNF
tumor necrosis factor
- VE
vascular endothelial
Footnotes
CME Course: NPub.org/cmelist
Author contributions
J.L., H.T., S.H.-Y.C., and E.H.L. designed various aspects of the study. J.L., H.T., S.H.-Y.C., E.H.L., K.A., X.W., M.M.N., K.H., and C.X. contributed to experimental protocols. S.H.-Y.C., J.W.L., and L.H. designed/implemented human cohort data and sample acquisition, phenotyping, clinical endpoint assignments, and outcome assessments. J.L. and H.T. constructed the protocol for preparation of sVE-cadherin, adding to the method described in Flemming et al.8 H.T. performed all in vitro and in vivo experiments and most biochemical measurements of human cohort samples. G.H. isolated primary microglia and grew them in culture. M.R.I. cultured endothelial cells. R.O. and J.M. performed Western blots. G.H. and E.R.-B. analyzed immunofluorescence images. J.L., H.T., S.H.-Y.C., and E.H.L. analyzed data, interpreted results, and wrote the manuscript.
Study funding
This work was supported in part by NIH/NINDS R01NS091573 (J.L.), K23NS73806 (S.H.-Y.C.), R21NS113037-01 (S.H.-Y.C.), R01NS065089 (K.A.), 5R01NS093415 (M.M.N.), and R01NS099620 (K.H.), University of Pittsburgh Faculty of Medicine Dean's Faculty Advancement Award (S.H.-Y.C.), University of Pittsburgh Physicians/UPMC Academic Foundation Award (S.H.-Y.C.), Rappaport Foundation (E.H.L.), Japan Society for the Promotion of Science “KAKENHI” (18K16566) (H.T.), Research Abroad from the Japan Brain Foundation (H.T.), Mochida Memorial Foundation for Medical and Pharmaceutical Research (H.T.), and the Rotary Foundation Global Scholarship Grants (GG1759314, GG1876795) (H.T.). This work was conducted with support from the Biostatistics Service of Harvard Catalyst, The Harvard Clinical and Translational Science Center (National Center for Advancing Translational Sciences, NIH award UL 1TR002541) and financial contributions from Harvard University and its affiliated academic health care centers. The content is solely the responsibility of the authors and does not necessarily represent the official views of Harvard Catalyst, Harvard University and its affiliated academic health care centers, or the NIH.
Disclosure
The authors report no disclosures relevant to the manuscript. Go to Neurology.org/N for full disclosures.
References
- 1.Gotsch U, Borges E, Bosse R, et al. VE-cadherin antibody accelerates neutrophil recruitment in vivo. J Cell Sci 1997;110:583–588. [DOI] [PubMed] [Google Scholar]
- 2.Carmeliet P, Lampugnani MG, Moons L, et al. Targeted deficiency or cytosolic truncation of the VE-cadherin gene in mice impairs VEGF-mediated endothelial survival and angiogenesis. Cell 1999;98:147–157. [DOI] [PubMed] [Google Scholar]
- 3.Corada M, Mariotti M, Thurston G, et al. Vascular endothelial-cadherin is an important determinant of microvascular integrity in vivo. Proc Natl Acad Sci USA 1999;96:9815–9820. [DOI] [PMC free article] [PubMed] [Google Scholar]
- 4.Yuan SY, Rigor RR. Regulation of Endothelial Barrier Function. San Rafael: Morgan & Claypool Life Sciences; 2010. [PubMed] [Google Scholar]
- 5.Li H, Shi X, Liu J, et al. The soluble fragment of VE-cadherin inhibits angiogenesis by reducing endothelial cell proliferation and tube capillary formation. Cancer Gene Ther 2010;17:700–707. [DOI] [PubMed] [Google Scholar]
- 6.Dejana E, Orsenigo F. Endothelial adherens junctions at a glance. J Cell Sci 2013;126:2545–2549. [DOI] [PubMed] [Google Scholar]
- 7.Schulz B, Pruessmeyer J, Maretzky T, et al. ADAM10 regulates endothelial permeability and T-cell transmigration by proteolysis of vascular endothelial cadherin. Circ Res 2008;102:1192–1201. [DOI] [PMC free article] [PubMed] [Google Scholar]
- 8.Flemming S, Burkard N, Renschler M, et al. Soluble VE-cadherin is involved in endothelial barrier breakdown in systemic inflammation and sepsis. Cardiovasc Res 2015;107:32–44. [DOI] [PubMed] [Google Scholar]
- 9.Rochefort P, Chabaud S, Pierga JY, et al. Soluble VE-cadherin in metastatic breast cancer: an independent prognostic factor for both progression-free survival and overall survival. Br J Cancer 2017;116:356–361. [DOI] [PMC free article] [PubMed] [Google Scholar]
- 10.Soeki T, Tamura Y, Shinohara H, Sakabe K, Onose Y, Fukuda N. Elevated concentration of soluble vascular endothelial cadherin is associated with coronary atherosclerosis. Circ J 2004;68:1–5. [DOI] [PubMed] [Google Scholar]
- 11.Zhang RY, Liu YY, Li L, et al. Increased levels of soluble vascular endothelial cadherin are associated with poor outcome in severe sepsis. J Int Med Res 2010;38:1497–1506. [DOI] [PubMed] [Google Scholar]
- 12.Wrobel T, Mazur G, Wolowiec D, Jazwiec B, Sowinska E, Kuliczkowski K. sVE-cadherin and sCD146 serum levels in patients with multiple myeloma. Clin Lab Haematol 2006;28:36–39. [DOI] [PubMed] [Google Scholar]
- 13.Sulkowska M, Famulski W, Wincewicz A, et al. Levels of VE-cadherin increase independently of VEGF in preoperative sera of patients with colorectal cancer. Tumori 2006;92:67–71. [DOI] [PubMed] [Google Scholar]
- 14.Chen T, Guo ZP, Cao N, Qin S, Li MM, Jia RZ. Increased serum levels of soluble vascular endothelial-cadherin in patients with systemic vasculitis. Rheumatol Int 2014;34:1139–1143. [DOI] [PubMed] [Google Scholar]
- 15.Miller BA, Turan N, Chau M, Pradilla G. Inflammation, vasospasm, and brain injury after subarachnoid hemorrhage. Biomed Res Int 2014;2014:384342. [DOI] [PMC free article] [PubMed] [Google Scholar]
- 16.Cahill J, Zhang JH. Subarachnoid hemorrhage: is it time for a new direction? Stroke 2009;40:S86–S87. [DOI] [PMC free article] [PubMed] [Google Scholar]
- 17.Chou SH, Feske SK, Atherton J, et al. Early elevation of serum tumor necrosis factor-alpha is associated with poor outcome in subarachnoid hemorrhage. J Investig Med 2012;60:1054–1058. [DOI] [PMC free article] [PubMed] [Google Scholar]
- 18.Chou SH, Feske SK, Simmons SL, et al. Elevated peripheral neutrophils and matrix metalloproteinase 9 as biomarkers of functional outcome following subarachnoid hemorrhage. Transl Stroke Res 2011;2:600–607. [DOI] [PMC free article] [PubMed] [Google Scholar]
- 19.Yenari MA, Kauppinen TM, Swanson RA. Microglial activation in stroke: therapeutic targets. Neurotherapeutics 2010;7:378–391. [DOI] [PMC free article] [PubMed] [Google Scholar]
- 20.Giulian D. Ameboid microglia as effectors of inflammation in the central nervous system. J Neurosci Res 1987;18:155–171;132–153. [DOI] [PubMed] [Google Scholar]
- 21.Schievink WI, Wijdicks EF, Piepgras DG, Chu CP, O'Fallon WM, Whisnant JP. The poor prognosis of ruptured intracranial aneurysms of the posterior circulation. J Neurosurg 1995;82:791–795. [DOI] [PubMed] [Google Scholar]
- 22.Relkin N, Marmarou A, Klinge P, Bergsneider M, Black PM. Diagnosing idiopathic normal-pressure hydrocephalus. Neurosurgery 2005;57:S4–S16; discussion ii–v. [DOI] [PubMed] [Google Scholar]
- 23.Hunt WE, Hess RM. Surgical risk as related to time of intervention in the repair of intracranial aneurysms. J Neurosurg 1968;28:14–20. [DOI] [PubMed] [Google Scholar]
- 24.Connolly ES Jr, Rabinstein AA, Carhuapoma JR, et al. Guidelines for the management of aneurysmal subarachnoid hemorrhage: a guideline for healthcare professionals from the American Heart Association/American Stroke Association. Stroke 2012;43:1711–1737. [DOI] [PubMed] [Google Scholar]
- 25.Satpute SK, Banpurkar AG, Dhakephalkar PK, Banat IM, Chopade BA. Methods for investigating biosurfactants and bioemulsifiers: a review. Crit Rev Biotechnol 2010;30:127–144. [DOI] [PubMed] [Google Scholar]
- 26.Arai K, Lo EH. An oligovascular niche: cerebral endothelial cells promote the survival and proliferation of oligodendrocyte precursor cells. J Neurosci 2009;29:4351–4355. [DOI] [PMC free article] [PubMed] [Google Scholar]
- 27.Lin L, Desai R, Wang X, Lo EH, Xing C. Characteristics of primary rat microglia isolated from mixed cultures using two different methods. J Neuroinflammation 2017;14:101. [DOI] [PMC free article] [PubMed] [Google Scholar]
- 28.Takase H, Kurihara Y, Yokoyama TA, Kawahara N, Takei K. LOTUS overexpression accelerates neuronal plasticity after focal brain ischemia in mice. PLoS One 2017;12:e0184258. [DOI] [PMC free article] [PubMed] [Google Scholar]
- 29.Hoenen C, Gustin A, Birck C, et al. Alpha-synuclein proteins promote pro-inflammatory cascades in microglia: stronger effects of the A53T mutant. PLoS One 2016;11:e0162717. [DOI] [PMC free article] [PubMed] [Google Scholar]
- 30.Fujii M, Yan J, Rolland WB, Soejima Y, Caner B, Zhang JH. Early brain injury, an evolving frontier in subarachnoid hemorrhage research. Transl Stroke Res 2013;4:432–446. [DOI] [PMC free article] [PubMed] [Google Scholar]
- 31.de Oliveira Manoel AL, Macdonald RL. Neuroinflammation as a target for intervention in subarachnoid hemorrhage. Front Neurol 2018;9:292. [DOI] [PMC free article] [PubMed] [Google Scholar]
- 32.Yin D, Zhou S, Xu X, et al. Dexmedetomidine attenuated early brain injury in rats with subarachnoid haemorrhage by suppressing the inflammatory response: the TLR4/NF-kappaB pathway and the NLRP3 inflammasome may be involved in the mechanism. Brain Res 2018;1698:1–10. [DOI] [PubMed] [Google Scholar]
- 33.McCaffrey G, Davis TP. Physiology and pathophysiology of the blood-brain barrier: P-glycoprotein and occludin trafficking as therapeutic targets to optimize central nervous system drug delivery. J Investig Med 2012;60:1131–1140. [DOI] [PMC free article] [PubMed] [Google Scholar]
- 34.Tang MKS, Yue PYK, Ip PP, et al. Soluble E-cadherin promotes tumor angiogenesis and localizes to exosome surface. Nat Commun 2018;9:2270. [DOI] [PMC free article] [PubMed] [Google Scholar]
- 35.Roonprapunt C, Huang W, Grill R, et al. Soluble cell adhesion molecule L1-Fc promotes locomotor recovery in rats after spinal cord injury. J Neurotrauma 2003;20:871–882. [DOI] [PubMed] [Google Scholar]
- 36.Doherty P, Williams E, Walsh FS. A soluble chimeric form of the L1 glycoprotein stimulates neurite outgrowth. Neuron 1995;14:57–66. [DOI] [PubMed] [Google Scholar]
- 37.Zhao X, Zhang Y, Strong R, Zhang J, Grotta JC, Aronowski J. Distinct patterns of intracerebral hemorrhage-induced alterations in NF-kappaB subunit, iNOS, and COX-2 expression. J Neurochem 2007;101:652–663. [DOI] [PubMed] [Google Scholar]
- 38.Lu Y, Zhang XS, Zhang ZH, et al. Peroxiredoxin 2 activates microglia by interacting with Toll-like receptor 4 after subarachnoid hemorrhage. J Neuroinflammation 2018;15:87. [DOI] [PMC free article] [PubMed] [Google Scholar]
- 39.Conant K, Daniele S, Bozzelli PL, et al. Matrix metalloproteinase activity stimulates N-cadherin shedding and the soluble N-cadherin ectodomain promotes classical microglial activation. J Neuroinflammation 2017;14:56. [DOI] [PMC free article] [PubMed] [Google Scholar]
- 40.Zhao X, Grotta J, Gonzales N, Aronowski J. Hematoma resolution as a therapeutic target: the role of microglia/macrophages. Stroke 2009;40:S92–S94. [DOI] [PubMed] [Google Scholar]
- 41.Jaraj D, Rabiei K, Marlow T, Jensen C, Skoog I, Wikkelsø C. Prevalence of idiopathic normal-pressure hydrocephalus. Neurology 2014;82:1449–1454. [DOI] [PMC free article] [PubMed] [Google Scholar]
- 42.Rosengart AJ, Schultheiss KE, Tolentino J, Macdonald RL. Prognostic factors for outcome in patients with aneurysmal subarachnoid hemorrhage. Stroke 2007;38:2315–2321. [DOI] [PubMed] [Google Scholar]
- 43.Couch Y, Akbar N, Roodselaar J, et al. Circulating endothelial cell-derived extracellular vesicles mediate the acute phase response and sickness behaviour associated with CNS inflammation. Sci Rep 2017;7:9574. [DOI] [PMC free article] [PubMed] [Google Scholar]
Associated Data
This section collects any data citations, data availability statements, or supplementary materials included in this article.
Data Availability Statement
Derived data supporting the findings of this study are available from the corresponding author upon request.


