Abstract
Digital twin technology consists of creating virtual replicas of objects or processes that simulate the behavior of their real counterparts. The objective is to analyze its effectiveness or behavior in certain cases to improve its effectiveness. Applied to products, machines and even complete business ecosystems, the digital twin model can reveal information from the past, optimize the present and even predict the future performance of the different areas analyzed. In the context of supply chains, digital twins are changing the way they do business, providing a range of options to facilitate collaborative environments and data-based decision making and making business processes more robust. This paper proposes the design and development of a digital twin for a case study of a pharmaceutical company. The technology used is based on simulators, solvers and data analytic tools that allow these functions to be connected in an integral interface for the company.
Keywords: Digital twins, Supply chain, Simulation, Analytics, Business intelligence
Introduction
Due to the overcrowding and in some cases to the specialization of consumer preferences in commercial environments, operations along supply chains are becoming increasingly complex. Considering that the launch of a customer order begins the cycle of activities of a supply chain, from the production, distribution and handling of the product along it, an increasingly difficult factor to control is the visibility of the product and the transparency of the entire process. Typically, supply chains have subdivided their operations depending on the stage they are in. Each stage of the process plans, executes and corrects its operations based on a particular vision of the stage of the supply chain in which they are. These solutions have a local and non-global approach to the process. It is important to remember that a decision made with a local approach can be inefficient from an integral point of view. Historically, the solution to the aforementioned problems has been the application of enterprise resource planning (ERP) systems see [1, 2]. Within the company, ERP systems are the traditional means of sharing and transferring data and information across all links in the supply chain. The objective is to coordinate the activities within the company. This objective is achieved through the sharing of data and information between departments and business areas. However, many limitations of ERP systems have been reported, including the lack of a real-time response to the dynamics of changes in orders, inventories and eventualities due to supply chain disruptions.Some other disadvantages of ERP systems are: security risks, lack of integrated tools for decision making, for example, prediction, optimization, simulation, data analytics. In essence, integration problems with other systems and ERP software modifications are major disadvantages to consider see [15, 53]. General electric [17], one of the pioneers in the development of technological solutions in the world, mentions that a Digital twins are software representations of assets and processes that are used to understand, predict, and optimize performance in order to achieve improved business outcomes. Digital twins consist of three components: a data model, a set of analytics or algorithms, and knowledge. Considering the classic concept of digital twin and the lack of comprehensive and robust solutions along a supply chain, it is possible to naturally conceive the concept of digital twin in supply chains. The design of a digital twin with the organizations that are part of a supply chain facilitates the activities of monitoring and digital control of operations in all links of the system. There are many advantages of the design of a digital twin, since it captures all the insights and operational and financial information of the system, as well as the configuration of the devices, order status and production orders. The benefits are obtained by being able to anticipate the next operations and possible disruptions of the system. For the reasons outlined above, it is clear to glimpse the imminent development of digital twins in supply chain contexts. The manuscript is organized as follows. Section 2 illustrates the literature review and research background. Section 3 introduces the methodology. Section 4 presents the digital twin functionalities and the interface. Section 5 shows how the case study for a pharmaceutical enterprise is. Section 6 discusses the paper results. Finally, Section 7 summarizes the conclusions and sets the goals for future developments.
Literature review
Typically, supply chains have been widely explored. The optimization of its activities, the forecast of sales, the prediction of failures in its links and the proposal of coordination mechanisms are some examples [28]. Nowadays, some trend issues arise, especially those of supply chain digitalization [9, 14, 44]. In [41], the authors present a current study of the Digitally Dominant Paradigm framework that can be applied to operations within the supply chain. Although it is not a new paradigm, it is a paradigm that is becoming stronger in the logistics environment. Addressing this need, the digital twin concept of the supply chain is not yet a standard. The basic concepts and functions that the design of these must have are known, but the development of applications has been scarce. Some examples can be found in [7, 24, 25, 29, 30, 38, 40]. Powered by a combination of artificial intelligence (data mining, deep learning, and analytics), digital twins can mirror a physical twin and reveal issues before they occur, they rely on a range of sensors embedded in the physical world to transfer real-time data about the operative process and environment. The data collected from the connected sensors are then analyzed on the cloud and is accessible via a dashboard Internet. Regarding the different industries, the pharmaceutical industry is an industry with special characteristics. Pharmaceutical supply chains have typically invested greater efforts to ensure excellence in their operations. The drug distribution process includes transportation from factories to a central warehouse and depending on the supply chain, intermediate distribution centers can be used before delivery to health facilities. In [47] it is mentioned that a well-designed medicine supply system ensures that procurement, storage and transportation are perfectly linked to design a network that can deliver the requested medicines to health centers on time, in the correct quantities and at the lowest
possible cost. In these distribution systems [11, 46], it is intended to ensure that the quality of distributed medicines is preserved, as well as to execute reliable storage and rapid transportation to retailers and customers. Some authors have developed process chains using digital twins but not a supply chain digital twin. The difference lies in the way in which the results obtained in each process are interconnected. These authors claim that their processes are continuously monitored throughout their proposed development. According to the analyzed document, the cases of pioneering companies in the digitization development of their supply chains are presented: BMW and 3M, see [4] and [6]. The 3M company has as a future goal to develop a digital twin of its supply chain, for this it is working to migrate from its traditional ERP to a scheme that allows optimizing, visualizing and controlling all its processes. Furthermore, BMW has made efforts to create a supply chain of its entire factory with millimeter precision. In this way they ensure that the performance of it can be optimized [8]. In this document, the authors mention that the Internet of Things has catalyzed the traceability of products in a supply chain. Software AG’s ARIS is proposed as an alternative to create the digital twin of a supply chain [39]. The first developments of digital twins in manufacturing contexts are given in intelligent manufacturing and to date its evolution is still booming [10] and [18]. In [19–21] the author gives some guidelines for the future of digital twins in ERP systems, as well as the future work that remains to be done. The opportunities are diverse and complex. New developments can contribute to demand management, product traceability, and business relationships with customers. The authors of [31, 32, 34] mentions the benefits of designing a digital twin. Among these benefits are all the end-to-end decisions in the processes of a company. The author reflects on the ability to separate the analysis and planning processes. The functional areas of the company that are considered are production, maintenance, marketing and distribution, all of which are considering the management strategy. In [43, 45, 49–52] the authors agree that the digitization of the supply chain will take place in the next 20 years. However, these changes will gradually take place. Stark [42] it is said that the development of digital twins was carried out by NASA, who monitored the performance of a satellite and anticipated changes using simulators. The author mentions that this technology is recent and that it is only the beginning of technological developments. Two applications for a digital twin are described. The use of the digital twin by itself, without considering a physical product or service and the use of a digital twin in co-ownership with the product or service. The first development of a digital twin was carried out in the context of manufacturing, so the design of these twins in the supply chain is still poorly developed. In [27] The study shows signs of how to use digital twins in the supply chain, considering the management and administration of information. Big data is presented as an alternative to manage the supply chain. They used an analogy with the power split device for hybrid vehicles, like the Toyota Prius; This car can use a full gasoline engine or a full electric motor or use both types of energy. In [3, 16, 23, 26, 48] is stated that a digital twin of the supply chain can monitor the transport, inventory, demand and other functions of the company. All this in real time, allowing decisions to be made on time. It would also be possible to use the simulation of events that have not yet happened, allowing us to anticipate the future. This paper ensures that everything said is only theories and it is necessary to analyze developments in the supply chain.
Design and development of supply chain digital twin
Due a digital twin is a dynamic virtual representation of a physical object or system, we can define a supply chain digital twin as a detailed simulation model of an actual supply chain which predicts the behavior and dynamics of a supply chain to make mid-term/short-term decisions [37]. Today, the development and implementation of digital twins in the supply chain is not done in a standard way. There is no single technological platform capable of performing all the activities of a digital twin. However, some computer tools have begun to strengthen the functionality of their services offered, see SAP [35] and anylogistix [38]. For other applications you can see Veracity by DNV GL. It is built in Microsoft Azure, which ensures reliable data management in the cloud. [13]. Other developments are, MindSphere by Siemens [36] who is able to connect all your equipment and systems, extract their data and convert them into valuable information for the company. One of the most robust digital twin developments is Open Simulation Platform (OSP) [12].Created by a joint effort between Det Norske Veritas Germanischer Lloyd Group (DNV GL), Norwegian University of Science and Technology (NTNU), Rolls-Royce and SINTEF Ocean.
Design
However, although there is no single design and development scheme for digital twins in the supply chain, in this work, we rely on the six-layer architecture for digital twins proposed by [33]. This architecture considers the neutral vision and the specific needs of the stakeholders. Each of the layers of the proposed digital twin is detailed below.
The physical twin
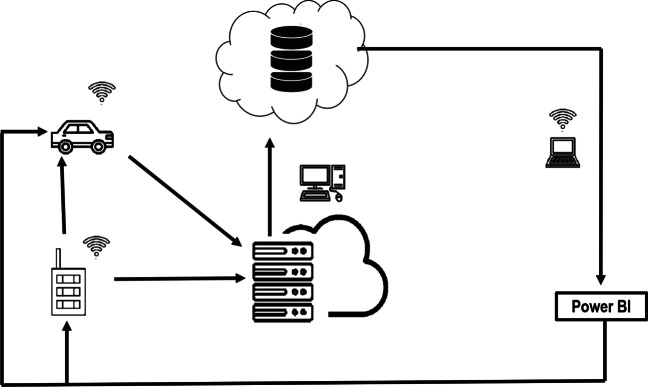
The use of inventory measurement devices under RFID environments consisting of labels that can be attached to any product. RFID technology is mainly based on the interaction of 2 fundamental elements: the TAG and a reader. The tag contains an antenna that allows the device to connect to the system and a microchip that accumulates information. When the RFID tag receives energy obtained by the reading antennas, the chip uses this energy as a power source and activates all its internal circuits.
The local data source
The data collected is uploaded by professionals through spreadsheets or other databases. Every day the costs of new computing technologies are lower, which facilitates investment in devices that provide the necessary data to start the process. The use of an internal database is recommended, which joins the information of the cyber-devices. This reduces dependency and simplifies support.
Local data repositories
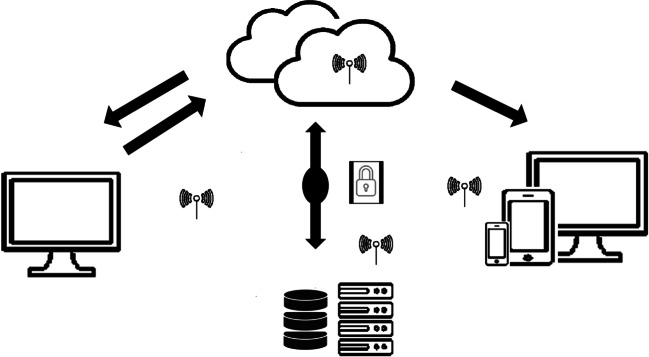
The use of local databases (simple spreadsheets hosted in each area or department involved in the digital twin). There are mainly two types of storage, local storage and cloud storage. The first has the disadvantage of not being able to have our data available anywhere, only in the network, as well as security and physical damage issues, although it has an average cost. By contrast cloud storage offers us the possibility of having devices synchronized anywhere, high configurability and greater security in data exchange. It has a relatively high cost since we must have a backup, it requires a high-speed connection (preferably fiber optics) and maintenance of all hardware. The disadvantage is that it requires us to be aware that the service is working correctly since several factors may fail that may make it impossible for us to work.
The IoT gateway interfaces
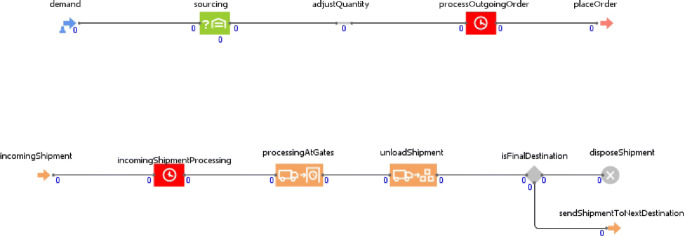
The IoT gateway is a crucial technology that enables electronic devices to communicate and share data, data that can be analyzed and transformed into valuable information that enables the optimization of operating processes for the industries involved. Provide data to business systems (ERP or Digital Twins) for a more detailed analysis. Given the nature of the digital twin design, in our case, the anylogistix (ALX) platform does not need the development of an IoT interface to make the data obtained in simple spreadsheets compatible.
The Cloud-based information repositories
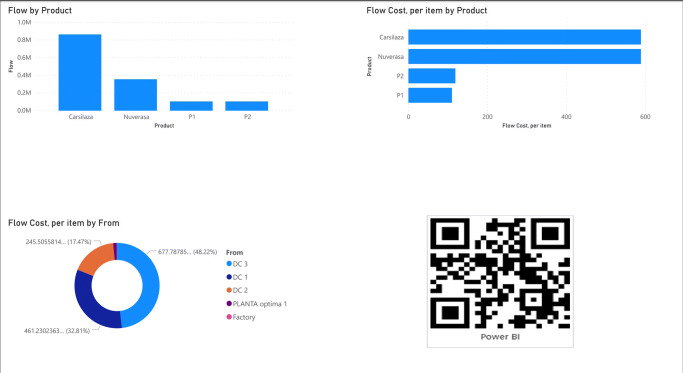
The AnyLogic Private Cloud [5] is a secure platform for hosting simulation models in your data center or at a cloud platform provider. It is natively supported by ALX.
The emulation and simulation platform
A powerful and flexible simulation tool is the key to developing a digital twin in the supply chain. It is recommended to use modeling tools that are multi-method in nature. This will allow the use of a smaller number of software in the design of the digital twin. Selecting a multi-method simulation software is the best way to achieve an efficient and more robust digital twin. The optimization and simulation capabilities of ALX enable you to create plans with network optimization and use simulation modeling to test and develop them. Optimization and simulation combine to extend your supply chain analytics (Figs. 1, 2, 3 and 4).
Fig. 1.

RFID tag
Fig. 2.

Data storage devices
Fig. 3.
Iot gateway interface
Fig. 4.
Cloud repository
Development
As previously described, the study conduce the development and implementation of a digital twin of the supply chain through anylogistix software, which allows us to connect and exchange input and output information with other data interfaces. The main idea is to use the optimization and dynamic simulation core provided by the software. Some background design of digital twins in ALX is reported in [38] and [24]. A recent example for the analysis of risk in supply chains based on ALX technology can be consulted in [22], the case study is based on the current epidemic COVID-19. The author is a leading researcher in the development of supply chain risk measurements and digital twin design using ALX software.
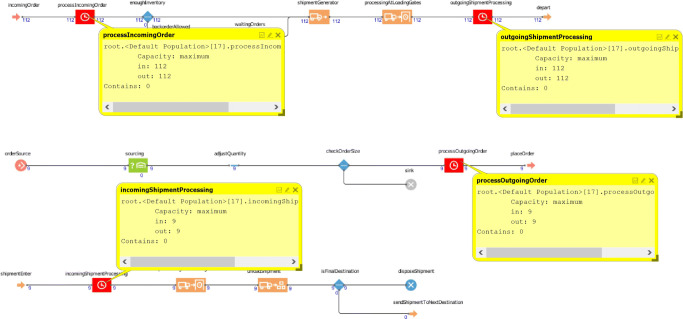
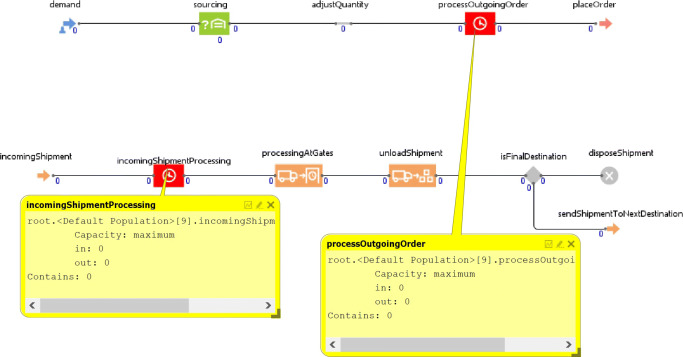
The proposed digital twin of this research is an operational digital twin, as it exchanges data between production, storage and distribution. Additionally, this twin monitors the overall performance of the system. Through this, production scheduling and resource allocations are made and it is possible to implement decision-making algorithms. For reference see the Figs. 5, 6 and 7. The main goal is that the user can interact with the digital twin to obtain information or adjust operating parameters.The digital twin’s decisions have a medium and short-term planning horizon.
Fig. 5.
Factory Animation
Fig. 6.
Distribution Center Animation
Fig. 7.
Customer Animation
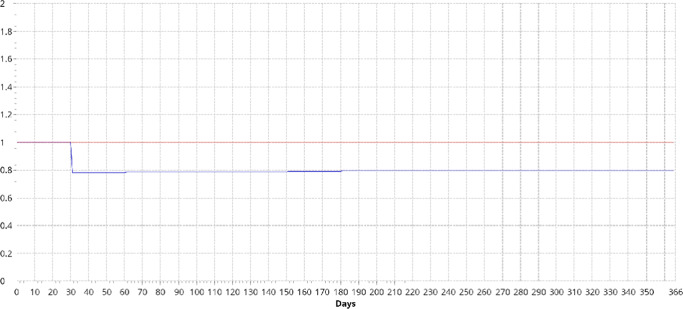
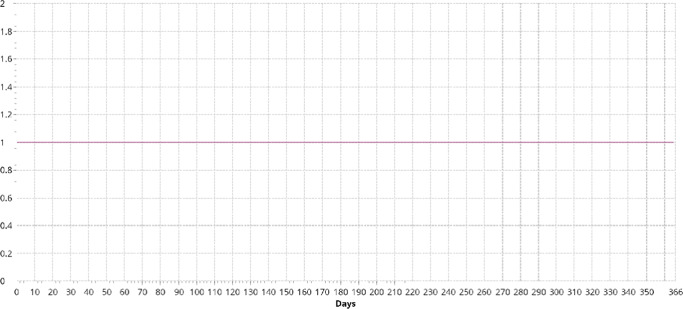
We have built into our solution machine learning and pattern recognition algorithms that can help to identify the changing trends in the supply chain, in demand and in operations. See Fig. 8.
Fig. 8.
Analytics-Power BI interface
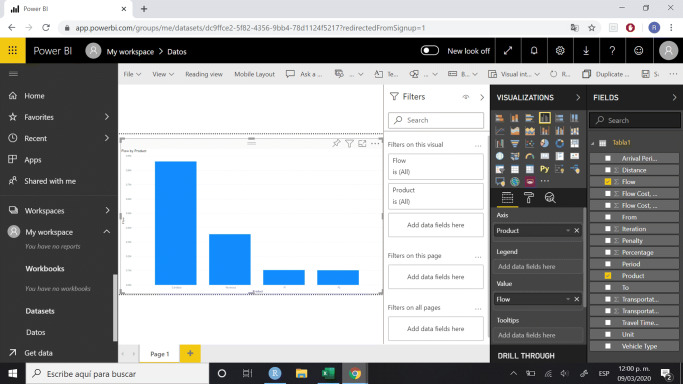
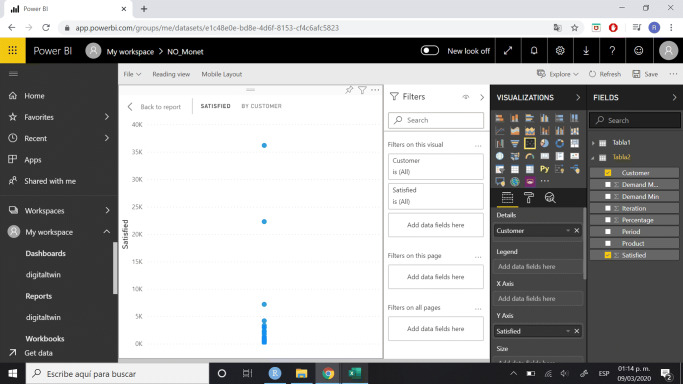
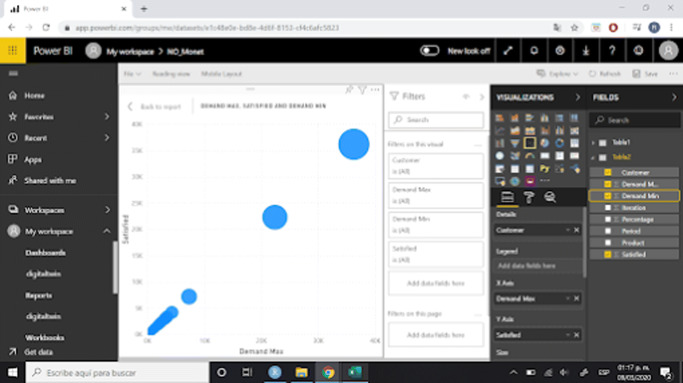
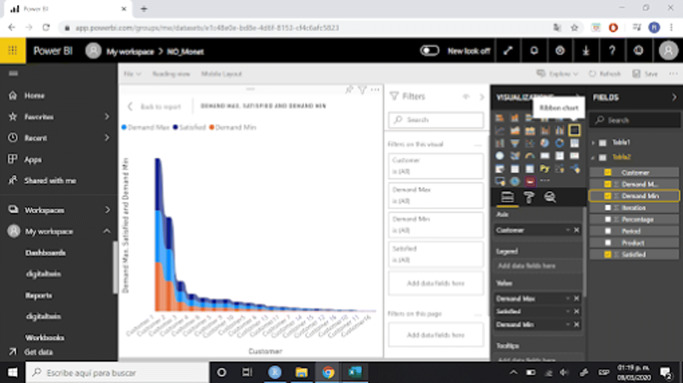
We know that if a company can look into the future and predict supply chain key performance indicators (KPI’s) it will understand what needs to be done in order to meet financial goals. Figures 9 and 10.
Fig. 9.
Analytics-Power BI interface
Fig. 10.
Analytics-Power BI interface
The simulation-optimization process generates the necessary information to make up the system’s KPIs. KPIs allow decision makers to quickly identify problems that arise in the supply chain, so that new plans can be created to resolve contingencies and get back on track in operation. It is known that if better planning is combined with better visibility and predictive analytics, the impact on supply chain performance will be beneficial. This can be accomplished with the use of the proposed digital twin. The digital twin can be implemented simultaneously with existing supply chain operations or phased in over several stages. Typically, digital twins can be introduced and developed step-by-step, facilitating implementation and maximizing their benefits.
The way in which the digital twin of the supply chain is designed allows considering different types of information between the links of the supply chain, as well as integrating it. This allows for a clearer and more faithful integration between all the parties involved. The digital twin proposal developed for a pharmaceutical supply chain is described below.
Digital twin proposal
The purpose of this work is to establish the methodological bases for the design and development of digital twins in the supply chain. Likewise, this proposal contributes to reducing the lack of case studies where these concepts are implemented, see [33].
The proposed digital twin includes several ready-to-go KPI’s complete with different options to show it (tables, charts, and graphs), including all the financial and operational KPIs and risk management measures.
One of the characteristics of the developed digital twin is that it can be customized by adding KPIs of interest to the user. The results reports can be modified to suit the needs of the interested party. A sensitivity analysis is available for users to simulate hypothetical scenarios and verify the resilience of the supply chain. This is accomplished using risk analysis and trigger related event tables.
By running simulations and what-if scenarios within the twin, professionals can save time and avoid risks before actual implementation.
A case study in the pharmaceutical industry
The case study addresses the supply chain of a company in the pharmaceutical industry. Decisions are required to locate new facilities for the production and distribution of injectable products. Likewise, various operating scenarios of the supply, manufacturing, inventory and product distribution process are modeled and analyzed. The proposal facilitates clear communication, predictive analytics that anticipates changes or disruptions in the supply chain and better collaboration between its stakeholders.Some of the data required to upload to the digital twin are: customer insight, demand data, business processes, inventory policies, productive capacity and location of available facilities.
The study horizon is one year divided into monthly periods, that is, the planning of the operation responds to monthly operations. However, when a trigger for a disruptive event is detected, the digital twin modifies the original planning, to simulate possible scenarios given current circumstances. The consequence of this simulation is to redefine the global operations strategy in the most resilient way.
Results
The initial operating conditions considered a Min-max (s, S) type inventory policy. With this policy the products are ordered when the inventory level falls below a fixed replenishment point (s). The ordered quantity is set to such a value that the resulting inventory quantity equals S.
The validation of the proposed digital twin considers the disruption of a distribution center, Figs. 11, 12, 13, 14, 15 and 16. After analyzing the behavior of the DT, it is seen in Figs. 17, 18 and 19 and the Table 1, that an RQ-type inventory policy is not efficient in the detected disruptive event. The RQ policy uses a fixed replenishment point / fixed replenishment quantity policy. When the inventory level falls below a fixed replenishment point (R), the fixed replenishment quantity (Q) of the products is ordered.
Fig. 11.
Factory Animation
Fig. 12.
Distribution Center Animation
Fig. 13.
Customer Animation
Fig. 14.
Analytics-Power BI interface
Fig. 15.
Analytics-Power BI interface
Fig. 16.
Analytics-Power BI interface
Fig. 17.
Average Inventory RQ-Policy
Fig. 18.
Lead Time RQ-Policy
Fig. 19.
Service Level by Product RQ-Policy
Table 1.
Key performance indicators RQ-policy
| Statistics name | Value |
|---|---|
| Available Inventory | 490756.5788 |
| Demand (Products Backlog) | 0 |
| Demand Placed (Products) by Customer | 1061896.722 |
| Demand Received (Products) | 2311896.722 |
| Fulfillment Received (Products) | 1250000 |
| Fulfillment Shipped (Orders) | 295 |
| Peak Capacity | 697649.8862 |
| Products Produced | 1400000 |
| Profit | 302839148.2 |
| Service Level by Products | 0.856244682 |
| Total Cost | 3017803.702 |
| Transportation Cost | 3017803.702 |
| Traveled Distance | 32887.90236 |
The lead-time and the level of service show that another strategy must be taken to mitigate the impact of the disruption.
Subsequently, the digital twin tests the different inventory policies and makes use of the “safety stock estimation” function included in ALX. Finally it is found that the best inventory strategy is Stock Security-Policy, see Figs. 20, 21 and 22. The service level recovers to 100% and the lead time falls within the requirements of the customers.
Fig. 20.
Average Inventory Stock Security-Policy
Fig. 21.
Lead Time Stock Security-Policy
Fig. 22.
Service Level by Product Stock Security-Policy
The KPIs for the strategy “Stock Security-Policy” are shown in Table 2. Table 3 shows the disruption of the distribution center and Tables 4, 5, 6 and ?? show the storage by product, the quantity produced, the demand fulfillment and the product flows in the network respectively.
Table 7.
Product flows
| Iteration | Period | From | To | Arrival period | Pro duct | Flow | Unit | Percen tage | Dis tance | Vehicle type | Travel time, day | Transpor tation cost, per item | Transpor tation cost, total | Flow cost, per item | Penalty | Flow cost, total |
|---|---|---|---|---|---|---|---|---|---|---|---|---|---|---|---|---|
| 1 | Basic period | Factory | DC 1 | Basic period | Carsilaza | 43824 | pcs | -1 | 11.7955874 | Default | 0.009829656 | 0.58977937 | 25846.49111 | 0.58977937 | 0 | 25846.49111 |
| 1 | Basic period | Factory | DC 1 | Basic period | P1 | 21113.25 | pcs | -1 | 11.7955874 | Default | 0.009829656 | 0.58977937 | 12452.15928 | 0.58977937 | 0 | 12452.15928 |
| 1 | Basic period | Factory | DC 3 | Basic period | P2 | 36447.75 | pcs | -1 | 13.49949156 | Default | 0.011249576 | 0.674974578 | 24601.30467 | 0.674974578 | 0 | 24601.30467 |
| 1 | Basic period | Factory | DC 3 | Basic period | P1 | 11815.5 | pcs | -1 | 13.49949156 | Default | 0.011249576 | 0.674974578 | 7975.162126 | 0.674974578 | 0 | 7975.162126 |
| 1 | Basic period | DC 1 | Customer 3 | Basic period | P2 | 4830 | pcs | -1 | 7.515551993 | Default | 0.00626296 | 0.3757776 | 1815.005806 | 0.3757776 | 0 | 1815.005806 |
| 1 | Basic period | DC 1 | Customer 3 | Basic period | P1 | 2415 | pcs | -1 | 7.515551993 | Default | 0.00626296 | 0.3757776 | 907.5029032 | 0.3757776 | 0 | 907.5029032 |
| 1 | Basic period | DC 1 | Customer 15 | Basic period | P2 | 603.75 | pcs | -1 | 259.288414 | Default | 0.216073678 | 12.9644207 | 7827.268997 | 12.9644207 | 0 | 7827.268997 |
| 1 | Basic period | DC 1 | Customer 15 | Basic period | P1 | 120.75 | pcs | -1 | 259.288414 | Default | 0.216073678 | 12.9644207 | 1565.453799 | 12.9644207 | 0 | 1565.453799 |
| 1 | Basic period | DC 1 | Customer 11 | Basic period | P2 | 1207.5 | pcs | -1 | 5.084606411 | Default | 0.004237172 | 0.254230321 | 306.983112 | 0.254230321 | 0 | 306.983112 |
| 1 | Basic period | DC 1 | Customer 11 | Basic period | P1 | 241.5 | pcs | -1 | 5.084606411 | Default | 0.004237172 | 0.254230321 | 61.39662241 | 0.254230321 | 0 | 61.39662241 |
| 1 | Basic period | DC 1 | Customer 1 | Basic period | P2 | 24150 | pcs | -1 | 11.34161298 | Default | 0.009451344 | 0.567080649 | 13694.99767 | 0.567080649 | 0 | 13694.99767 |
| 1 | Basic period | DC 1 | Customer 1 | Basic period | P1 | 12075 | pcs | -1 | 11.34161298 | Default | 0.009451344 | 0.567080649 | 6847.498835 | 0.567080649 | 0 | 6847.498835 |
| 1 | Basic period | DC 1 | Customer 5 | Basic period | P2 | 3018.75 | pcs | -1 | 114.1299363 | Default | 0.09510828 | 5.706496815 | 17226.48726 | 5.706496815 | 0 | 17226.48726 |
| 1 | Basic period | DC 1 | Customer 5 | Basic period | P1 | 2173.5 | pcs | -1 | 114.1299363 | Default | 0.09510828 | 5.706496815 | 12403.07083 | 5.706496815 | 0 | 12403.07083 |
| 1 | Basic period | DC 1 | Customer 6 | Basic period | P1 | 2.27374E-13 | pcs | -1 | 11.37809439 | Default | 0.009481745 | 0.56890472 | 1.29354E-13 | 0.56890472 | 0 | 1.29354E-13 |
| 1 | Basic period | DC 1 | Customer 12 | Basic period | P2 | 399 | pcs | -1 | 48.12937442 | Default | 0.040107812 | 2.406468721 | 960.1810197 | 2.406468721 | 0 | 960.1810197 |
| 1 | Basic period | DC 1 | Customer 12 | Basic period | P1 | 241.5 | pcs | -1 | 48.12937442 | Default | 0.040107812 | 2.406468721 | 581.1621961 | 2.406468721 | 0 | 581.1621961 |
| 1 | Basic period | DC 1 | Customer 8 | Basic period | P2 | 2415 | pcs | -1 | 108.5632991 | Default | 0.090469416 | 5.428164957 | 13109.01837 | 5.428164957 | 0 | 13109.01837 |
| 1 | Basic period | DC 1 | Customer 8 | Basic period | P1 | 966 | pcs | -1 | 108.5632991 | Default | 0.090469416 | 5.428164957 | 5243.607348 | 5.428164957 | 0 | 5243.607348 |
| 1 | Basic period | DC 1 | Customer 9 | Basic period | P2 | 1.36424E-12 | pcs | -1 | 205.3903711 | Default | 0.171158643 | 10.26951855 | 1.40101E-11 | 10.26951855 | 0 | 1.40101E-11 |
| 1 | Basic period | DC 3 | Customer 4 | Basic period | P2 | 2415 | pcs | -1 | 6.758604271 | Default | 0.00563217 | 0.337930214 | 816.1014657 | 0.337930214 | 0 | 816.1014657 |
| 1 | Basic period | DC 3 | Customer 4 | Basic period | P1 | 1811.25 | pcs | -1 | 6.758604271 | Default | 0.00563217 | 0.337930214 | 612.0760993 | 0.337930214 | 0 | 612.0760993 |
| 1 | Basic period | DC 3 | Customer 15 | Basic period | P2 | 1.1255E-11 | pcs | -1 | 261.3518656 | Default | 0.217793221 | 13.06759328 | 1.47076E-10 | 13.06759328 | 0 | 1.47076E-10 |
| 1 | Basic period | DC 3 | Customer 15 | Basic period | P1 | 5.88329E-12 | pcs | -1 | 261.3518656 | Default | 0.217793221 | 13.06759328 | 7.68805E-11 | 13.06759328 | 0 | 7.68805E-11 |
| 1 | Basic period | DC 3 | Customer 14 | P2 | 603.75 | pcs | -1 | 111.5174176 | Default | 0.092931181 | 5.575870882 | 3366.432045 | 5.575870882 | 0 | 3366.432045 | |
| 1 | Basic period | DC 3 | Customer 14 | Basic period | P1 | 241.5 | pcs | -1 | 111.5174176 | Default | 0.092931181 | 5.575870882 | 1346.572818 | 5.575870882 | 0 | 1346.572818 |
| 1 | Basic period | DC 3 | Customer 6 | Basic period | P2 | 1207.5 | pcs | -1 | 4.52030855 | Default | 0.003766924 | 0.226015428 | 272.9136287 | 0.226015428 | 0 | 272.9136287 |
| 1 | Basic period | DC 3 | Customer 6 | Basic period | P1 | 603.75 | pcs | -1 | 4.52030855 | Default | 0.003766924 | 0.226015428 | 136.4568144 | 0.226015428 | 0 | 136.4568144 |
| 1 | Basic period | DC 3 | Customer 13 | Basic period | P2 | 966 | pcs | -1 | 181.8272288 | Default | 0.151522691 | 9.091361438 | 8782.255149 | 9.091361438 | 0 | 8782.255149 |
| 1 | Basic period | DC 3 | Customer13 | Basic period | P1 | 362.25 | pcs | -1 | 181.8272288 | Default | 0.151522691 | 9.091361438 | 3293.345681 | 9.091361438 | 0 | 3293.345681 |
| 1 | Basic period | DC 3 | Customer 10 | Basic period | P2 | 2415 | pcs | -1 | 321.3115574 | Default | 0.267759631 | 16.06557787 | 38798.37055 | 16.06557787 | 0 | 38798.37055 |
| 1 | Basic period | DC 3 | Customer 10 | Basic period | P1 | 483 | pcs | -1 | 321.3115574 | Default | 0.267759631 | 16.06557787 | 7759.67411 | 16.06557787 | 0 | 7759.67411 |
| 1 | Basic period | DC 3 | Customer 2 | Basic period | P2 | 18112.5 | pcs | -1 | 26.42625304 | Default | 0.022021878 | 1.321312652 | 23932.27541 | 1.321312652 | 0 | 23932.27541 |
| 1 | Basic period | DC 3 | Customer 2 | Basic period | P1 | 4226.25 | pcs | -1 | 26.42625304 | Default | 0.022021878 | 1.321312652 | 5584.197596 | 1.321312652 | 0 | 5584.197596 |
| 1 | Basic period | DC 3 | Customer 16 | Basic period | P2 | 483 | pcs | -1 | 477.1686194 | Default | 0.397640516 | 23.85843097 | 11523.62216 | 23.85843097 | 0 | 11523.62216 |
| 1 | Basic period | DC 3 | Customer 16 | Basic period | P1 | 241.5 | pcs | -1 | 477.1686194 | Default | 0.397640516 | 23.85843097 | 5761.811079 | 23.85843097 | 0 | 5761.811079 |
| 1 | Basic period | DC 3 | Customer 9 | Basic period | P2 | 2415 | pcs | -1 | 199.3153625 | Default | 0.166096135 | 9.965768126 | 24067.33002 | 9.965768126 | 0 | 24067.33002 |
| 1 | Basic period | DC 3 | Customer 9 | Basic period | P1 | 603.75 | pcs | -1 | 199.3153625 | Default | 0.166096135 | 9.965768126 | 6016.832506 | 9.965768126 | 0 | 6016.832506 |
| 1 | Basic period | DC 3 | Customer 7 | Basic period | P2 | 630 | pcs | -1 | 5.669116045 | Default | 0.004724263 | 0.283455802 | 178.5771554 | 0.283455802 | 0 | 178.5771554 |
| 1 | Basic period | DC 3 | Customer7 | Basic period | P1 | 362.25 | pcs | -1 | 5.669116045 | Default | 0.004724263 | 0.283455802 | 102.6818644 | 0.283455802 | 0 | 102.6818644 |
Table 2.
Key Performance Indicators Stock Security-Policy
| Statistics name | Value |
|---|---|
| Available Inventory | 601911.9746 |
| Demand (Products Backlog) | 0 |
| Demand Placed (Products) by Customer | 1061896.722 |
| Demand Received (Products) | 2672793.445 |
| Fulfillment Received (Products) | 1610896.722 |
| Fulfillment Shipped (Orders) | 414 |
| Peak Capacity | 1098000 |
| Products Produced | 1663808.697 |
| Profit | 353875262.2 |
| Service Level by Products | 1 |
| Total Cost | 5410345.103 |
| Transportation Cost | 5410345.103 |
| Traveled Distance | 58631.65997 |
Table 3.
Site State after Network Optimization
| Iteration | Period | Site | Initial State | New State | Initial Cost | Closing Cost |
|---|---|---|---|---|---|---|
| 1 | Basic period | DC 2 | Open | Closed | 0 | 0 |
Table 4.
Storage by product
| Iteration | Period | Facility | Product | In Flow | Storage | Percentage | Out Flow | Storage Min | Storage Max |
|---|---|---|---|---|---|---|---|---|---|
| 1 | Basic period | DC 3 | P1 | 11815.5 | 2880 | 80 | 8935.5 | 2880 | 3600 |
| 1 | Basic period | DC 3 | P2 | 36447.75 | 7200 | 71.42857143 | 29247.75 | 7200 | 10080 |
| 1 | Basic period | DC 1 | P1 | 21113.25 | 2880 | 80 | 18233.25 | 2880 | 3600 |
| 1 | Basic period | DC 1 | P2 | 43824 | 7200 | 71.42857143 | 36624 | 7200 | 10080 |
| 1 | Basic period | Factory | P1 | 0 | 2880 | 80 | 32928.75 | 2880 | 3600 |
| 1 | Basic period | Factory | P2 | 0 | 7200 | 71.42857143 | 80271.75 | 7200 | 10080 |
Table 5.
Production flows
| Iteration | Period | Facility | BOM | Product | Consumed | Produced |
|---|---|---|---|---|---|---|
| 1 | Basic period | Factory | P1 | 0 | 35808.75 | |
| 1 | Basic period | Factory | P2 | 0 | 87471.75 |
Table 6.
Demand fulfillment
| Iteration | Period | Customer | Product | Demand Min | Demand Max | Satisfied | Percentage |
|---|---|---|---|---|---|---|---|
| 1 | Basic period | Customer 3 | P1 | 2300 | 2415 | 2415 | 100 |
| 1 | Basic period | Customer 3 | P2 | 4600 | 4830 | 4830 | 100 |
| 1 | Basic period | Customer 4 | P1 | 1725 | 1811.25 | 1811.25 | 100 |
| 1 | Basic period | Customer 4 | P2 | 2300 | 2415 | 2415 | 100 |
| 1 | Basic period | Customer 15 | P1 | 115 | 120.75 | 120.75 | 100 |
| 1 | Basic period | Customer 15 | P2 | 575 | 603.75 | 603.75 | 100 |
| 1 | Basic period | Customer 14 | P1 | 230 | 241.5 | 241.5 | 100 |
| 1 | Basic period | Customer 14 | P2 | 575 | 603.75 | 603.75 | 100 |
| 1 | Basic period | Customer 11 | P1 | 230 | 241.5 | 241.5 | 100 |
| 1 | Basic period | Customer11 | P2 | 1150 | 1207.5 | 1207.5 | 100 |
| 1 | Basic period | Customer 1 | P1 | 11500 | 12075 | 12075 | 100 |
| 1 | Basic period | Customer 1 | P2 | 23000 | 24150 | 24150 | 100 |
| 1 | Basic period | Customer5 | P1 | 2070 | 2173.5 | 2173.5 | 100 |
| 1 | Basic period | Customer 5 | P2 | 2875 | 3018.75 | 3018.75 | 100 |
| 1 | Basic period | Customer 6 | P1 | 575 | 603.75 | 603.75 | 100 |
| 1 | Basic period | Customer 6 | P2 | 1150 | 1207.5 | 1207.5 | 100 |
| 1 | Basic period | Customer 12 | P1 | 230 | 241.5 | 241.5 | 100 |
| 1 | Basic period | Customer 12 | P2 | 380 | 399 | 399 | 100 |
| 1 | Basic period | Customer 13 | P1 | 345 | 362.25 | 362.25 | 100 |
| 1 | Basic period | Customer 13 | P2 | 920 | 966 | 966 | 100 |
| 1 | Basic period | Customer10 | P1 | 460 | 483 | 483 | 100 |
| 1 | Basic period | Customer 10 | P2 | 2300 | 2415 | 2415 | 100 |
| 1 | Basic period | Customer 2 | P1 | 4025 | 4226.25 | 4226.25 | 100 |
| 1 | Basic period | Customer 2 | P2 | 17250 | 18112.5 | 18112.5 | 100 |
| 1 | Basic period | Customer16 | P1 | 230 | 241.5 | 241.5 | 100 |
| 1 | Basic period | Customer 16 | P2 | 460 | 483 | 483 | 100 |
| 1 | Basic period | Customer 8 | P1 | 920 | 966 | 966 | 100 |
| 1 | Basic period | Customer 8 | P2 | 2300 | 2415 | 2415 | 100 |
| 1 | Basic period | Customer 9 | P1 | 575 | 603.75 | 603.75 | 100 |
| 1 | Basic period | Customer 9 | P2 | 2300 | 2415 | 2415 | 100 |
| 1 | Basic period | Customer 7 | P1 | 345 | 362.25 | 362.25 | 100 |
| 1 | Basic period | Customer 7 | P2 | 600 | 630 | 630 | 100 |
The entire process described above is calculated and stored in the cloud to create the necessary reports. These indicators and tables are available in real time to anyone involved in the decision-making process in the supply chain.
Conclusions and future work
This research describes a tool based on the concept of digital twin for decision-making in a supply chain. The objective is to share the information among the supply chain stakeholders in order to increase the visibility of products and processes. The proposed tool incorporates facility location models, linear mixed-integer optimization models, and dynamic simulation techniques to carry out what-if multi-scenario analysis. A case study in the pharmaceutical industry was chosen to test the design and development of the digital twin. In addition to the papers presented in the literature review, this paper is one of the first developments of digital twins applied in the supply chain. A novel contribution is to consider the problem of supply network design embedded in the concept of digital twin. Considering the evolution of the IoT, it is estimated that by 2022 about 85% of the information technology platforms in companies will host a digital twin. Analogous to remote access and control of smart home appliances with IoT technologies, the digital supply chains will be the scheme that allows remote control and monitoring of global networks. Finally, with this proposal, the aim is to support the different industries so that they have a conceptual base of the elements that the design of a digital twin in supply chains should consider. While there is much information in the literature about digital twins, to our knowledge, there is no methodology for designing digital twins in supply chains.
Compliance with Ethical Standards
Conflict of interests
The authors declare that they have no conflict of interest.
Footnotes
Publisher’s Note
Springer Nature remains neutral with regard to jurisdictional claims in published maps and institutional affiliations.
References
- 1.Al-Mashari MA (2002) Implementing erp through sap r/3: A process change management (pcm) perspective. J King Saud Univ - Comput Inf Sci 14:25–38. 10.1016/S1319-1578(02)80002-7. http://www.sciencedirect.com/science/article/pii/S1319157802800027
- 2.Alaskari O, Pinedo-Cuenca R, Ahmad M (2019) Framework for selection of erp system: Case study. Procedia Manuf 38:69–75. 10.1016/j.promfg.2020.01.009. http://www.sciencedirect.com/science/article/pii/S2351978920300093. 29th International Conference on Flexible Automation and Intelligent Manufacturing (FAIM 2019), June 24-28, 2019, Limerick, Ireland, Beyond Industry 4.0: Industrial Advances, Engineering Education and Intelligent Manufacturing
- 3.Anderl R, Haag S, Schützer K, Zancul E (2018) Digital twin technology–an approach for industrie 4.0 vertical and horizontal lifecycle integration. it-Inf Technol 60(3):125–132 [Google Scholar]
- 4.Andriole S (2020) Gartner’s 10 technology trends for 2019: The good, the obvious and the missing. https://www.forbes.com/sites/steveandriole/2018/10/22/gartners-10-technology-trends-for-2019-the-good-the-obvious-and-the-missing654f3d6d5999
- 5.Anylogic: Anylogic cloud (2020). https://www.anylogic.com/features/cloud/
- 6.Aronow EA (2020) The gartner supply chain top 25 for 2019. https://www.gartner.com/en/doc/3913625-the-gartner-supply-chain-top-25-for-2019
- 7.Baruffaldi G, Accorsi R, Manzini R (2019) Warehouse management system customization and information availability in 3pl companies. Industrial Management & Data Systems
- 8.Boschert Stefan Rosen R (2016) Digital Twin—The Simulation Aspect. Springer International Publishing, Cham, pp 59–74. 10.1007/978-3-319-32156-1_5
- 9.Büyüközkan G, Göçer F (2018) Digital supply chain: Literature review and a proposed framework for future research. Comput Indust 97:157–177. 10.1016/j.compind.2018.02.010. http://www.sciencedirect.com/science/article/pii/S0166361517304487
- 10.Chhetri SR, Faezi S, Rashid N, Faruque MAA (2018) Manufacturing supply chain and product lifecycle security in the era of industry 4.0. J Hardw Syst Secur 2:51–68 [Google Scholar]
- 11.ConsultancyHealthStrategies: Follow the pill: (2005) Understanding the us commercial pharmaceutical supply chain
- 12.DNVGL: Open simulation platform. https://opensimulationplatform.com/ (2020)
- 13.DNVGL: Veracity (2020). https://www.veracity.com/
- 14.Ehie I, Ferreira LMDF (2019) Conceptual development of supply chain digitalization framework. IFAC-PapersOnLine 52(13):2338–2342. 10.1016/j.ifacol.2019.11.555. http://www.sciencedirect.com/science/article/pii/S2405896319315423. 9th IFAC Conference on Manufacturing Modelling, Management and Control MIM 2019
- 15.Elmonem MAA, Nasr ES, Geith MH (2016) Benefits and challenges of cloud erp systems – a systematic literature review. Fut Comput Inf J 1(1):1–9. 10.1016/j.fcij.2017.03.003. http://www.sciencedirect.com/science/article/pii/S2314728816300599
- 16.Garman-Ncole: Same data, new insight: Employing digital twins for supply chain success. Technical report, THOMAS for Industry (2018)
- 17.GeneralElectricDigital: Predix platform - digital twin (2020). https://www.ge.com/digital/applications/digital-twin
- 18.Guo J, Zhao N, Sun L, Saipeng Z (2019) Modular based flexible digital twin for factory design. J Ambient Intell Human Comput 10:1189–1200 [Google Scholar]
- 19.Howells-SAP-BRANDVOICE: How digital twins can ensure your best-laid supply chain plans never go awry (2020). https://www.forbes.com/sites/sap/2018/09/26/how-digital-twins-can-ensure-your-best-laid-supply-chain-plans-never-go-awry/#2d028fc5eed7
- 20.Howells-SAP-BRANDVOICE: Should businesses be scared to meet their digital twin? (2020). https://www.forbes.com/sites/sap/2018/02/28/should-businesses-be-scared-to-meet-their-digital-twin/#334dca0363a1
- 21.Howells-SAP-BRANDVOICE: Thought-leader roundtable: Three experts discuss digital twins (2020). https://www.forbes.com/sites/sap/2018/07/30/thought-leader-roundtable-three-experts-discuss-digital-twins/#41c0ba20292a
- 22.Ivanov D Predicting the impacts of epidemic outbreaks on global supply chains: A simulation-based analysis on the coronavirus outbreak (covid-19/sars-cov-2) case. Transportation Research Part E: Logistics and Transportation Review 136, 101922 (2020). 10.1016/j.tre.2020.101922. http://www.sciencedirect.com/science/article/pii/S1366554520304300 [DOI] [PMC free article] [PubMed]
- 23.Ivanov D, Dolgui A New disruption risk management perspectives in supply chains: digital twins, the ripple effect, and resileanness. IFAC-PapersOnLine 52(13), 337–342 (2019). 10.1016/j.ifacol.2019.11.138. http://www.sciencedirect.com/science/article/pii/S2405896319310869. 9th IFAC Conference on Manufacturing Modelling, Management and Control MIM 2019
- 24.Ivanov D, Dolgui A, Das A, Sokolov B (2019) Digital supply chain twins: Managing the ripple effect, resilience, and disruption risks by data-driven optimization, simulation, and visibility. In: Handbook of ripple effects in the supply chain. Springer, pp 309–332
- 25.Ivanov D, Tsipoulanidis A, Schönberger J (2019) Digital supply chain, smart operations and industry 4.0. In: Global supply chain and operations management. Springer, pp 481–526
- 26.Kunath M, Winkler H (2018) Integrating the digital twin of the manufacturing system into a decision support system for improving the order management process. Procedia CIRP 72,:225–231. 10.1016/j.procir.2018.03.192. http://www.sciencedirect.com/science/article/pii/S2212827118303512. 51st CIRP Conference on Manufacturing Systems
- 27.Li Q, Liu A (2019) Big data driven supply chain management. Procedia CIRP 81:1089–1094 [Google Scholar]
- 28.Marmolejo J, Rodríguez R, Cruz-Mejia O, Saucedo J (2016) Design of a distribution network using primal-dual decomposition. Mathematical Problems in Engineering 2016
- 29.Marmolejo-Saucedo JA, Hurtado-Hernandez M, Suarez-Valdes R (2019) Digital twins in supply chain management: a brief literature review. In: International conference on intelligent computing & optimization. Springer, pp 653–661
- 30.Orozco-Romero A, Arias-Portela CY, Marmolejo-Saucedo JA (2019) The use of agent-based models boosted by digital twins in the supply chain: a literature review. In: International conference on intelligent computing and optimization. Springer, pp 642–652
- 31.Payne-Tim (2018) Supply chain brief: Digital planning requires a digital supply chain twin. Technical report, Gartner
- 32.Payne-Tim (2018) Why and how to design digital twins. Technical report, Gartner
- 33.Redelinghuys A, Basson A, Kruger K (2019) A six-layer digital twin architecture for a manufacturing cell. In: Borangiu T, Trentesaux D, Thomas A, Cavalieri S (eds) Service orientation in holonic and multi-agent manufacturing. Springer International Publishing, Cham, pp 412–423
- 34.Ren S, Zhao X, Huang B, Wang Z, Song X (2019) A framework for shopfloor material delivery based on real-time manufacturing big data. J Ambient Intell Human Comput 10(3):1093–1108 [Google Scholar]
- 35.SAP: Sap s/4hana (2020). https://www.sap.com/products/s4hana-erp.html
- 36.SIEMENS: Mindsphere (2020). https://new.siemens.com/es/es/productos/software-/mindsphere.html
- 37.anyLogistix supply chain software: Supply chain digital twin and control tower with anylogistix (2020). https://www.anylogistix.com/resources/videos/supply-chain-digital-twin-and-control-tower/
- 38.anyLogistix supply chain software: Supply chain digital twins (2020). https://www.anylogistix.com/resources/white-papers/supply-chain-digital-twins/
- 39.Software_AG: Create a mirror image of your end-to-end processes with an enterprise digital twin for your supply chain (2020). https://www.softwareag.com/es/innovation/enterprise_digital_twin/supply_chain_management.html
- 40.Srai JS, Settanni E, Tsolakis N, Aulakh PK (2019) Supply chain digital twins: Opportunities and challenges beyond the hype. In: 23Rd cambridge international manufacturing symposium. Centre for international manufacturing, institute for manufacturing, department of engineering. University of Cambridge, Cambridge
- 41.Stank T, Esper T, Goldsby TJ, Zinn W, Autry C (2019) Toward a digitally dominant paradigm for twenty-first century supply chain scholarship. International Journal of Physical Distribution & Logistics Management
- 42.Stark R, Fresemann C, Lindow K (2019) Development and operation of digital twins for technical systems and services. CIRP Ann 68(1),:129–132. 10.1016/j.cirp.2019.04.024. http://www.sciencedirect.com/science/article/pii/S0007850619300502
- 43.Tao F, Cheng J, Qi Q, Zhang M, Zhang H, Sui F (2018) Digital twin-driven product design, manufacturing and service with big data. Int J Adv Manuf Technol 94(9-12):3563–3576. 10.1007/s00170-017-0233-1 [Google Scholar]
- 44.Trokanas N, Srai JS (2017) Towards an ontological backbone for pharmaceutical digital supply chains. In: Espuña A, Graells M, Puigjaner L (eds) 27th European Symposium on Computer Aided Process Engineering, Computer Aided Chemical Engineering. 10.1016/B978-0-444-63965-3.50390-1. http://www.sciencedirect.com/science/article/pii/B9780444639653503901, vol 40. Elsevier, pp 2329–2334
- 45.Velosa-etal (2017) Innovation insight for digital twins—driving better iot-fueled decisions. Technical report, Gartner
- 46.Yadav P, Smith L (2014) Pharmaceutical company strategies and distribution systems in emerging markets. In: Culyer AJ (ed) Encyclopedia of Health Economics. 10.1016/B978-0-12-375678-7.01218-9. http://www.sciencedirect.com/science/article/pii/B9780123756787012189. Elsevier, San Diego, pp 1–8
- 47.Yadav P, Tata H, Babaley M (2011) Storage and supply chain management. World Medicines Situation Report
- 48.Zhang H, Ma L, Sun J, Lin H, Thürer M (2019) Digital twin in services and industrial product service systems:: Review and analysis. Procedia CIRP 83:57–60. 10.1016/j.procir.2019.02.131. http://www.sciencedirect.com/science/article/pii/S2212827119302525. 11th CIRP Conference on Industrial Product-Service Systems
- 49.Zhang J, Ding G, Zou Y, Qin S, Fu J (2019) Review of job shop scheduling research and its new perspectives under industry 4.0. J Intell Manuf 30(4):1809–1830 [Google Scholar]
- 50.Zheng P, Sang Z, Zhong RY, Liu Y, Liu C, Mubarok K, Yu S, Xu X, et al. (2018) Smart manufacturing systems for industry 4.0: Conceptual framework, scenarios, and future perspectives. Front Mech Eng 13(2):137–150 [Google Scholar]
- 51.Zheng Y, Yang S, Cheng H (2019) An application framework of digital twin and its case study. J Ambient Intell Human Comput 10(3):1141–1153 [Google Scholar]
- 52.Zhuang C, Liu J, Xiong H (2018) Digital twin-based smart production management and control framework for the complex product assembly shop-floor. Int J Adv Manuf Technol 96(1-4):1149–1163 [Google Scholar]
- 53.Özkarabacak B, Çevik E, Gökşen PY (2014) A comparison analysis between erp and eai. Procedia Econ Financ 9:488–500. 10.1016/S2212-5671(14)00050-1. http://www.sciencedirect.com/science/article/pii/S2212567114000501. The Economies of Balkan and Eastern Europe Countries in the Changed World (EBEEC 2013)


