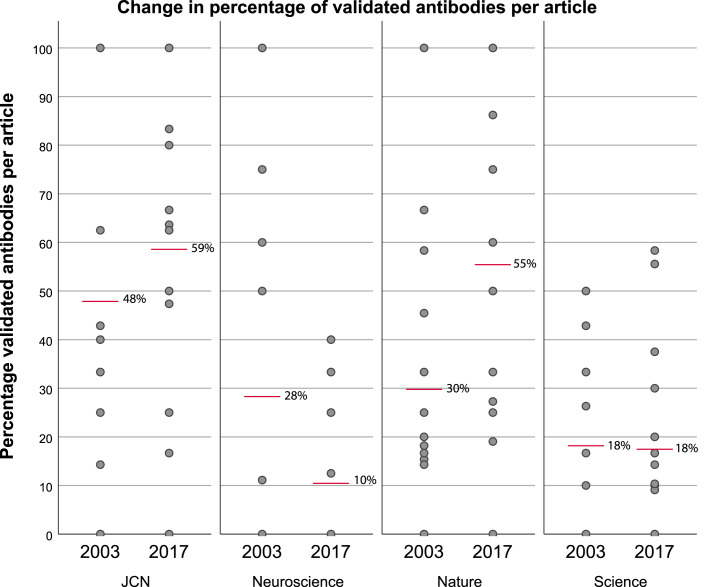
Figure 4. Change in percentage of validated antibodies per article before (2003) and after (2017) two of the journals (JCN and Nature) implemented antibody reporting guidelines.
Grey dots represent the percentage of validated antibodies per article, red bars indicate the mean percentage of validated antibodies per article for each journal. Sample size: JCN 2003 n = 15, 2017 n = 14; Neuroscience 2003 n = 14, 2017 n = 15; Nature 2003 n = 15, 2017 n = 14; Science 2003 n = 15, 2017 n = 15.

