

Abstract
Acidic transcription activation domains (ADs) are encoded by a wide range of seemingly unrelated amino acid sequences, making it difficult to recognize features that promote their dynamic behavior, “fuzzy” interactions and target specificity. We screened a large set of random 30-mer peptides for AD function in yeast and trained a deep neural network (ADpred) on the AD-positive and negative sequences. ADpred identifies known acidic ADs within transcription factors and accurately predicts the consequences of mutations. Our work reveals that strong acidic ADs contain multiple clusters of hydrophobic residues near acidic side chains, explaining why ADs often have a biased amino acid composition. ADs likely use a binding mechanism similar to avidity where a minimum number of weak dynamic interactions are required between activator and target to generate biologically relevant affinity and in vivo function. This mechanism explains the basis for fuzzy binding observed between acidic ADs and targets.
Graphical Abstract
eTOC blurb:
Erijman et al used a large set of synthetic transcription activation domains (ADs) to develop a deep learning predictor for acidic AD function. Using this predictor, they identify sequence features that specify function in natural ADs and how these properties lead to a mechanism for dynamic molecular recognition and function.
Introduction
Transcription activators stimulate transcription in response to signaling pathways controlling processes such as development, growth and stress response (Levine et al., 2014; Spitz and Furlong, 2012). Misregulation of activators or mutations within them leads to many human diseases and syndromes (Bradner et al., 2017). Each activator contains one or more transcription activation domain (AD) that usually targets coactivators – complexes that contact the basal transcription machinery and/or have chromatin modifying activity (Erkina et al., 2016; Hahn and Young, 2011). AD-coactivator binding initiates a series of events leading to productive transcription initiation, elongation and reinitiation, in part through direct recruitment of factors to gene regulatory regions (Ptashne and Gann, 1997). There are hundreds of cellular activators with distinct ADs, but many target a small number of coactivators including Mediator, TFIID, Swi/Snf, SAGA, NuA4 and p300. Broadly acting ADs can target several of these coactivators, allowing them to act on a large set of genes with different coactivator requirements. ADs have also been implicated in promoting the formation of intracellular condensates at enhancers, triggering the recruitment of a large dynamic network of coactivators and other factors responsible for gene activation (Boija et al., 2018; Cho et al., 2018; Chong et al., 2018; Shrinivas et al., 2019).
Early work demonstrated that: (i) eukaryotic activators are modular, with separable DNA binding and activation domains (Brent and Ptashne, 1985), (ii) ADs have biased low complexity sequences that are enriched in certain residues, and that the primary sequence of the AD is not critical (Cress and Triezenberg, 1991; Hope and Struhl, 1986; Hope et al., 1988; Jackson et al., 1996; Ma and Ptashne, 1987b, 1987a), (iii) that most ADs are intrinsically disordered (Brzovic et al., 2011; Currie et al., 2017; Hope et al., 1988; Kussie et al., 1996; Sugase et al., 2007; Uesugi et al., 1997) and, (iv) although specific AD targets are not always conserved, at least some ADs can work across a broad spectrum of eukaryotes (Fischer et al., 1988; Ma et al., 1988; Sadowski et al., 1988; Struhl, 1988). These properties suggested that activator function does not involve precise molecular complementarity with their targets but leaves open the important question of how any of the above properties translate into a molecular mechanism (Sigler, 1988).
In many systems apart from transcription, molecular recognition by intrinsically disordered protein regions (IDRs) is mediated by short linear motifs, 3-10 residue sequence motifs found in otherwise unrelated proteins (Ba et al., 2012; Das et al., 2012). In contrast, AD function is encoded by a wide range of seemingly unrelated sequences. For example, while AD sequences can be moderately conserved in closely related orthologs (Pacheco et al., 2018), no common sequence motif has been found when comparing ADs from different transcription factors. Small to moderate-scale screens for ADs using random sequences of varying length found that ~1% of these sequences encoded AD function, showing that no special sequence or structure is required for function (Abedi et al., 2001; Erkine et al., 2002; Ma and Ptashne, 1987b; Ravarani et al., 2018; Ruden et al., 1991). Other high throughput approaches, including screening for the function of transcription factor protein fragments and large-scale mutagenesis of a natural AD, also failed to find conserved sequence motifs (Arnold et al., 2018; Staller et al., 2018). Taken together, sequence features that correlate with AD function include intrinsic disorder, the presence of acidic, hydrophobic, and aromatic residues, low sequence complexity, net negative charge (or lack of positive charge) and, in some cases, alpha helix propensity.
Structural and molecular analysis showed that one prominent class of activators, the acidic ADs, can recognize coactivators using a dynamic “fuzzy” protein-protein interface. For example, the yeast activator Gcn4 contains tandem ADs that bind four structured domains in the Mediator subunit Med15 (Brzovic et al., 2011; Tuttle et al., 2018; Warfield et al., 2014). Structural analysis showed that the individual AD-Med15 interactions are dynamic, and that the two factors appear to interact via a cloud of hydrophobicity rather than through sequence-specific interactions. This binding mechanism does not require a unique sequence motif for AD function. Because of this, it has been difficult to predict sequences with AD function and to understand which features promote their dynamic binding properties and specificity. For example, how does biased sequence lead to specificity in molecular interactions, how specific are these sequences in the proteome, and is this class of activators representative of most activators? Understanding these fundamental properties of ADs is essential toward progress in determining the molecular basis of AD specificity for certain coactivators, dissecting mechanisms used in gene activation, and in predicting the consequences of naturally occurring mutations on AD function.
In this work, we used a high throughput approach in yeast to screen over a million synthetic peptide sequences and found large numbers of AD-positive and AD-negative sequences. We analyzed the resulting sequence sets using logistic regression and also developed a deep neural network predictor of AD function, termed ADpred. The combination of these two approaches allowed us to identify sequence features that specify AD function in natural transcription factors and, importantly, to relate these properties to a mechanism for molecular recognition and function of acidic ADs.
Results
A high-throughput screen for synthetic activation domains
To identify features encoding AD function, we isolated many synthetic ADs using a high throughput approach. We reasoned that gathering large sets of polypeptides with and without AD function would allow computational identification of physical properties, sequence motifs, and other features associated with ADs. Well-characterized natural ADs range from about 10 to ≥ 100 residues in length, but many are shorter than 30 residues. We created libraries containing 30 randomized amino acids attached to the N-terminal linker region and DNA-binding domain of yeast Gcn4 (residues 132-281) (Fig 1A). Prior work showed that this Gcn4 derivative has no inherent AD function and that it can accept a wide variety of natural and synthetic ADs, permitting activation of yeast Gcn4-dependent genes (Pacheco et al., 2018; Warfield et al., 2014). We varied the ratio of the four DNA bases separately at codon positions 1, 2, and 3 (LaBean and Kauffman, 1993), to avoid over or underrepresentation of amino acids with large or small numbers of codons (e.g., leucine and tryptophan). We made two libraries that either (1) slightly biased the randomized coding sequences toward residues normally enriched in IDRs (Uversky, 2013) or (2) encoded a roughly equal representation of all amino acids (Fig S1A). Each library was separately screened for AD function and the results presented below are derived from pooling sequences in both libraries. Analysis of the individual libraries yielded similar results (STAR Methods).
Figure 1.
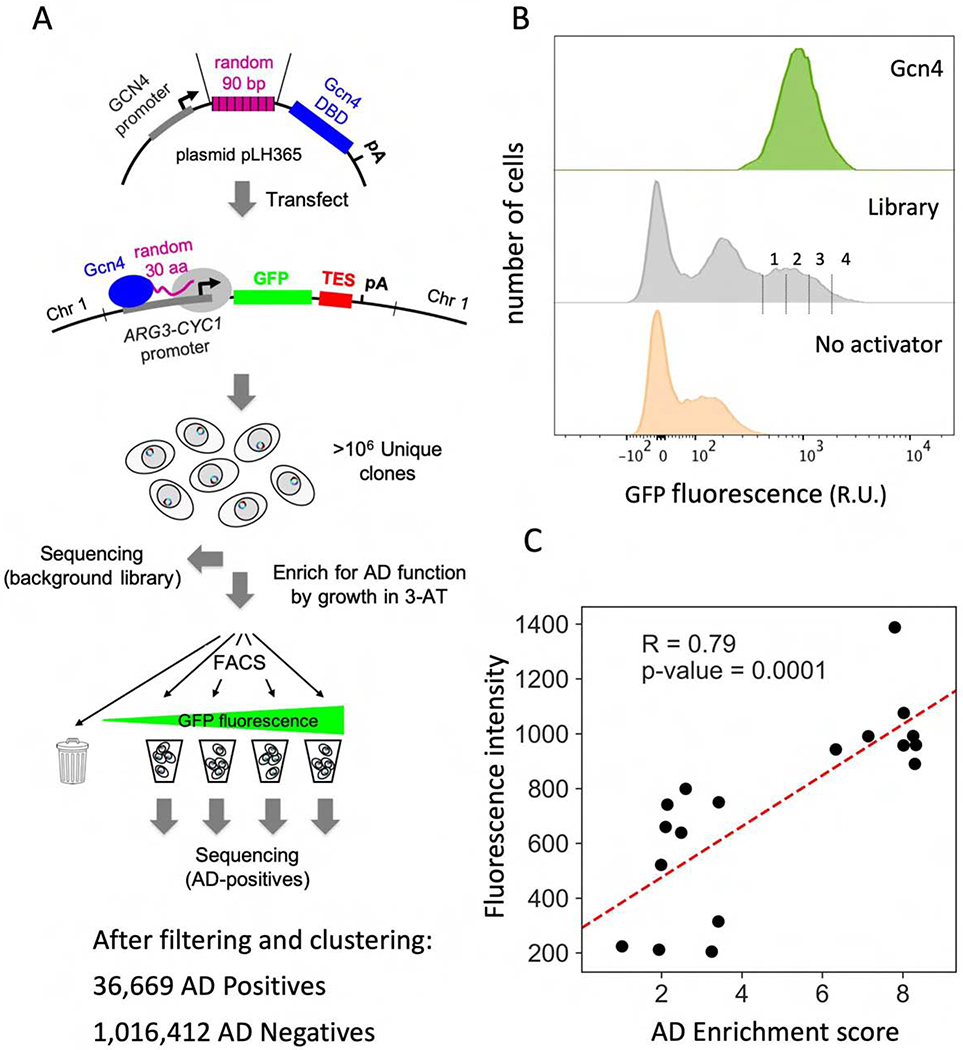
Experimental design and validation. A) Schematic of the high throughput screen for ADs. Cells containing a GFP reporter driven by a synthetic Gcn4-dependent promoter were transformed with libraries of random 30-mers fused to the N-terminus of the Gcn4 DNA binding domain. Cells with Gcn4-AD function were enriched by growth in 3-AT followed by FACS. DNA from the libraries before 3-AT selection and FACS (background library) and from the four GFP-containing bins were sequenced. The AD-negative set was created by removing sequences found in bins 1-4 from the background library. TES: ADH1 terminator; pA: poly-A site. B) Plots show the number of cells vs relative fluorescence intensities from FACS analysis of cultures with WT Gcn4, the enriched library, and no Gcn4. Vertical lines show gates used for binning AD-containing cells. C) Experimental validation of enrichment scores on 18 AD sequences versus GFP expression in the reporter strain. Individual clones were assayed by FACS and the mean fluorescence of the cell population is shown. See Table S1 and Fig S1.
The individual libraries were transformed into a yeast reporter strain lacking wild type (WT) Gcn4 and containing a Gcn4-dependent promoter driving GFP expression. Approximately 25 million yeast transformants were obtained, and ~3.6 million contained uninterrupted ORFs fused to Gcn4. To enrich for functional ADs, we grew cells overnight in synthetic media lacking histidine and containing 3-amino triazole (3-AT), a competitive inhibitor of the yeast His3 protein. HIS3 transcription is stimulated by Gcn4, and only cells containing functional Gcn4 produce enough His3 protein to efficiently grow under these conditions (Hope and Struhl, 1986). After selection in 3-AT, we sorted cells by their GFP levels using fluorescence-activated cell sorting (FACS). The distribution of fluorescence intensities shows that a subpopulation of cells expressed GFP at levels near those of cells with WT Gcn4 (Fig 1B). FACS was used to split these GFP-expressing cells into four bins of increasing fluorescence. We predicted that cells with the highest GFP levels (bin 4) should contain the strongest ADs. DNA was extracted from cells in the individual GFP-expressing bins, and sequenced. Only sequences containing a complete 30-residue ORF were analyzed. Single point mutations and other sequencing-related artifacts were minimized by clustering similar sequences, allowing for up to 6 mismatches per sequence to be included in the same cluster. The most frequent sequence in the cluster was used as the cluster representative. The AD-negative set contains peptide sequences from the background library (before 3-AT selection and FACS screening) but with all AD-positive sequences identified in bins 1-4 removed. The AD-positive set consists of sequences found in bins 2-4. Sequences found only in bin 1 were omitted as they likely contain some false positives. As a result, analysis of the combined libraries gave ~37,000 unique AD-positive sequences and ~1x10⁶ AD-negative sequences (Table S1).
Most functional ADs were not found in a single bin but were distributed among several bins, with the distribution presumably reflecting AD strength. To check the accuracy of our FACS-based screening, we first assigned an AD enrichment score to each AD-positive sequence. This score measures the weighted enrichment of a 30-mer sequence in bins 1 to 4 with respect to its number of occurrences in the library prior to 3-AT and FACS screening (STAR Methods). Next, we selected 18 AD-positive sequences with a wide range of enrichment scores and measured GFP expression in the reporter strain by fluorescence assay. We found that the calculated AD enrichment score correlates well with the mean GFP fluorescence induced by individual AD candidates, validating our activator screen (Fig 1C; Pearson correlation R = 0.79).
Amino acid composition and specific dipeptide sequences are important predictors of AD function
We first compared sequences from the AD-positive and negative sets by calculating a log-odds score for each sequence based on its amino acid composition. This score measures the similarity of amino acid composition in any individual sequence compared with the AD-positive and AD-negative sequence sets (STAR Methods). We found that individual sequences in the positive and negative sets have distinct but overlapping amino acid compositions (Fig 2A). This finding is consistent with earlier results showing that intrinsically disordered protein regions and ADs generally contain low complexity sequences that are biased towards certain amino acids.
Figure 2.
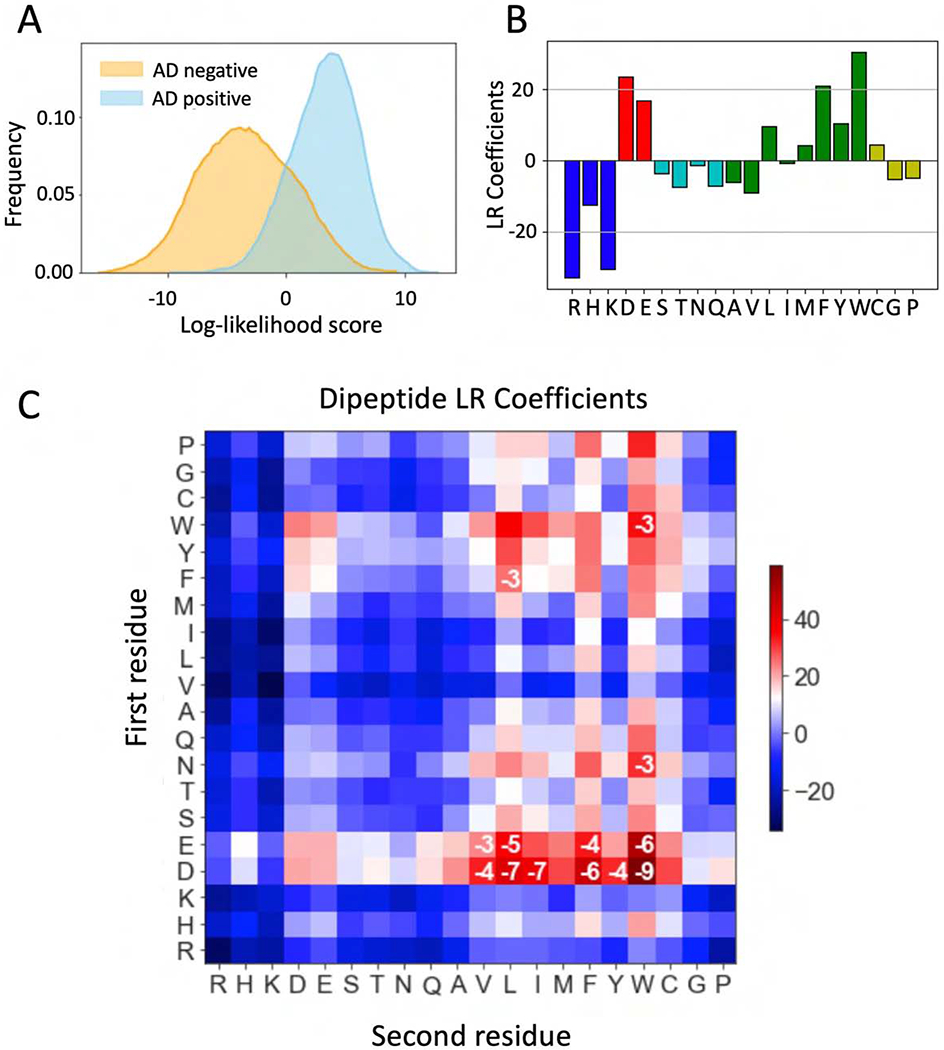
Properties of synthetic ADs. A) Distribution of log-odds scores for sequences from the AD-positive (blue) and AD-negative (orange) sets. B) Coefficients of amino acid frequencies derived from a logistic regression model for AD probability. Blue = positive charge; red = negative charge; green = hydrophobic/aromatic, cyan = polar and yellow = others. C) Dipeptide sequences contribute to AD function. Heatmap of coefficients from a logistic regression model using only dipeptide frequencies. The first amino acid in the dipeptide is on the Y-axis. Log10 p-values are shown where p <0.001. p-values are from likelihood ratio tests using all 400 dipeptide regression coefficients versus all but one. See Fig S1.
To quantify the contribution of amino acid composition to AD function, we tested how well composition alone predicts function. We fit a logistic regression model for AD prediction that used only the relative amino acid frequencies (between 0 and 1) in each positive or negative sequence. The model was trained with 90% of the AD-positive and AD-negative data and tested with 10% held out data. Surprisingly, composition alone is a very strong predictor of function with an area under the precision-recall curve (AUPRC) score of 0.934 ± 0.002 (accuracy of predictions: 0.883 ± 0.003), compared with a maximum possible AUPRC of 1.0 for perfect predictions and 0.5 for random predictions. The logistic regression coefficients from this model show the bias towards specific residues in AD-positive sequences (Fig 2B). Consistent with results from prior analysis of natural and synthetic AD sequences (Cress and Triezenberg, 1991; Hope et al., 1988; Ma and Ptashne, 1987b; Pacheco et al., 2018; Ravarani et al., 2018) the regression coefficients showed that ADs identified in our screen are depleted of positively charged residues (R, H, K), and enriched for negatively charged (D,E), hydrophobic and aromatic residues, particularly F and W.
While no unique sequence or short linear motif has been recognized as conserved in natural ADs, it is possible that combinations of short heterogeneous sequence motifs contribute to AD function. To explore this possibility, we developed a regression model that utilizes the frequencies of all 400 possible dipeptide sequences. The resulting logistic regression coefficients from this analysis show the bias towards specific dipeptides that are enriched or depleted in the synthetic ADs (Fig 2C). Using dipeptide frequency instead of amino acid composition improved model performance to an AUPRC score of 0.942 ± 0.002 (accuracy of prediction: 0.891± 0.004). Some dipeptides are clearly enriched in ADs such as D or E followed by a hydrophobic residue, especially F or W (log p-values from likelihood ratio tests are shown inside the boxes in Fig 2C). The reverse dipeptides (e.g., W followed by D or E) show a negligible impact on the model performance (STAR Methods). Importantly, we also found that certain dipeptides are strongly depleted in ADs, such as an aliphatic followed by a positive or polar residue, proline, or glycine (e.g. L-P), whereas the same was not true for the reverse dipeptides (Fig 2C). This analysis suggests that dipeptide sequences contribute to AD function over and above the contribution from their amino acid composition.
To confirm that dipeptide sequences contribute to AD function, we swapped individual dipeptide coefficients in the regression model (e.g., the DW coefficient was swapped with all other coefficients in 400 separate models) and used the new models to predict AD function (Fig S1B). We found that replacing the DW coefficient (labeled Fwd) with every other coefficient in this matrix decreases average model performance significantly, while replacing the WD coefficient (labeled Rev) has no appreciable effect on average model performance. Fig S1B also shows that replacing coefficients for six similar dipeptides (EW, EV, DV, DL, DF, and DY) also decreased model performance while replacement of the reverse peptide coefficients does not. We also compared the performance of our regression model with a previously proposed universal 9 amino acid AD sequence motif (Piskacek et al., 2007) (https://www.med.muni.cz/9aaTAD/). Both the regular and the more stringent 9aa sequence pattern did not perform well with our experimental data, achieving accuracies of 0.57 and 0.60, respectively.
A deep learning model for AD prediction
To discover complex features that can contribute to AD function in an unbiased, agnostic fashion and to improve the accuracy of AD predictions, we trained a deep-learning neural network model that does not require prior knowledge of features contributing to AD function (Schmidhuber, 2015). For example, this approach does not impose a limit on either the size or the position of the functional AD sequence within the 30-mer. The model inputs are the 30-residue sequences from each peptide in the positive and negative sets (20 values per position in one-hot encoding), predicted secondary structure (three values per position) and predicted disorder (one value) (Fig 3A). A series of 29 filters were used for data convolution that allowed us to model associations between residues at distant and variable positions. The resulting data is analyzed using a dense neural network with two soft-sign layers and the final output node yielding the probability of the input sequence to possess AD function. During training, the weights of the filters and other neural network connections are optimized, correcting for an imbalance of positives and negatives by subsampling the same number of negatives down to the same number of positives before each training epoch.
Figure 3.
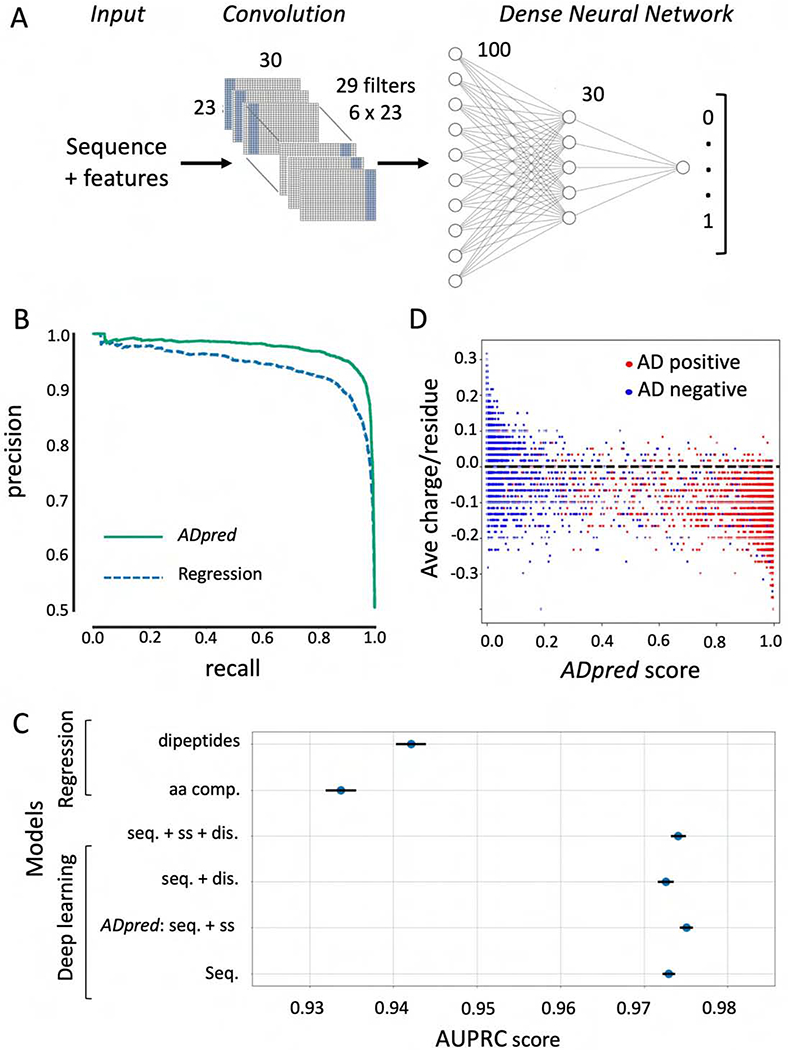
Convolutional deep neural network architecture and performance. A) Input for each sequence consists of the 30 amino acid peptide sequence and its predicted sequence features (secondary structure and/or intrinsic disorder). A convolutional layer learns patterns characteristic of ADs independent of their precise position in the AD sequence. The flattened outcome of the convolution is used as an input for a dense two-layer-network with 100 and 30 neurons respectively. The output layer gives the probability of AD function for the input sequence. B) Analysis of model performance. The precision-recall curve compares the performance of the linear regression model utilizing dipeptide frequencies and the best deep learning model (ADpred) utilizing amino acid sequence and secondary structure predictions. (C) Comparison of several regression and deep learning models evaluated with 10-fold cross validation, with the lines corresponding to standard error of the mean. dis. = disorder predictions; seq. = peptide sequence; ss = secondary structure prediction (statistics from Table S4). D) Correlation between predictions of the deep learning model and the average charge per residue of the 30mers. Dotted line represents peptide with neutral average charge.
Fig 3B, C compares the performance of the best deep learning and regression models. The best deep learning model, termed ADpred, uses only amino acid sequence and predicted secondary structure and shows great improvement in performance over the dipeptide regression model with an AUPRC score of 0.975 ± 0.001 (accuracy 0.932 ± 0.001). We found that secondary structure but not disorder predictions modestly improved model performance (Fig 3C). The striking improvement in performance of the deep learning models over regression approaches suggests the existence of important features associated with AD function in addition to bias in amino acid composition and dipeptides sequences.
To evaluate the contribution of peptide charge for AD prediction using the deep learning model, we compared average charge per residue versus ADpred probabilities for both AD positive and negative sequences (Fig 3D). This analysis showed that extreme positive or negative charge correlates well with predictions, but many peptides cannot be accurately predicted by charge alone. For example, while we found few ADs with net positive charge, a large number of negatively charged peptides do not have AD function. This is consistent with the conclusions above that other features, in addition to amino acid composition, make important functional contributions.
ADpred identifies sequence features important for AD function
To identify the sequence features used by ADpred to predict function and to test the utility of ADpred on natural activators, we first evaluated its performance on the Gcn4 central AD (cAD) where thousands of variants have been tested for in vivo function (Jackson et al., 1996; Staller et al., 2018; Warfield et al., 2014). We performed in silico saturation mutagenesis of residues 108-137 of the cAD, changing every residue to every other amino acid. We fed the resulting set of peptides to ADpred to predict AD probability with the results shown as a heat map in Fig 4A. Remarkably, the in silico predictions of this single-residue mutagenesis showed excellent correspondence with results from an analogous in vivo study (Warfield et al., 2014) with a Pearson correlation of R=0.82 (Fig 4B, left). We also used ADpred to predict function for thousands of Gcn4 variants used in a high throughput functional screen, most containing multiple mutations within the cAD (Staller et al., 2018) (Fig 4B, right). Again, there was good correspondence between prediction and published in vivo results with Pearson correlation R=0.57.
Figure 4.
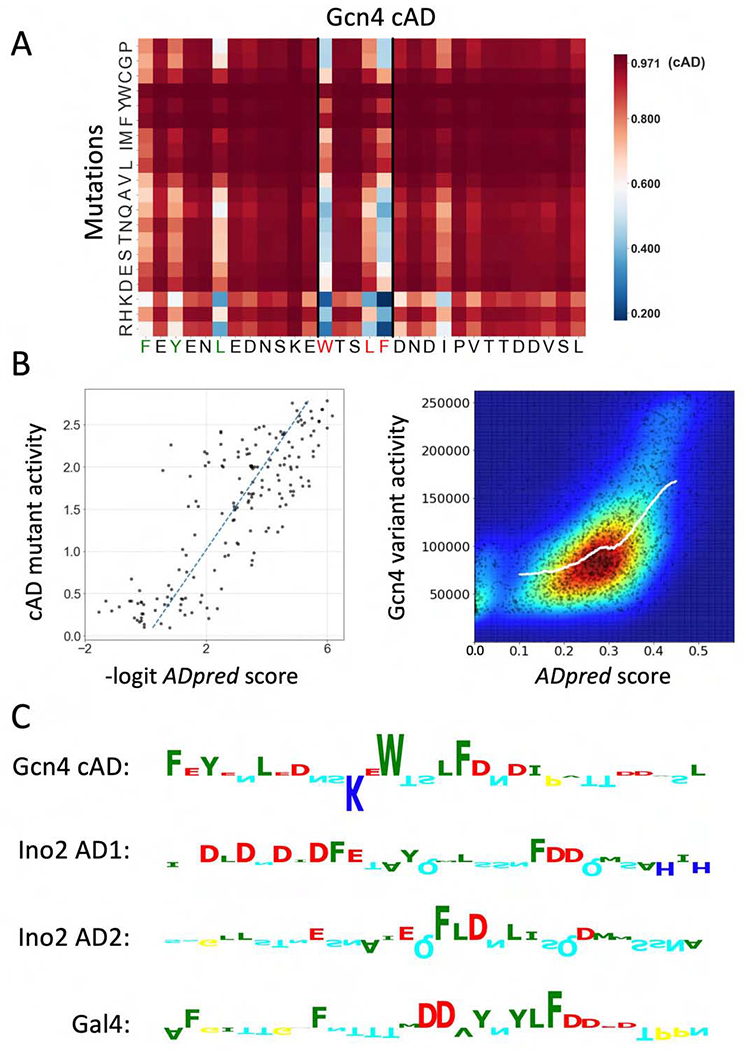
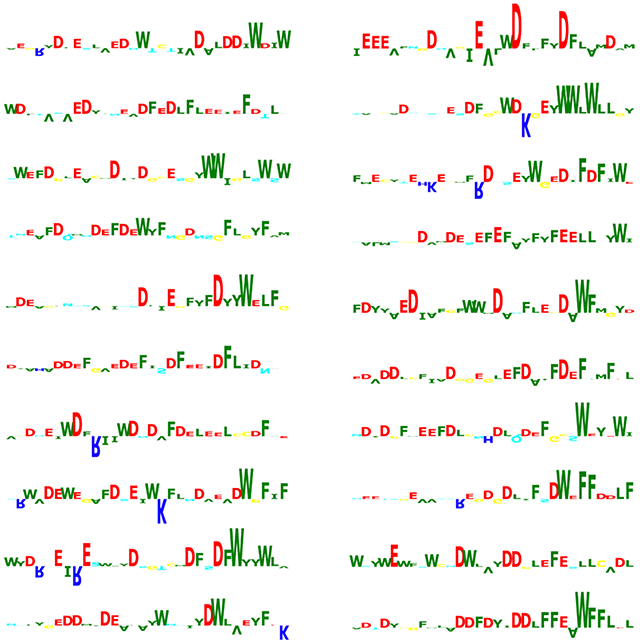
Performance of ADpred on yeast activators. A) ADpred predictions for all possible single amino acid mutations of the Gcn4 central AD (cAD). An increase in ADpred score is darker red, decreases are lighter red or blue. Wild type cAD ADpred score is indicated in the colorbar. Residues important for Gcn4 function identified in prior work are colored red and green in the Gcn4 sequence below the heat map. B) (Left) The AD activity of cAD derivatives measured in (Warfield et al., 2014) shows a high correlation with ADpred predictions (R=0.82). ADpred probabilities were transformed from (0,1) to (−∞,∞) by the logit function. (Right) Comparison of ADpred predictions with a large set of yeast Gcn4 derivatives (Staller et al., 2018). Experimental data plotted as raw activity values measured under amino acid starvation conditions. Colors represent the density of points from low density in blue to high density in red. The white line shows a K nearest neighbor regression analysis (where Y is predicted by local interpolation of values from the K nearest neighbors on X, using kNeighborsRegressor function from scikit-learn package) (R=0.57). C) Predicted importance of individual residues for ADpred scores identified using the Integrated Gradients algorithm (Ancona et al., 2018; Sundararajan et al., 2017). Residue contributions in four selected yeast ADs are shown as sequence logos (positive upwards, negative downwards) Residue colors are the same as in Fig 2B. See Figs S2, S3.
From this combined analysis, the importance of the three Gcn4 residues that make direct contact with Med15 (W120, L123 and F124; labeled in red in Fig 4A) are clearly apparent as well as the lesser but noticeable impact of three other hydrophobic residues (F108, Y110 and L113; labeled in green) that have been observed in vivo (Jackson et al., 1996; Staller et al., 2018). Furthermore, our model predicts that insertion of positively charged residues are most likely to have a deleterious impact on function when positioned near the key hydrophobic residues, that insertions of additional hydrophobic residues generally increase function, and that no single negatively charged residue is important, in agreement with earlier in vivo studies (Jackson et al., 1996; Staller et al., 2018; Warfield et al., 2014). Using the same in silico mutagenesis approach, we predicted important residues within yeast ADs from Ino2 and Gal4 (Fig S2). Again, we observe an excellent correspondence between in silico predictions and experimental results (Pacheco et al., 2018; Tuttle et al., 2019), showing that the deep learning model is an accurate predictor of acidic AD function.
ADs generally contain clusters of hydrophobic residues rather than specific sequence motifs
For additional insight into sequence features that lead to the high performance of the deep learning model, we analyzed the ADpred results using Integrated Gradients (Ancona et al., 2018; Sundararajan et al., 2017), an algorithm that identifies positive and negative features that contribute to a high prediction score. The results from analysis of four representative yeast ADs is shown in Fig 4C, with the results presented as sequence logos. Fig S3 shows the Integrated Gradient analysis of 20 high-scoring synthetic peptides from the high throughput screen (analysis of AD-negative peptides returns empty logos). In contrast to earlier predictions, e.g., (Piskacek et al., 2007; Warfield et al., 2014), we found no evidence for ADs to contain defined sequence motifs of three or more residues. Rather, a common feature is clusters of hydrophobic residues in the background of an acidic polypeptide. Recognition of this feature is likely a primary reason that ADpred performs better than predictions based on amino acid composition alone. Many strong natural ADs and the top scoring synthetic peptides have multiple occurrences of this simple sequence pattern. In sequences with properly biased amino acid composition, the probability that this pattern occurs multiple times increases with the length of the peptide and probably contributes to AD strength.
Recognition of acidic ADs within eukaryotic transcription factors
We next used ADpred to analyze yeast, Drosophila, human and viral transcription factors for which in vivo AD function has already been mapped (Fig 5). For this analysis, we used an ADpred probability of ≥ 0.8 as a high confidence threshold. In the figure, blue peaks show AD predictions, yellow boxes indicate experimentally validated AD function, and structured domains are indicated by grey boxes. In many yeast factors (Gcn4, Met4, Ino2, Rap1, Gal4, Rtg3), our model predicts AD function coincident with known ADs (Fig 5A). One exception is the Gcn4 N-terminal AD, where optimal AD function requires a combination of four short hydrophobic clusters scattered throughout the 100 amino acid long N-terminal region (Jackson et al., 1996; Tuttle et al., 2018). None of these four short clusters can act as an AD on their own but they require the others for in vivo function. Within this region, ADpred predicts function, but with a probability <0.8. It seems likely that our model does not give a high probability to this long AD because it was trained on ADs of ≤30 residues. Another exception is Hap4 where the three highest probability scores lie outside of a previously mapped AD region (see below).
Figure 5.
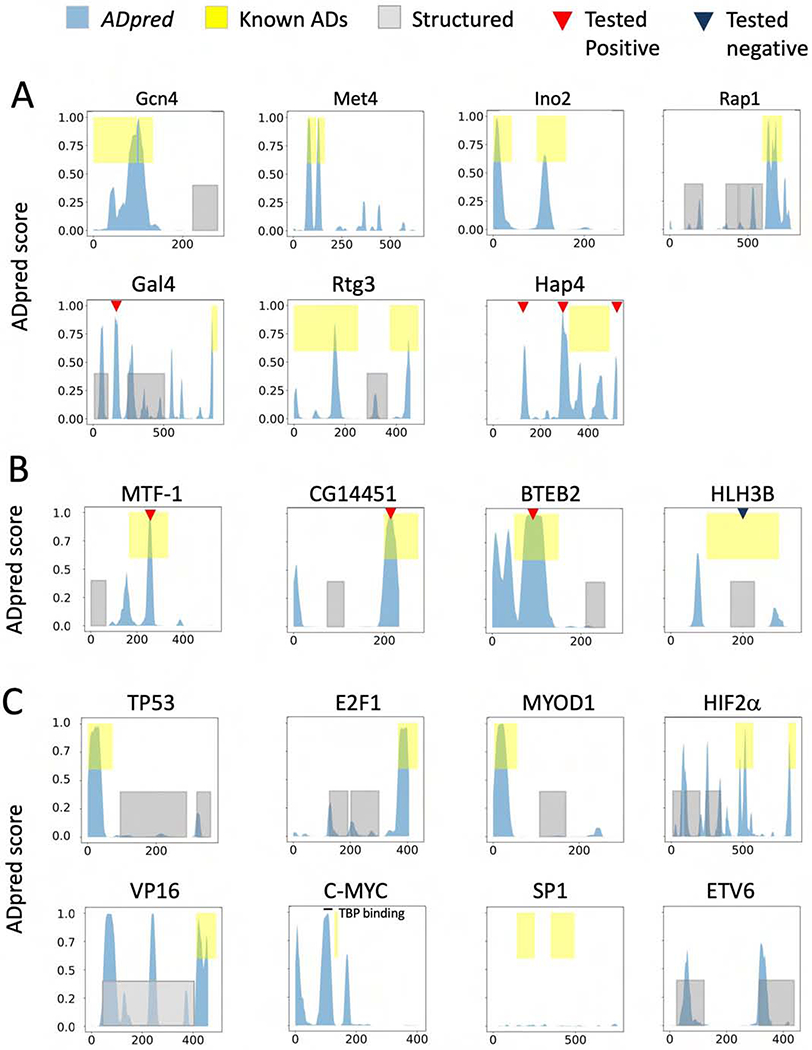
Performance of the deep learning model on selected (A) yeast, (B) Drosophila, (C) human and viral transcription factors. Known AD-containing regions are yellow, known structured regions grey, and ADpred scores blue. Red triangles show predicted AD+ sequences that test positive for AD function in vivo; dark blue triangles show predicted AD− sequences without AD function (see Fig 6). The TBP-binding peptide in c-Myc (Wei et al., 2019) is indicated. Published data on ADs is from the following sources: (Arnold et al., 2018; Fields and Jang, 1990; Helin et al., 1993; Kuras and Thomas, 1995; Leuther and Johnston, 1992; Ma and S3. Ptashne, 1987a; Pacheco et al., 2018; Pascal and Tjian, 1991; Raycroft et al., 1990; Regier et al., 1993; Rothermel et al., 1997; Schwank et al., 1995; Wei et al., 2019; Weintraub et al., 1991).
Examination of Drosophila transcription factors readily identified three ADs (MTF-1, CG14451, BTEB2) that were identified using a prior high throughput screen (Arnold et al., 2018) (Fig 5B). In contrast, ADpred did not identify ADs in two other Drosophila factors from the same screen (HLH3B in Fig 5B and SAGE-not shown). One possibility is that these two factors contain ADs of a different class compared with the ADs analyzed here. Well characterized ADs in the human and viral factors p53, E2F1, MyoD, Hif2α, and VP16 were clearly recognized (Fig 5C). However, the ADs from SP1 are interesting exceptions. SP1 contains two Q-rich ADs that are both required for maximum function (Courey and Tjian, 1988) and SP1 does not function as an activator in the yeast system (Ponticelli et al., 1995). Neither of these Q-rich ADs are recognized by ADpred, confirming that they are in a different class from the acidic ADs examined here. In human c-Myc, ADpred does not recognize the conserved Myc box 2 region, thought to be involved in transcription activation. However, another region (residues 88-119) recently shown to directly bind TBP and to be important for Myc function (Wei et al., 2019) is identified by ADpred with a high probability score. Finally, it is apparent from Fig 5 that peptides with predicted AD function are not exclusive to disordered regions. For example, Gal4, HLH3B, HIF2α, VP16 and the transcription repressor ETV6 all have peptide sequences with AD potential that are contained within regions of known or predicted 3D structure.
Since ADpred identified several sequences with high confidence of AD function in regions outside of mapped ADs (Fig 5), we tested whether these are false positives. An alternative explanation is that these peptides have strong potential for AD function but are not positioned in the proper context to function in their natural setting; e.g. are in structured regions or are otherwise inaccessible to the transcription machinery. 30-residue segments containing several predicted yeast and Drosophila ADs (indicated by red triangles in Fig 5) were fused to the Gcn4 DNA binding domain. Function was assayed in vivo by treating cells with sulfometuron methyl (SM) for 90 min to simulate amino acid starvation and to induce synthesis of Gcn4, followed by RNA quantitation using RT qPCR (Fig 6A, Table S2). When assayed at the Gcn4-dependent HIS4 gene, a predicted AD from Gal4 (Gal4_A) (Ma and Ptashne, 1987a) and three from Hap4 (Hap4_A,B,C), produced 3.7- to 8.6-fold higher transcription compared with SM-treated cells lacking Gcn4 (labeled “vector” in Fig 6A). At HIS4, we used activation of transcription by >3-fold for scoring AD+ function (dashed lines in Fig 6). Our results show that these predicted ADs do not inherently lack activity but can function as ADs in an appropriate context. We also tested ADpred predictions for several Drosophila factors in the yeast system. Consistent with our predictions, the ADs from MTF-1, CG14451 and BTEB2 all showed in vivo AD function, while the regions previously identified as ADs in vivo but not by ADpred, showed no AD function in yeast (HLH3B and SAGE).
Figure 6.
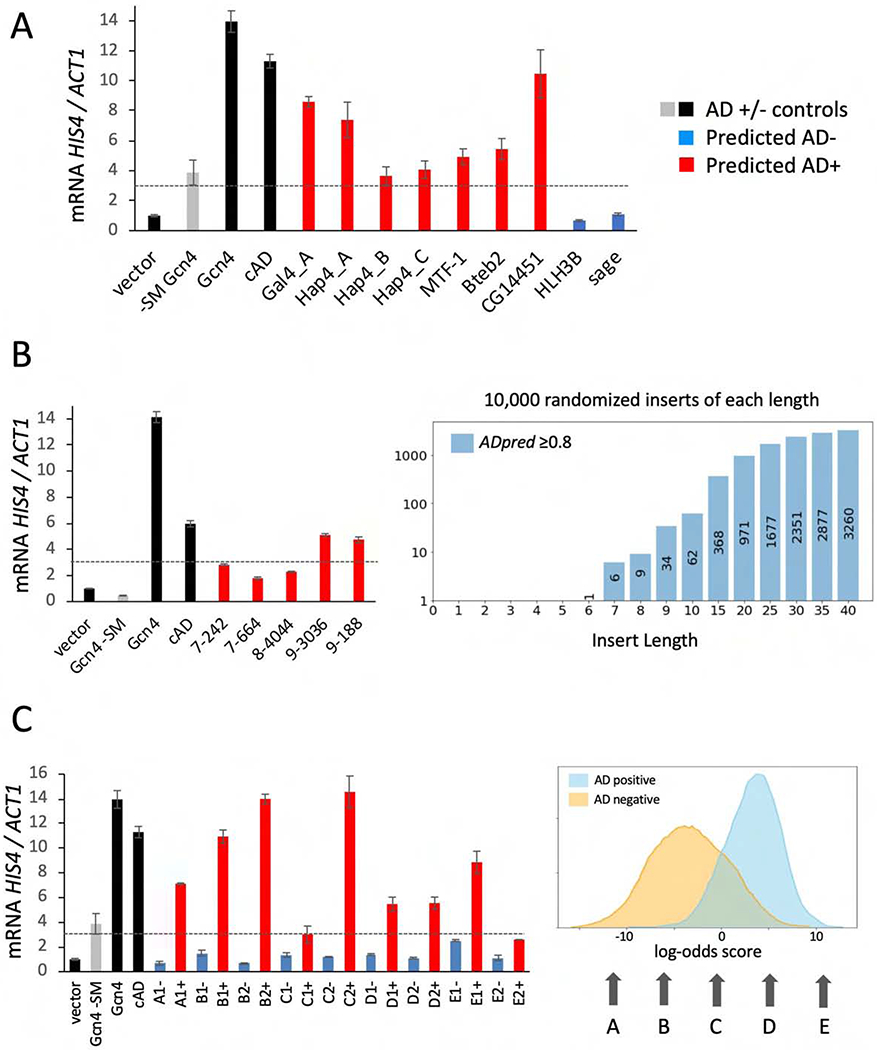
In vivo tests of ADpred predictions of natural and synthetic ADs. RT qPCR quantitation of mRNA from the yeast HIS4 gene, normalized to ACT1 mRNA. Dotted lines indicate 3-fold activation above cells lacking Gcn4 (vector). Cells contained the indicated AD sequence (Table S2) fused to the Gcn4 DBD in vector pLH365 and were induced with SM for 90 min before mRNA quantitation. Grey bars = no SM added, all others have SM; Black bars = control Gcn4 derivatives: WT Gcn4 and the Gcn4 cAD. Red bars = sequences predicted to have high probability of AD function; blue bars = low probability of AD function. A) Tests of yeast and putative Drosophila ADs from Fig 5. B) Length dependence of AD function. Right graph shows the number of predicted ADs recovered from 10,000 randomized sequences of the indicated lengths. Left panel shows RT qPCR analysis of predicted ADs. The first number of the sequence name indicates the length of the synthetic AD (e.g., 9_188 is an insert of 9 amino acids). C) Arrows point to regions where selected AD-positive sequences were randomized and used to search for one or two pairs of sequences with the same amino acid composition but either high (+) or low (−) ADpred scores. Left plot shows RT qPCR analysis of these randomized sequences. Sequence pairs with identical log-odds scores are labeled A-E as in the log-odds histogram followed by 1 or 2; e.g., A1+/A1−, A2+/A2−, etc. See Table S2, Figs S4, S5, S6.
Length dependence of natural and synthetic ADs
Our synthetic AD screen used randomized sequences of 30 residues and ADpred uses a sliding window of 30 residues to analyze sequences for AD function. However, our approach did not require the ADs to be a specific length or at a particular position within the 30-mer. For example, if some ADs are 10-residues long, a 30-mer might contain one or more ADs. For this reason, deep learning is a powerful way of pinpointing the AD sequences without any a priori knowledge of the AD position within the 30-mer, nor how long, or how many ADs might be contained in any one 30-mer.
We used several methods to estimate AD length. First, we counted the number of consecutive 30-residue windows that give a high confidence ADpred score (≥0.8). This criterion is used for analysis of yeast, Drosophila and human proteomes and transcription factors sets shown below. Second, we used saturation mutagenesis (e.g., Fig 4A) to identify residues predicted to be functionally important. Third, we chopped proteins containing predicted ADs into segments of different lengths and computationally inserted these fc-mers into a randomized neutral background that contained only the residues S,T,N,Q,A,G that are neither strongly enriched or depleted in ADs (Fig 2B; Fig S4). For Gcn4, this analysis identified two overlapping ADs, each 2226 residues long, that are a combination of hydrophobic residue clusters in the N and C-terminal ADs. In contrast, yeast factor Tog1, with an uncharacterized AD, is predicted to contain a short 8-residue sequence that defines its core AD.
Fourth, we used a combination of computational and functional approaches to gauge how accurately ADpred predicts the function of very short peptide sequences. We randomized sequences of 1-40 residues in length (all amino acids had an equal chance of being in the insert) and computationally inserted these peptides into the middle of a neutral 60-mer containing only the residues S,T,N,Q,A,G. 10,000 randomized insert sequences of each length, plus the constant flanking sequence, were analyzed by ADpred. As expected, the fraction of predicted ADs was zero for sequences shorter than 6 residues but rose quickly for longer sequences (Fig 6B). We tested a few of the short insert sequences for in vivo function and found that the 7-mer and 8-mer sequences activated HIS4 transcription less than 3-fold, while both 9-mers activated 4.5-fold. From our combined results, we conclude that ADpred recognizes ADs of variable length with practical length limits of ADs ≥9 to ≤30 residues in length. This minimum length requirement fits with our published analysis of natural ADs, where AD function is often spread out over 15-30 residues.
ADpred can overrule strong amino acid composition bias
As demonstrated above, amino acid sequence composition is perhaps the most important factor determining the probability of AD function, but other features also make important contributions. Given that a model using only sequence composition as a feature reaches quite high accuracies, we asked whether the ADpred predictions are dominated by sequence composition. We selected sequences from our libraries containing a wide range of log-odds scores for amino acid composition (labeled A to E in Fig 6C). For each selected sequence, we generated a set of 10,000 randomly permuted 30-mer peptides and then sorted them using ADpred. From this set, we selected one or two pairs of sequences with identical amino acid composition but with high and low ADpred scores (AD+ or AD−). Upon testing these pairs of 30-mers for function at HIS4 and using activation of transcription by ≥3-fold for scoring AD+ function, all predictions were confirmed except for one of two sequences tested with +10 log-odds score (Fig 6C). In this exception to our prediction, sequence E2+ has a sequence composition extremely biased toward AD function but only shows 2.6-fold activation. Combined, our results demonstrate that ADpred can correctly predict function with high accuracy even if the sequence composition is strongly biased toward non-AD sequences and vice versa.
We used the Integrated Gradients algorithm to examine the scrambled peptide sequences with variable amino acid composition used in Fig 6C (Fig S5). This analysis showed that peptides confidently predicted to have AD function but, with unfavorable amino acid composition, had separately clustered the favorable and unfavorable residues away from each other. For example, AD+ peptides with compositions labeled A and B had positively charged residues segregated to the N-terminus while the acidic and aromatic residues were positioned in the C-terminus. This further validates our conclusion that short clusters of hydrophobic residues in the background of an acidic polypeptide are important for function and that ADpred recognizes functional sequences of less than 30-residues long.
We also tested many of the above peptides for activation of yeast ARG3 transcription (Fig S6A). ARG3 is transcribed at ~7-fold lower rate compared to HIS4, and transcription of ARG3 is regulated by Gcn4 and two repressors. Our prior studies using AD derivatives at both promoters showed that HIS4 is generally more permissive for AD function, perhaps because of the more complex regulation and coactivator requirements at ARG3 (Pacheco et al., 2018; Tuttle et al., 2018). Because WT Gcn4 shows lower levels of activation at ARG3 compared with HIS4 (5.5-fold vs 14-fold), we set a threshold of 2-fold activation for scoring AD function (Fig S6A). Of the four AD predictions for yeast proteins outside of previously mapped ADs, only one activated ARG3 >2-fold (Hap4A), but all Drosophila proteins examined and 15 of 18 synthetic sequences tested behaved as expected. Thus, our predictor performs well but is less accurate on a promoter with more stringent AD requirements (77% accuracy at ARG3 compared to 93% at HIS4. Nevertheless, there is a high correlation of experimental vs. predicted values at both HIS4 and ARG3 with R=0.85 and 0.67 respectively (Fig S6B).
Acidic ADs are enriched in yeast but not in Drosophila or human transcription factors
To further explore properties of natural ADs, we applied the deep learning model to the entire yeast, Drosophila and human proteomes. We characterized protein regions as AD-containing (ADpred probability ≥0.8) and by the length of the predicted AD region. We compared predictions within the proteome to predictions on a subset of 132 yeast transcription factors, some of which are known activators, and to sets of 754 Drosophila and 1043 human transcription factors (Bateman et al., 2018; Stampfel et al., 2015; Vaquerizas et al., 2009) (Fig 7A, Table S3). We observed a modest but clear enrichment of 20-30 residue long acidic ADs in yeast transcription factors (p <0.01). In contrast, we found no enrichment of acidic ADs in the set of Drosophila or human transcription factors. While this latter result seems surprising, it may indicate that metazoan transcription factors most often use a different type of AD. The result that acidic AD-type peptides exist in non-transcription factors is also in agreement with our findings above that not all peptides with inherent AD function are in a context that allows them to function as activators.
Figure 7.
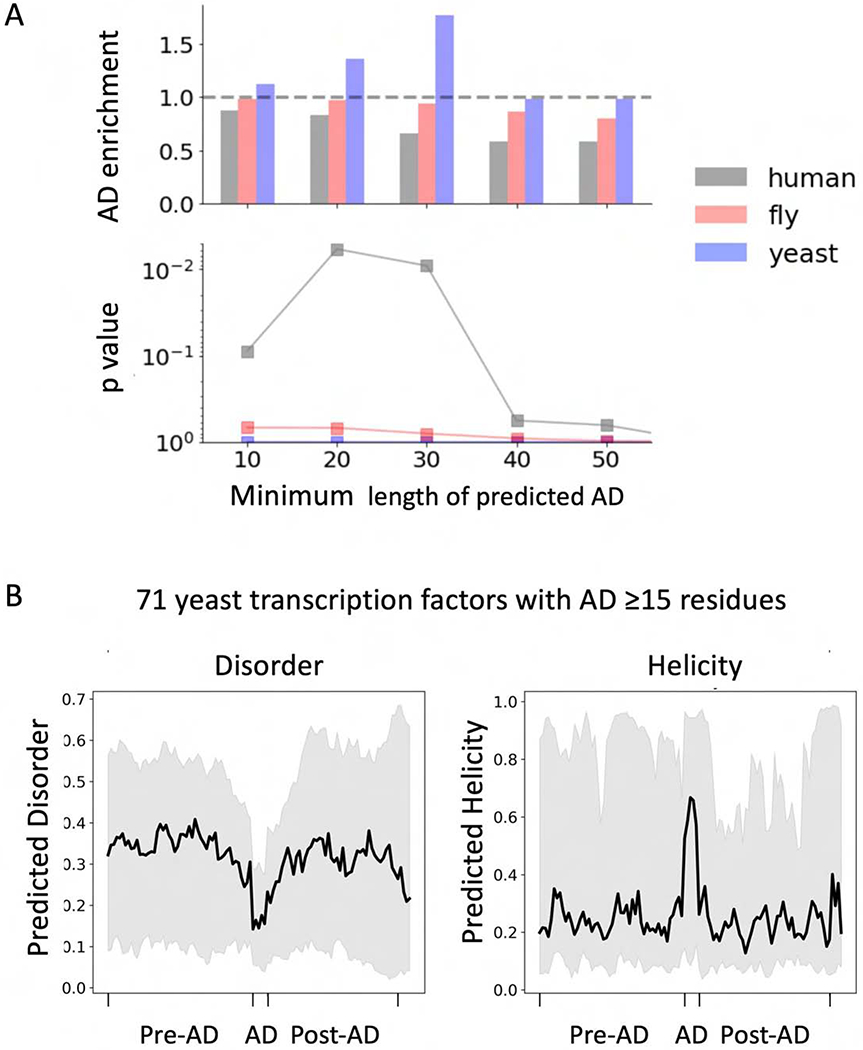
Properties of predicted AD regions. A) Tests for enrichment of predicted ADs in sets of yeast, Drosophila, and human transcription factors (Table S3) compared to the complete proteomes plotted against the minimum length threshold for calling an AD. The enrichment p-values from a Fisher test are shown below. B) Predicted disorder and helicity in and around predicted ADs from a set of 71 yeast transcription factors with ADs ≥15 residues long (Table S3). To compare properties of the ADs, which are of variable length, the average score for helical and disordered content at the five central residues of the ADs were calculated and shown graphically in a 5-residue window. Black thick line: median values; Grey: values between the 25th and 75th percentile. Results are shown for a cutoff of ADs 15 or greater residues in length where 71 ADs meeting this criterion were found in the set of 132 yeast factors. See Table S3.
ADs show higher helical propensity and less disorder than surrounding sequences from in silico analysis.
Finally, we explored whether sequences within the proteome having predicted AD function are enriched for disorder or secondary structure elements. For this analysis we used a cutoff of ADs ≥15 residues in length. Our analysis examined the 25, 50 and 75th percentiles of the predicted helical propensity or disorder within 50 residues N and C-terminal to the predicted AD. To compare properties of the ADs, which are of variable length, we plotted the average score for helical and disordered content at the five central residues of the identified ADs independent of their length and represented this score graphically in a 5-residue window. The predicted ADs from a total of 71 yeast transcription factors have, on average, lower disorder and higher helical propensity compared to the surrounding sequence (Fig 7B). Consistent with prior expectations, our analysis suggests that many natural ADs are peptides with alpha helical propensity located within disordered regions. We found this same pattern whether analyzing the entire yeast proteome, the subset of nuclear proteins, or only yeast transcription factors (Fig S7). We therefore suggest that the observed pattern of helicity and disorder might be some inherent property of the acidic “AD-type peptides” and their normal protein environment, whether or not they are transcription factors.
Discussion
Since their discovery and initial characterization, the nature of transcription activation domains has been enigmatic (Ptashne and Gann, 1990; Sigler, 1988; Struhl, 1987). Nearly all characterized ADs are intrinsically disordered, have no obvious common sequence motif and yet the function of some activators is conserved from yeast to humans. Together, these and other properties suggested that the function of activators does not require precise molecular interactions of ADs with their targets. In agreement with this conclusion, structural studies showed that one class of activators, the acidic ADs, can interact with their targets via a dynamic fuzzy interface. (Brzovic et al., 2011; Tuttle et al., 2018). This prior work has left unanswered several important questions including: i) What sequence properties of the activator promote this molecular recognition mechanism? ii) How many transcription factors use this mechanism? iii) Can these sequence features be recognized computationally and how common are these features in transcription factors? and iv) Is this molecular recognition mechanism used outside of the transcription system? In this work, we generated large sets of synthetic activators and non-activators and, in combination with two machine learning approaches, developed an accurate predictor of acidic AD function (ADpred; https://adpred.fredhutch.org). Working backwards from the predictors allowed us to identify, in a systematic way, properties and sequence features driving AD function and to relate these properties to a molecular recognition mechanism.
Randomized libraries have been screened for AD function in earlier work (Abedi et al., 2001; Erkine et al., 2002; Ma and Ptashne, 1987b; Ravarani et al., 2018). However, our new approach identified ~60-fold higher numbers of ADs and a much larger number of non-ADs, an important starting point for systematic analysis of functional properties. For example, a prior machine learning approach used 926 synthetic AD variants that gave an AD prediction AUROC score of 0.773 (in comparison to our AUROC of 0.977; Table S4) and attributed different relative importance to some of the features described here (Ravarani et al., 2018).
As inferred from earlier studies, we found a striking difference in amino acid composition between the AD-containing and non-AD sequences. A logistic regression approach based solely on amino acid composition was surprisingly accurate (AUPRC 0.934), showing that composition is the most important feature in determining the probability of function. Regression allowed us to quantify the contribution of residue type to predicted function, and this was consistent with earlier work: ADs are generally depleted of positively charged residues and enriched for acidic, hydrophobic and especially aromatic residues. Importantly, this approach also allowed us to examine the contributions of simple sequence motifs. Our analysis showed that functional ADs are enriched for specific dipeptides and depleted of others. One of these dipeptides, DW, had been identified earlier (Ravarani et al., 2018). This is in agreement with a prior proposal that one function of acidic residues in ADs is to promote solvent exposure of hydrophobic residues that are involved in direct molecular interactions (Staller et al., 2018).
To improve performance and to enable analysis on a proteome-wide scale, we developed a deep neural network for AD prediction. Deep learning allows predictions of function without a priori knowledge about which patterns or properties might be important for the prediction. For example, identification of ADs with this approach is independent of the number, position, or length of ADs contained within any of the 30-mers. This approach gave a striking improvement in the accuracy of AD prediction compared to the logistic regression model (AUPRC 0.975 compared to 0.934). ADpred, performs well, even with sequences that show extreme bias in amino acid composition against AD function. Including features representing predicted disorder did not increase performance. This is not surprising, since it is unlikely that a sequence in our library of 30-mers would by chance fold by itself.
Analysis of sequence features that contribute to ADpred performance showed that ADs contain clusters of hydrophobic residues in the background of an acidic polypeptide and that the strongest ADs contain multiple examples of this feature. This feature is found in both natural and synthetic ADs and seems a key general feature corresponding to function. Earlier it was noted that the Gcn4 N-terminal AD requires a combination of four such clusters spread out over ~ 100 residues (Jackson et al., 1996; Tuttle et al., 2018). However, until our new analysis, it was unclear whether this feature generally contributed to the function of shorter ADs (e.g., in the 15-20 residue range) or whether AD function is primarily encoded by combinations of more sequence-specific motifs (Piskacek et al., 2007; Warfield et al., 2014).
We suggest that these hydrophobic clusters function to increase the effective affinity of the AD peptides for their coactivator targets using a mechanism similar to avidity or allovalency – whereby a receptor dynamically interacts with multiple binding sites on a single ligand, effectively inhibiting the dissociation of the two molecules (Locasale, 2008; Olsen et al., 2017). In other words, there are a minimum number of weak dynamic interactions required between activator and target to generate biologically relevant affinity and in vivo function. This mechanism fits nicely with the dynamic and fuzzy binding of acidic activators to Med15, and presumably other coactivator targets, as well as the finding that AD-coactivator binding is driven in part by a favorable entropy change (Pacheco et al., 2018; Tuttle et al., 2018). Importantly, our results explain the known length-dependence of function for ADs and the relationship of amino acid composition to function – the probability of multiple acidic-hydrophobic clusters is highest in peptides with appropriate amino acid composition. Our results that functional ADs are ≥9 residues in length are also in agreement with this mechanism.
These new results, combined with earlier work, show that functional acidic ADs (1) consist of a disordered polypeptide with biased amino acid composition, (2) typically contain multiple clusters of hydrophobic residues in the background of an acidic polypeptide, (3) are enriched for specific short dipeptide sequences and depleted of others, (4) have less disorder and more helical propensity than surrounding sequences that facilitate the presentation of their hydrophobic residues to interacting partners and (5) are typically of length ≥9 residues. Taken together, our characterization fits with a fuzzy-binding mechanism where the interactions take place in a dynamic environment resembling a hydrophobic cloud rather than combinations of sequence-specific interactions.
Tests of our optimized model showed that it can accurately identify acidic ADs and pinpoint functionally important residues within transcription factors. For example, in silico mutagenesis of the Gcn4 cAD to every possible residue and predicting the effect on AD probability gave results remarkably consistent with extensive experimental analysis. ADpred also recognized well-characterized ADs within other yeast, Drosophila and human factors. However, several findings showed that sequences with potential AD function are not exclusive to transcription activators. First, we found predicted ADs within regions not known to function as ADs including some structured protein regions. Second, while we found that these AD-like peptides are modestly enriched in yeast transcription factors compared to the proteome, they are not enriched in Drosophila or human transcription factors. This may indicate that acidic ADs are not as common among human transcription factors compared with yeast factors and provides a path for characterization of these other AD types. In combination, our results demonstrate that AD function requires that the peptide be located in the proper protein context and that not all proteins having an acidic AD-type sequence will work as activators. Recognition of these “false-positives” when screening the proteome will require additional information. For example, ADpred was trained on short random sequences, which are likely to be disordered. Identification of true ADs in transcription factors will likely be more accurate if only disordered regions are considered. It is important to note that our screen used a TATA-containing inducible promoter. Earlier studies showed that enhancers, the DNA targets of activators, can have specificity for a certain promoter type and that coactivator requirements can vary dependent on the gene regulatory region (Butler and Kadonaga, 2001; Haberle et al., 2019).
Some yeast acidic activators, such as Gal4, work in all eukaryotes, and the ADs we have isolated here have similar properties and are likely of this class. In contrast, some higher eukaryotic cell-type specific activators bind particular coactivator targets using a sequence-specific and conventional protein-protein interface that likely have different sequence requirements, e.g., (De Guzman et al., 2006). It will be of great interest in future work to repeat the screen using promoters with different coactivator requirements and promoter sequence elements to determine whether this setup changes the sequence features necessary for transcription activation. It will also be of interest to test how predictions of AD function correlate with the ability to form condensates – a property associated with at least some ADs (Hahn, 2018).
STAR Methods
Resource Availability
Lead contact and materials availability:
Further information and requests for resources and reagents should be directed to and will be fulfilled by the Lead Contact, Steven Hahn (shahn@fredhutch.org).
Experimental Model and Subject Details
S. cerevisiae reporter strain SHY1018 (From Steven Petesch, Fred Hutch) was derived from strain BY4705 (Brachmann et al., 1998) and contained a deletion of the GCN4 gene, was reverted to HIS3+ (required for 3-AT selection) and contained a synthetic ARG3-CYC1 promoter driving eGFP expression integrated into a gene desert region of Chromosome I with the following genotype: matαade2Δ::hisG leu2Δ0 lys2Δ0 met15Δ0 trp1Δ63 ura3Δ0 gcn4Δ::KanMX, Ch I integrated URA3::ARG3-CYC1p-eGFP. Strain SHY823 was used for RTqPCR assays in tests of synthetic and natural AD-Gcn4 derivatives with genotype: matαade2Δ::hisG his3Δ200 leu2Δ0 lys2Δ0 met15Δ0 trp1Δ63 ura3Δ0 gcn4Δ::KanMx
Method Details
Design of the randomized libraries
For the first library, we computed the ratio of A, C, G, and T needed at each codon position to obtain a roughly equal probability for encoding each of the 20 amino acids and a minimal probability for a stop codons within our random 90-mer nucleotide sequence. In a custom python script, we minimized an objective function using the “basin hopping” algorithm (Wales et al.) implemented in the Python scientific library scipy (Oliphant, 2007). The objective function is the Euclidean distance from equal representation of all 20 amino acids (Pr(aa)=0.05) and an absence of stop codons (Pr(stop)=0). The goal for the second library was to obtain amino acid target probabilities equal to the average observed in disordered regions. We used the same Python script to compute the optimal ratios of A, C, G, and T to minimize the Euclidean distance with target and predicted probabilities.
Oligonucleotides containing 30 repeats of the randomized codons (see below) were ordered from Integrated DNA Technologies (Coralville, IA). Each of the three codon positions contains a defined ratio of A/C/G/T to generate the desired bias. The oligonucleotides were extended in a PCR reaction to add 40 bp identity on each end to plasmid pLH365 (see below). This plasmid was derived from the ARS CEN LEU2 vector pRS315 and contains 1 Kb upstream DNA and the coding sequence for Gcn4 residues 132-281. This upstream DNA contains all known Gcn4 promoter and translational regulatory elements. The plasmid was digested with SbfI and NotI and 4 μg of linearized vector, and 12 μg of the PCR products was transformed to electrocompetent yeast strain SHY1018 so that in vivo homologous recombination inserted the randomized 30-mers into the N-terminus of Gcn4 (Benatuil et al., 2010). Ten transformations were run in parallel to produce a library of ~2x10⁷ clones.
FACS analysis, library DNA isolation and DNA sequencing
Cells containing the two libraries were separately screened by FACS. Prior to FACS analysis, 10 ml (~108 cells) of the glycerol stock were diluted into 250 ml glucose complete media without leucine and grown to saturation, then diluted to OD600=0.3 in synthetic complete media (Donczew et al., 2020) containing 3 mM 3-Amino Triazole but without leucine, uracil and histidine and. After 14-19 hours, cells were washed and diluted in double distilled water to ~107/ml and FACS sorted in a FacsAriaII instrument. A threshold of RU of fluorescence was set on the upper extreme of the negative sample. Cells with higher values of fluorescence than the threshold were sorted into 4 different gates and ~ 0.5-1 x10⁷ cells were collected. Sorted cells were collected by centrifugation for 1 min and resuspended in 1-5ml of synthetic complete glucose media without leucine. Cells were grown overnight, then diluted to OD600 = 0.3 in 25 ml and grown overnight. 20 ml cells were harvested by centrifugation, washed with 10 ml H2O and resuspended in 4 ml TE buffer. 2.5 ml Zr-SiO2 beads were added and the suspension shaken 7X in a mini Bead Beater (Biospec products) for 3 minutes at maximum speed with 5 min rests on ice between shaking cycles. Once cell lysis reached 70-90%, the supernatant was transferred to a 15 ml falcon tube with 4 ml of Phenol/CHCl3 mixture, vortexed for 30 seconds and centrifuged at 4200 rpm for 15 minutes. The supernatant was transferred into microcentrifuge tubes and centrifuged at maximum speed for 10 minutes. The aqueous phase was transferred to new tubes and extracted with an equal volume of chloroform. The organic layer was extracted with an equal volume of water and the two aqueous fractions were combined and ethanol precipitated and treated with RNAseA to generate the plasmid DNA libraries. 2 μl of the DNA libraries (2-19 x 10−7 M plasmid DNA) was amplified for sequencing in a reaction with 20 nM forward and reverse primers, 0.2 mM dNTPs and 0.04 U/μl of Phusion enzyme in a 50 μl reaction. DNA from FACS-sorted bins 1-4 were barcoded using Illumina nextera i7 barcodes. The PCR product was purified with AMPure beads (1.8 μl beads/ml PCR product) according to manufacturer instructions and eluted in 50 μl TE. The DNA concentration was measured with a picogreen assay and DNA sequencing was performed on an Illumina HiSeq instrument. After FACS analysis and DNA sequencing, sequences from both libraries were combined into a single dataset to increase the number of samples.
Data processing for machine learning
All procedures are implemented in custom python and bash scripts. Reads 1 and 2 from paired-end sequencing were paired with FLASH (Magoc and Salzberg, 2011). We filtered out sequences longer than 90 base pairs, with sequencing quality PHRED score less than 30 for a given base, with frameshifts, or without start or stop codons. Paired nucleotide sequences were translated to amino acids. Sequence clustering (Edgar, 2010) was applied to minimize redundancy in the libraries (with minimum sequence identity of 80% per cluster). Each cluster was represented by its most frequent member sequence. Each such sequence is included in the final reduced dataset and the total number of reads in bins 1 to 4 and background correspond to the sum of reads of all members of the cluster. For an initial experimental validation, an activator enrichment score was calculated for each sequence in the final dataset as the summation of the number of reads in each bin, multiplied by coefficients (coeffbin) that correspond to the mean value of fluorescence of each bin (see section below):
Here, readsneg stands for the number of reads in the AD-negative set, which comprises all reads from the unsorted background library minus any AD sequences found in FACS bins 1 to 4.
Machine learning analysis
The redundancy-filtered set of sequences with read counts in bins 1 to 4 and background were split into positive (AD-positive) and negative (AD-negative) sets. The AD-negative set contains all sequences in the background library except those found within FACS bins 1 to 4. The positive set contains all sequences with at least one read in total in bins 2 to 4. Omitting sequences that were only found in bin 1 improved model performance, presumably by eliminating false positives. Charges were computed for each sequence as the summation of amino acid frequencies multiplied by a coefficient where (E,D=−1; K,R=1 and H=0.5).
For Fig 2A, we compared the sequence composition between the positive and negative sets by computing the log-odds score for each sequence and plotting its distribution for the two libraries. The log odds score for each sequence was calculated as the sum of the log enrichments of each of the 20 amino acids in the sequences, where enrichment is the ratio of amino acid frequencies in the AD-positive versus the AD-negative sequence sets. Positive scores indicate an amino acid composition similar to the AD-positive set while negative scores indicate a composition similar to the AD-negative set. Denoting with aai the i’th amino acid in the sequence, with the averaged frequency of the amino acid aai in the positive set and with the frequency in the negative set, the log odds score of a polypeptide sequence is:
In Fig 2B, we trained a logistic regression model with L2 regularization (λ = 3.9 10−3 was chosen from a grid of 40 default values provided in LogisticRegressionCV function from scikit-learn package) to predict whether a sequence is AD-positive or AD-negative. The model was evaluated using 5-fold cross-validation. This required optimizing 21 parameters, one for each amino acid frequency in the sequence and one offset. For Fig 3, we trained a logistic regression model to predict AD function using the 400-dimensional dipeptides composition instead of the 20-dimensional single amino acid composition.
To assess the importance of specific dipeptides for AD function, we performed 400 likelihood ratio tests, each comparing the full model with models lacking one dipeptide feature. Dipeptides with significance p-values below 0.001 are indicated in Fig 3 by their base 10 logarithm. We also built alternative AD score distributions by flipping the coefficients of a dipeptide to every other dipeptide and measuring the performance of these models in the test and validation datasets (Fig S1A). We repeated this for all dipeptides, or the specific dipeptides shown, and compared the distribution visually with boxplots.
The deep neural network for ADpred (Fig 4A) was implemented using Keras 2.1.6 (Chollet, 2015) with a TensorFlow (tensorflow.org) backend. Briefly, the input was composed of sequence and secondary structure (H, E and –, for Helix, β-sheet and random coil from PSIPRED 4.0.1) in a one-hot encoded matrix of dimension 30 by 23. This input was fed into a model made up of a convolutional layer, two dense layers and the output dense layer. The convolution layer had 29 filters with filter size 6x23, the first hidden dense layer had 100 neurons and the second hidden layer had 30 neurons. Each layer had a softplus activity (log(1 + ex)). The hidden layers were regularized with L2 regularization (λ=0.001) and dropout (P=0.5) layers. The final output layer had a single neuron with a sigmoid activation function and was used to compute the final probability for AD function prediction.
The model was trained with the ADAM optimizer (Kingma and Ba, 2014) using the binary cross entropy loss function, and the model’s performance was analyzed using AUPRC (area under a precision-recall curve), which corrects for skewed class sizes and is a common metric used in classification tasks. Each epoch was split into 250 batches. At the beginning of each epoch, we randomly drew an equal number of positive and negative samples from the original data set. Hyperparameters (batch size, number of epochs, optimization algorithm, learning rate and momentum, weight initialization, activation functions, drop out probabilities and convolutional filter properties) were optimized with GridSearchCV method from scikit-learn. Briefly, for each combination of features (amino acid sequence, secondary structure and disorder), the complete dataset was split into 10 parts. 8 were used to train the models, 1 to optimize the hyperparameters and 1 to test the model. This was repeated 10 times for each hyperparameter setting, randomly initializing the weights of the network. Each of the 10 parts was used for testing and each part for validation exactly one time. At each of these 10 iterations, average precision and recall and standard deviation of the mean were measured on the test set (for the 10 random initializations). Fig 4B shows the results of applying such procedure. To train ADpred, each hyperparameter was fixed to the mean of the optimum over its 10 values (detailed in the previous paragraph). Then the complete set was split again into 1 part as a test set and 9 parts for training. The best model over 100 random initialization of the weights was chosen based on its AUPRC score on the test set.
For Fig 5A, all residues of a cAD 30mer were mutated to all other 19 amino acids and ADpred probability was computed. In Fig 5B the same approach was applied to cAD derivatives, and ADpred results were compared to experimental results (Tuttle et al., 2018).
To search for AD-regions in full protein sequences, we rolled a 30-residue long window over the entire sequences and assigned the score to the residue in the middle (the 16th position in the 30mer). Ordered domains were obtained from HHpred (Zimmermann et al., 2018) and the d2p2.pro webserver (Oates et al.).
Analysis of ADpred dependence on amino acid composition
To experimentally test ADpred and to demonstrate that the model captures more than the amino acid composition of input sequences, we designed 30-mers with the same amino acid composition (and hence log-odds scores, Fig 2A) but in the opposite extremes of the scale of ADpred probabilities. We picked sequences from low to high log-odds scores (A to E in Fig 6A) and permuted the order of amino acids in each of these sequences 10,000 times. We sorted each library of 10,000 sequences by their ADpred probabilities. We then selected peptides with high and low prediction scores and tested them for in vivo function by fusion to the Gcn4 DNA binding domain and analysis by RT qPCR.
Proteome analysis for ADs
To search for ADs in full length yeast protein sequences, a window of 30 residues was scanned along all annotated protein sequences in yeast (data from Saccharomyces Genome Database). and the ADpred probability for the window was assigned to the central amino acid in the window (the 16th). We calculated p-values for the enrichment of ADs in the set of transcription factors compared to the yeast proteome with the hypergeometric test as follows. The summed lengths M of all proteins in the proteome corresponds to the population size, and the summed length N of all transcription factor sequences corresponds to the “labeled” part of the population. Sites with five or more contiguous residues with a score ≥0.8 correspond to the samples drawn. Suppose there are m such sites, n of which lie within transcription factors. The p-value for the hypergeometric test is the probability to obtain k or more sites within the transcription factors.
The enrichment is computed as
and the p-value corresponds to:
We used the implementation as survival function in scipy.stats.hypergeom. Disorder and secondary structure predictions were calculated with PSIPRED 4.0.1 (Cuff and Barton, 2000) and lUPred 1.0 (Dosztányi, 2017).
K-mer analysis of protein sequences
In our first approach to examine the length requirements of ADs (Fig S4), we searched for protein regions that have the highest impact on the ADpred score. For each protein of interest, we extracted all overlapping k-mers of a fixed length k, for k = 1 to 30. These k-mers were computationally inserted into neutral N-terminal C-terminal 30 residue flanking sequences that showed negligible ADpred scores of around 0. For each length class k, the k-mer with the maximum ADpred score was identified and plotted together with its ADpred score (Fig S4). The sequences used for the adapters are TNSANAANASASSQAGQQATQNQNTAQQNG (N-terminal) and GNGNQNQTTSTSNASANANSGSQGTGSSSQ (C-terminal).
Analysis of AD length requirements
In our second approach to examine the length requirements of ADs (Fig 6B), sequences of varying lengths, from 1 to 40 residues long, were simulated from a random uniform distribution with equal probability for all 20 amino acids (Pr(aa)=0.05). For each length, 10,000 sequences were sampled and computationally inserted between the constant “C” and “N” terminal 30-mer flanking sequences, neutral to ADpred, used in the above k-mer analysis. The number of sequences with ADpred score ≥0.8 from the 10,000 sampled sequences are reported and plotted as bar plot in Fig 6B.
Test of the 9aa TAD motif
Occurrences of the 9aa motif for both the higher and lower stringency versions of the motif (Piskacek et al., 2007) were searched using the re python library for regular expressions (Prosite syntax): [MDENQSTYG]{KRHCGP}[ILVFWM]{KRHCGP}{CGP}{KRHCGP}[ILVFWM][ILVFWMAY]{KRHC} and [MDENQSTYCPGA]X[ILVFWMAY]{KRHCGP}{CGP}{CGP}[ILVFWMAY]XX)
ADpred web server
Protein sequences can be analyzed using ADpred at the website: https://adpred.fredhutch.org.
Randomized oligonucleotide sequences
Shown below are the two oligonucleotide oligonucleotides used for generation of randomized 30-mers fused to the N-terminus of the Gcn4 linker and DNA binding region.
Oligo 1: optimized for equal ratios
5’ - CAATTTGTCTGCGGCCGCAAATAAATTAAATACAAATAAAATGTCTGCA [(ratio 1)(ratio 2)(ratio 3)]30 GGCGACAATGACATTCCTGCAGGCACTGACGATG– 3’
A,C,G,T ratios at the three codon positions were: ratio 1 (0.295, 0.230, 0.248, 0.227), ratio 2 (0.323, 0.258, 0.245, 0.174), ratio 3 (0.000, 0.286, 0.424, 0.289)
Oligo 2: optimized for disordered enriched regions
5’ - CAATTTGTCTGCGGCCGCAAATAAATTAAATACAAATAAAATGTCTGCA [(ratio 1)(ratio 2)(ratio 3)]30 GGCGACAATGACATTCCTGCAGGCACTGACGATG– 3’
A,C,G,T ratios at the three codon positions were: ratio 1 (0.312, 0.084, 0.406, 0.198), ratio 2 (0.372, 0.158, 0.177, 0.293), ratio 3 (0.254, 0.241, 0.265, 0.241)
These oligos were PCR amplified with the following primers to insert 40 bp identity on each end with pLH365:
HomoRec_pLH365_AD-Gcn4_LongF:
ccctatactatcattaattaaatcattattattactaaagttttgtttaccaatttgtctGCGGCCGCaaataaattaaatacaaataaaatgtctgc
HomoRec_pLH365_AD-Gcn4_LongR:
ggtaccagagaaacttcttcagtggattcaattgccttatcagccaatgaaacatcgtcagtgcctgcaggaatgtcattgtcgcc
Randomized oligos were amplified using 20 ng PAGE-purified DNA, 400 nM HomoRec amplification oligos, 0.2 mM dNTPs, 1X Phusion buffer, and 1.3 U Phusion polymerase (NE Biolabs) and the cycling program: 95 deg 60 sec, (95 deg 30 sec, 60 deg 60 sec, 75 deg 90 sec) X35, 72 deg 4 min. PCR products were purified on AMPure XP beads (Beckman Coulter). The vector plasmid, pLH365, was prepared by digestion with SbfI and NotI, and purified on AMPure XP beads. The concentration of pLH365 with the randomized oligo insert in the DNA preparation was calculated by qPCR using primers: fwd (cctttctgtcaaattatccagg) and rev (ccgcagacaaattggtaaac). 4 μg linearized pLH365 (6.1 nM final) and 12 μg PCR product (56 nM final) were co-transformed by electroporation (Benatuil et al., 2010) to yeast strain SHY1018 (see below). For each randomized oligo construct, ten transformations were performed in parallel to create a library of ~2x10⁷ clones. Transformed cells were grown to saturation in glucose complete media without leucine (1-3 days), re-diluted to OD600 = 0.3 and grown to OD600 ~1-1.5. Glycerol was added to 20% final and cells frozen in liquid nitrogen and stored at −80C in 10 ml aliquots.
pLH365 vector sequence.
Shown is the relevant promoter and coding sequence of pLH365 into which the randomized 30-mers and the 30 residue test sequences were cloned. (nnn)30 indicates the site of oligo insertions. The Gcn4 coding sequence is capitalized and encodes: MSA-(nnn)30 – Gcn4 (125-281)-3xFlag. Not1 and Sbf1 restriction sites are shown in blue. The coding sequence for 3xFlag is magenta.
ttatccaggtttactcgccaataaaaatttccctatactatcattaattaaatcattattattactaaagttttgtttaccaatttgtctgcggccgcaaataaattaaatacaaataaaATGTCTGCA(nnn) 30GGCGACAATGACATTCCTGCAGGCACTGACGATGTTTCATTGGCTGATAAGGCAATTGAATCCACTGAAGAAGTTTCTCTGGTACCATCCAATCTGGAAGTCTCGACAACTTCATTCTTACCCACTCCTGTTCTAGAAGATGCTAAACTGACTCAAACAAGAAAGGTTAAGAAACCAAATTCAGTCGTTAAGAAGTCACATCATGTTGGAAAGGATGACGAATCGAGACTGGATCATCTAGGTGTTGTTGCTTACAACCGCAAACAGCGTTCGATTCCACTTTCTCCAATTGTGCCCGAATCCAGTGATCCTGCTGCTCTAAAACGTGCTAGAAACACTGAAGCCGCCAGGCGTTCTCGTGCGAGAAAGTTGCAAAGAATGAAACAACTTGAAGACAAGGTTGAAGAATTGCTTTCGAAAAATTATCACTTGGAAAATGAGGTTGCCAGATTAAAGAAATTAGTTGGCGAACGCATGGACTACAAAGACCATGACGGTGATTATAAAGATCATGACATCGATTACAAGGATGACGATGACAAAtga
RNA isolation
Cell cultures were grown in duplicate at 30° C to OD600 0.5 – 0.8 in 2% dextrose synthetic medium lacking leucine, isoleucine, and valine. Cells were treated with 0.5 μg/ml SM for 90 minutes to induce amino acid starvation. Following induction, cells from a 10 ml culture were collected by centrifugation and washed with 5 ml sterile water. The pellets were resuspended in 0.4 ml TES (10 mM Tris pH 7.5, 10 mM EDTA, 0.5% SDS) then mixed thoroughly with 0.4 ml acid phenol (Ambion, AM9722), and incubated for 1 hour at 65°, 1200 rpm in a Thermomixer R (Eppendorf). Phases were separated by centrifugation for 15 minutes at 4°, and the aqueous phase was transferred to fresh tubes and extracted again with 0.4 ml acid phenol followed by 0.3 ml chloroform. RNA was precipitated from a volume of 100 – 200 μl aqueous solution using 1/10 volume 3 M sodium acetate and 3 volumes ethanol and collected by centrifugation for 15 minutes at 4°. The RNA pellets were washed with 1 ml 80% ethanol, dried in a SpeedVac concentrator, and solubilized in 50 – 100 μl nuclease-free water (Ambion, AM9937). RNAs were stored at −80°.
Quantification and Statistical Analysis
RT qPCR and quantification
RNA concentrations were determined using a NanoDrop spectrophotometer (ThermoFisher), and 15 μg RNA from each sample was treated with RiboPure DNAsel (ThermoFisher, AM1926). The Transcriptor First Strand cDNA Synthesis Kit (Roche, 04897030001) was used to generate cDNA from 1.1 μg DNA-free RNA. Anchored oligo(dT)18 was annealed to mRNA for 10 minutes at 65°, then extended by Transcriptor RT for 1 hour at 50° before inactivation at 85° for 5 minutes. cDNAs were stored at −20°.
Gene-specific qPCR was performed in triplicate using primers near the 3’ end of the genes. Five microliter reactions containing Power SYBR Green PCR Mater Mix (ABI, 4367659) were assembled in 384-well plates (ABI, 4309849), and run on a QuantStudio 5 Real-Time PCR System (ABI). Relative amounts of DNA were calculated using a standard curve generated from serial dilutions of purified yeast genomic DNA from 10 – 0.001 ng. The detected quantities of ARG3 and HIS4 mRNAs were normalized to ACT1 mRNA to determine RNA expression levels.
| Primer | Sequence |
|---|---|
| ACT1-FP1 | TGGATTCCGGTGATGGTGTT |
| ACT1-RP1 | TCAAAATGGCGTGAGGTAGAGA |
| F-RT-ARG3 | TCGCATGTCTGAAATTCGGTAT |
| R-RT-ARG3 | CATCGACAATATCGGAATCCATT |
| HIS4-FP1 | GCACTGCCATTTTACCAAGTACTG |
| HIS4-RP1 | CTTGGTGGAGATGCAAACACA |
Enrichment score analysis
Values of fluorescence used to delimit the gates for sorting cells during selection with FACS were used to compute the activator enrichment score. The relative fluorescence units (RFU) correspond to the ratio of the mean fluorescence unit (FU) of bin X over binl (e.g. av.bin1 = (120+400) /2 = 260; av. bin2: (640+400)/2=520. Then 520/260=2).
| bins | lower | upper | RFU |
|---|---|---|---|
| 1 | 120 | 400 | 1.000 |
| 2 | 400 | 640 | 2.000 |
| 3 | 640 | 1000 | 3.154 |
| 4 | 1010 | 7500 | 4.577 |
Data and Code availability
Raw DNA sequence data generated during this study has been deposited at NCBI Sequence Read Archive (SRA) with accession number SAMN14330228. Custom code and algorithms can be found at: https://github.com/aerijman/ADpred_publication.
Supplementary Material
KEY RESOURCES TABLE
| REAGENT or RESOURCE | SOURCE | IDENTIFIER |
|---|---|---|
| Chemicals, Peptides, and Recombinant Proteins | ||
| 3-Amino 1,2,4-Triazole | Sigma-Aldrich | A-8056 |
| Sulfomeutron methyl | Sigma-Aldrich | 34224 |
| Deposited Data | ||
| Raw DNA sequencing data of AD-positive and negative data sets | NCBI Sequence Read Archive (SRA) | SAMN14330228 |
| Experimental Models: Organisms/Strains | ||
| Saccharomyces cerevisiae strain SHY1018 | Steven Petesch (FredHutch) | mat alpha ade2::hisG leu2 delta 0 lys2 delta 0 met15 delta 0 trp1 delta 63 ura3 delta 0 gcn4 delta::KanMX, Ch I integrated URA3::ARG3-CYC1p-eGFP |
| Oligonucleotides | ||
| DNA oligonucleotides | Integrated DNA technologies | Sequences given in Table S2; STAR Methods |
| nextera i7 barcodes | Illumina | UDP0001-UDP0096 |
| Recombinant DNA | ||
| plasmid pLH365 | Linda Warfield (FredHutch) | ARS CEN LEU2 + 1 Kb upstream DNA and the coding sequence for S cerevisiae Gcn4 residues 132-281. Relevant sequence in STAR Methods. |
| Software and Algorithms | ||
| Custom code and algorithms | Ariel Erijman | https://github.com/aerijman/ADpred_publication |
| Logistic Regression algorithm | https://scikit-learn.org/ | LogisticRegressionCV function |
| Neural Network algorithm | (Chollet, 2015) | Keras 2.1.6 |
| Neural Network algorithm | tensorflow.org | Tensorflow |
| Neural Network algorithm | (Kingma and Ba, 2014) | ADAM optimizer |
| Neural Network algorithm | https://scikit-learn.org/ | GridSearchCV method |
| Protein homology detection | (Zimmerman et al, 2018) | HHpred |
| Disordered Protein Predictions | (Dosztányi, 2017) | IUPred 1.0 |
| Statistical Analysis | SciPy.org | scipy.stats.hypergeom |
| Secondary Structure Prediction | (Cuff and Barton, 2000) | PSIPRED 4.0.1 |
| Other | ||
| AMPure XP beads | Beckman Coulter | A63881 |
| KOD extreme Polymerase | emdmillipore | 71975 |
| Phusion polymerase | New England BioLabs | M0530S |
| RiboPure DNAseI | ThermoFisher | AM1926 |
| Transcriptor First Strand cDNA Synthesis Kit | Roche | 04897030001 |
| Power SYBR Green PCR Mater Mix | ABI/ThermoFisher | 4367659 |
| Zirconia beads, 0.5 mm | Research Products International | 9834 |
Highlights:
A deep learning model for AD prediction was derived from a large set of synthetic ADs
The predictor (ADpred) identifies sequence features important for acidic AD function
AD sequence features explain the basis for the fuzzy binding mechanism of acidic ADs
Acidic ADs are enriched in yeast but not in Drosophila or human transcription factors
Acknowledgements
We thank Dan Tenenbaum for IT support, Steven Petesch for initial work on the project, Meera Hahn for advice on the deep learning NN, Bob Eisenman for analysis of Myc results, and Ziga Avsec for discussions on analysis of ADpred results. We also thank Kevin Struhl and Mark Ptashne for discussions and Brad Langhorst, Mark Ptashne and Lisa Tuttle for comments on the manuscript. This work was supported by NIH RO1 GM075114 to SH, an IN for the Hutch award to AE, NIH P41 GM103533 to WSN, a grant to JS and SSJ from the focus program SPP2191 of the Deutsche Forschungsgemeinschaft and NIH P30 CA015704 to FredHutch genomics and computational shared resource.
Footnotes
Publisher's Disclaimer: This is a PDF file of an unedited manuscript that has been accepted for publication. As a service to our customers we are providing this early version of the manuscript. The manuscript will undergo copyediting, typesetting, and review of the resulting proof before it is published in its final form. Please note that during the production process errors may be discovered which could affect the content, and all legal disclaimers that apply to the journal pertain.
Declaration of Interests
The authors declare no competing interests.
References
- Abedi M, Caponigro G, Shen J, Hansen S, Sandrock T, and Kamb A (2001). Transcriptional transactivation by selected short random peptides attached to lexA-GFP fusion proteins. BMC Molecular Biology 2, 10. [DOI] [PMC free article] [PubMed] [Google Scholar]
- Ancona M, Ceolini E, Öztireli C, and Gross M (2018). Towards better understanding of gradient-based attribution methods for Deep Neural Networks. arXiv:1711.06104. [Google Scholar]
- Arnold CD, Nemčko F, Woodfin AR, Wienerroither S, Vlasova A, Schleiffer A, Pagani M, Rath M, and Stark A (2018). A high-throughput method to identify trans-activation domains within transcription factor sequences. The EMBO Journal 37. [DOI] [PMC free article] [PubMed] [Google Scholar]
- Ba ANN, Yeh BJ, Dyk D van, Davidson, A.R., Andrews, B.J., Weiss, E.L., and Moses, A.M. (2012). Proteome-wide discovery of evolutionary conserved sequences in disordered regions. Science Signaling 5, rs1. [DOI] [PMC free article] [PubMed] [Google Scholar]
- Bateman A, Martin M-J, Orchard S, Magrane M, Alpi E, Bely B, Bingley M, Britto R, Bursteinas B, Busiello G, et al. (2018). UniProt: a worldwide hub of protein knowledge. Nucleic Acids Res 47, doi: 10.1093/nar/gky1049. [DOI] [PMC free article] [PubMed] [Google Scholar]
- Benatuil L, Perez JM, Belk J, and Hsieh C-M (2010). An improved yeast transformation method for the generation of very large human antibody libraries. Protein Engineering, Design & Selection: PEDS 23, 155–159. [DOI] [PubMed] [Google Scholar]
- Boija A, Klein IA, Sabari BR, Dall’Agnese A, Coffey EL, Zamudio AV, Li CH, Shrinivas K, Manteiga JC, Hannett NM, et al. (2018). Transcription Factors Activate Genes through the Phase-Separation Capacity of Their Activation Domains. Cell 175, 1–14. [DOI] [PMC free article] [PubMed] [Google Scholar]
- Brachmann CB, Davies A, Cost GJ, Caputo E, Li J, Hieter P, and Boeke JD (1998). Designer deletion strains derived from Saccharomyces cerevisiae S288C: a useful set of strains and plasmids for PCR-mediated gene disruption and other applications. Yeast (Chichester, England) 14, 115–132. [DOI] [PubMed] [Google Scholar]
- Bradner JE, Hnisz D, and Young RA (2017). Transcriptional Addiction in Cancer. Cell 168, 629–643. [DOI] [PMC free article] [PubMed] [Google Scholar]
- Brent R, and Ptashne M (1985). A eukaryotic transcriptional activator bearing the DNA specificity of a prokaryotic repressor. Cell 43, 729–736. [DOI] [PubMed] [Google Scholar]
- Brzovic PS, Heikaus CC, Kisselev L, Vernon R, Herbig E, Pacheco D, Warfield L, Littlefield P, Baker D, Klevit RE, et al. (2011). The acidic transcription activator Gcn4 binds the mediator subunit Gal11/Med15 using a simple protein interface forming a fuzzy complex. Molecular Cell 44, 942–953. [DOI] [PMC free article] [PubMed] [Google Scholar]
- Butler JE, and Kadonaga JT (2001). Enhancer-promoter specificity mediated by DPE or TATA core promoter motifs. Genes & Development 15, 2515–2519. [DOI] [PMC free article] [PubMed] [Google Scholar]
- Cherry JM, Hong EL, Amundsen C, Balakrishnan R, Binkley G, Chan ET, Christie KR, Costanzo MC, Dwight SS, Engel SR, et al. (2012). Saccharomyces Genome Database: the genomics resource of budding yeast. Nucleic Acids Res 40, D700–D705. [DOI] [PMC free article] [PubMed] [Google Scholar]
- Cho W-K, Spille J-H, Hecht M, Lee C, Li C, Grube V, and Cisse II (2018). Mediator and RNA polymerase II clusters associate in transcription-dependent condensates. Science (New York, NY) 361, 412–415. [DOI] [PMC free article] [PubMed] [Google Scholar]
- Chollet F (2015). keras. GitHub Repository. [Google Scholar]
- Chong S, Dugast-Darzacq C, Liu Z, Dong P, Dailey GM, Cattoglio C, Heckert A, Banala S, Lavis L, Darzacq X, et al. (2018). Imaging dynamic and selective low-complexity domain interactions that control gene transcription. Science (New York, NY) 361, eaar2555. [DOI] [PMC free article] [PubMed] [Google Scholar]
- Courey AJ, and Tjian R (1988). Analysis of Sp1 in vivo reveals mutiple transcriptional domains, including a novel glutamine-rich activation motif. Cell 55, 887–898. [DOI] [PubMed] [Google Scholar]
- Cress WD, and Triezenberg SJ (1991). Critical structural elements of the VP16 transcriptional activation domain. Science (New York, NY) 251, 87–90. [DOI] [PubMed] [Google Scholar]
- Cuff JA, and Barton GJ (2000). Application of multiple sequence alignment profiles to improve protein secondary structure prediction. Proteins: Structure, Function, and Bioinformatics 40, 502–511. [DOI] [PubMed] [Google Scholar]
- Currie SL, Doane JJ, Evans KS, Bhachech N, Madison BJ, Lau DKW, McIntosh LP, Skalicky JJ, Clark KA, and Graves BJ (2017). ETV4 and AP1 Transcription Factors Form Multivalent Interactions with three Sites on the MED25 Activator-Interacting Domain. Journal of Molecular Biology 429, 2975–2995. [DOI] [PMC free article] [PubMed] [Google Scholar]
- Das RK, Mao AH, and Pappu RV (2012). Unmasking functional motifs within disordered regions of proteins. Science Signaling 5, pe17. [DOI] [PubMed] [Google Scholar]
- De Guzman RND, Goto NK, Dyson HJ, and Wright PE (2006). Structural basis for cooperative transcription factor binding to the CBP coactivator. Journal of Molecular Biology 355, 1005–1013. [DOI] [PubMed] [Google Scholar]
- Donczew R, Warfield L, Pacheco D, Erijman A, and Hahn S (2020). Two roles for the yeast transcription coactivator SAGA and a set of genes redundantly regulated by TFIID and SAGA. Elife 9, e50109. [DOI] [PMC free article] [PubMed] [Google Scholar]
- Dosztányi Z (2017). Prediction of protein disorder based on IUPred. Protein Science 27, 331–340. [DOI] [PMC free article] [PubMed] [Google Scholar]
- Edgar RC (2010). Search and clustering orders of magnitude faster than BLAST. Bioinformatics (Oxford, England) 26, 2460–2461. [DOI] [PubMed] [Google Scholar]
- Erkina TY, Erkine AM (2016). Nucleosome distortion as a possible mechanism of transcription activation domain function. Epigenetics and chromatin 9:40. [DOI] [PMC free article] [PubMed] [Google Scholar]
- Erkine AM, Gross DS (2003). Dynamic chromatin alterations triggered by natural and synthetic activation domains. Journal of Biological Chemistry 278, 7755–7764. [DOI] [PubMed] [Google Scholar]
- Fields S, and Jang SK (1990). Presence of a potent transcription activating sequence in the p53 protein. Science (New York, NY) 249, 1046–1049. [DOI] [PubMed] [Google Scholar]
- Fischer JA, Giniger E, Maniatis T, and Ptashne M (1988). GAL4 activates transcription in Drosophila. Nature 332, 853–856. [DOI] [PubMed] [Google Scholar]
- Haberle V, Arnold CD, Pagani M, Rath M, Schernhuber K, and Stark A (2019). Transcriptional cofactors display specificity for distinct types of core promoters. Nature 32, 801. [DOI] [PMC free article] [PubMed] [Google Scholar]
- Hahn S (2018). Phase Separation, Protein Disorder, and Enhancer Function. Cell 175, 1723–1725. [DOI] [PubMed] [Google Scholar]
- Hahn S, and Young ET (2011). Transcriptional regulation in Saccharomyces cerevisiae: transcription factor regulation and function, mechanisms of initiation, and roles of activators and coactivators. Genetics 189, 705–736. [DOI] [PMC free article] [PubMed] [Google Scholar]
- Harbison CT, Gordon DB, Lee TI, Rinaldi NJ, Macisaac KD, Danford TW, Hannett NM, Tagne J-B, Reynolds DB, Yoo J, et al. (2004). Transcriptional regulatory code of a eukaryotic genome. Nature 431, 99–104. [DOI] [PMC free article] [PubMed] [Google Scholar]
- Helin K, Harlow E, and Fattaey A (1993). Inhibition of E2F-1 transactivation by direct binding of the retinoblastoma protein. Mol Cell Biol 13, 6501–6508. [DOI] [PMC free article] [PubMed] [Google Scholar]
- Hope IA, and Struhl K (1986). Functional dissection of a eukaryotic transcriptional activator protein, GCN4 of Yeast. Cell 46, 885–894. [DOI] [PubMed] [Google Scholar]
- Hope IA, Mahadevan S, and Struhl K (1988). Structural and functional characterization of the short acidic transcriptional activation region of yeast GCN4 protein. Nature 333, 635–640. [DOI] [PubMed] [Google Scholar]
- Jackson BM, Drysdale CM, Natarajan K, and Hinnebusch AG. (1996). Identification of seven hydrophobic clusters in GCN4 making redundant contributions to transcriptional activation. Mol Cell Biol 16, 5557–5571. [DOI] [PMC free article] [PubMed] [Google Scholar]
- Kingma DP, and Ba J (2014). Adam: A Method for Stochastic Optimization. ArXiv:1412.6980. [Google Scholar]
- Kuras L, and Thomas D. (1995). Functional analysis of Met4, a yeast transcriptional activator responsive to S-adenosylmethionine. Molecular and Cellular Biology 15, 208–216. [DOI] [PMC free article] [PubMed] [Google Scholar]
- Kussie PH, Gorina S, Marechal V, Elenbaas B, Moreau J, Levine AJ, and Pavletich NP (1996). Structure of the MDM2 Oncoprotein Bound to the p53 Tumor Suppressor Transactivation Domain. Science 274, 948–953. [DOI] [PubMed] [Google Scholar]
- LaBean TH, and Kauffman SA (1993). Design of synthetic gene libraries encoding random sequence proteins with desired ensemble characteristics. Protein Science 2, 1249–1254. [DOI] [PMC free article] [PubMed] [Google Scholar]
- Leuther KK, and Johnston SA. (1992). Nondissociation of GAL4 and GAL80 in vivo after galactose induction. Science (New York, NY) 256, 1333–1335. [DOI] [PubMed] [Google Scholar]
- Levine M, Cattoglio C, and Tjian R (2014). Looping back to leap forward: transcription enters a new era. Cell 157, 13–25. [DOI] [PMC free article] [PubMed] [Google Scholar]
- Locasale JW (2008). Allovalency revisited: An analysis of multisite phosphorylation and substrate rebinding. The Journal of Chemical Physics 128, 115106. [DOI] [PubMed] [Google Scholar]
- Ma J, and Ptashne M (1987a). Deletion analysis of GAL4 defines two transcriptional activating segments. Cell 48, 847–853. [DOI] [PubMed] [Google Scholar]
- Ma J, and Ptashne M (1987b). A new class of yeast transcriptional activators. Cell 51, 113–119. [DOI] [PubMed] [Google Scholar]
- Ma J, Przibilla E, Hu J, Bogorad L, and Ptashne M (1988). Yeast activators stimulate plant gene expression. Nature 334, 631–633. [DOI] [PubMed] [Google Scholar]
- Magoc T, and Salzberg SL (2011). FLASH: fast length adjustment of short reads to improve genome assemblies. Bioinformatics 27, 2957e2963. [DOI] [PMC free article] [PubMed] [Google Scholar]
- Oates ME, Romero P, Ishida T, acids MGN, and 2012. D2P2: database of disordered protein predictions. Academic.Oup.Com [DOI] [PMC free article] [PubMed] [Google Scholar]
- Oliphant TE (2007). Python for Scientific Computing. Computing in Science & Engineering 9, 10–20. [Google Scholar]
- Olsen JG, Teilum K, and Kragelund BB (2017). Behaviour of intrinsically disordered proteins in protein-protein complexes with an emphasis on fuzziness. 12, 269–9. [DOI] [PMC free article] [PubMed] [Google Scholar]
- Pacheco D, Warfield L, Brajcich M, Robbins H, Luo J, Ranish J, and Hahn S (2018). Transcription Activation Domains of the Yeast Factors Met4 and Ino2: Tandem Activation Domains with Properties Similar to the Yeast Gcn4 Activator. Molecular and Cellular Biology 38. [DOI] [PMC free article] [PubMed] [Google Scholar]
- Pascal E, and Tjian R (1991). Different activation domains of Sp1 govern formation of multimers and mediate transcriptional synergism. Gene Dev 5, 1646–1656. [DOI] [PubMed] [Google Scholar]
- Piskacek S, Gregor M, Nemethova M, Grabner M, Kovarik P, and Piskacek M (2007). Nine-amino-acid transactivation domain: establishment and prediction utilities. Genomics 89, 756–768. [DOI] [PubMed] [Google Scholar]
- Ponticelli AS, Pardee TS, and Struhl K (1995). The glutamine-rich activation domains of human Sp1 do not stimulate transcription in Saccharomyces cerevisiae. Mol Cell Biol 15, 983–988. [DOI] [PMC free article] [PubMed] [Google Scholar]
- Ptashne M, and Gann A (1997). Transcriptional activation by recruitment. Nature 386, 569–577. [DOI] [PubMed] [Google Scholar]
- Ptashne M, and Gann AA (1990). Activators and targets. Nature 346, 329–331. [DOI] [PubMed] [Google Scholar]
- Ravarani CN, Erkina TY, Baets GD, Dudman DC, Erkine AM, and Babu MM (2018). High-throughput discovery of functional disordered regions: investigation of transactivation domains. Molecular Systems Biology 14, e8190. [DOI] [PMC free article] [PubMed] [Google Scholar]
- Raycroft L, Wu H, and Lozano G (1990). Transcriptional activation by wild-type but not transforming mutants of the p53 anti-oncogene. Science 249, 1049–1051. [DOI] [PMC free article] [PubMed] [Google Scholar]
- Regier JL, Shen F, and Triezenberg SJ (1993). Pattern of aromatic and hydrophobic amino acids critical for one of two subdomains of the VP16 transcriptional activator. Proceedings of the National Academy of Sciences of the United States of America 90, 883–887. [DOI] [PMC free article] [PubMed] [Google Scholar]
- Rothermel BA, Thornton JL, and Butow RA (1997). Rtg3p, a basic helix-loop-helix/leucine zipper protein that functions in mitochondrial-induced changes in gene expression, contains independent activation domains. The Journal of Biological Chemistry 272, 19801–19807. [DOI] [PubMed] [Google Scholar]
- Ruden DMD, Ma JJ, Li YY, Wood KK, and Ptashne MM (1991). Generating yeast transcriptional activators containing no yeast protein sequences. Nature 350, 250–252. [DOI] [PubMed] [Google Scholar]
- Sadowski I, Ma J, Triezenberg S, and Ptashne M (1988). GAL4-VP16 is an unusually potent transcriptional activator. Nature 335, 563–564. [DOI] [PubMed] [Google Scholar]
- Schmidhuber J (2015). Deep learning in neural networks: An overview. Neural Networks 61, 85–117. [DOI] [PubMed] [Google Scholar]
- Schwank S, Ebbert R, Rautenstrauss K, Schweizer E, and Schuller HJ (1995). Yeast transcriptional activator INO2 interacts as an Ino2p/Ino4p basic helix-loop-helix heteromeric complex with the inositol/choline-responsive element necessary for expression of phospholipid biosynthetic genes in Saccharomyces cerevisiae. Nucleic Acids Research 23, 230–237. [DOI] [PMC free article] [PubMed] [Google Scholar]
- Shrinivas K, Sabari BR, Coffey EL, Klein IA, Boija A, Zamudio AV, Schuijers J, Hannett NM, Sharp PA, Young RA, et al. (2019). Enhancer Features that Drive Formation of Transcriptional Condensates. Molecular Cell 75, 549–561.e7. [DOI] [PMC free article] [PubMed] [Google Scholar]
- Sigler PB (1988). Acid blobs and negative noodles. Nature 333, 210–212. [DOI] [PubMed] [Google Scholar]
- Spitz F, and Furlong EEM (2012). Transcription factors: from enhancer binding to developmental control. Nature Reviews Genetics 13, 613–626. [DOI] [PubMed] [Google Scholar]
- Staller MV, Holehouse AS, Swain-Lenz D, Das RK, Pappu RV, and Cohen BA (2018). A High-Throughput Mutational Scan of an Intrinsically Disordered Acidic Transcriptional Activation Domain. Cell Systems 6, 444–455. [DOI] [PMC free article] [PubMed] [Google Scholar]
- Stampfel G, Kazmar T, Frank O, Wienerroither S, Reiter F, and Stark A (2015). Transcriptional regulators form diverse groups with context-dependent regulatory functions. Nature 528, 147–151. [DOI] [PubMed] [Google Scholar]
- Struhl K (1987). Promoters, activator proteins, and the mechanism of transcriptional initiation in yeast. Cell 49, 295–297. [DOI] [PubMed] [Google Scholar]
- Struhl K (1988). The JUN oncoprotein, a vertebrate transcription factor, activates transcription in yeast. Nature 332, 649–650. [DOI] [PubMed] [Google Scholar]
- Sugase K, Dyson HJ, and Wright PE (2007). Mechanism of coupled folding and binding of an intrinsically disordered protein. Nature 447, 1021–1025. [DOI] [PubMed] [Google Scholar]
- Sundararajan M, Taly A, and Yan Q (2017). Axiomatic Attribution for Deep Networks. arXiv:1703.01365. [Google Scholar]
- Tuttle LM, Pacheco D, Warfield L, Luo J, Ranish J, Hahn S, and Klevit RE (2018). Gcn4-Mediator Specificity Is Mediated by a Large and Dynamic Fuzzy Protein-Protein Complex. Cell Rep 22, 3251–3264. [DOI] [PMC free article] [PubMed] [Google Scholar]
- Tuttle LM, Pacheco D, Warfield L, Hahn S, and Klevit RE (2019). Mediator subunit Med15 dictates the conserved “fuzzy” binding mechanism of yeast transcription activators Gal4 and Gcn4. Biorxiv 840348. [DOI] [PMC free article] [PubMed] [Google Scholar]
- Uesugi M, Nyanguile O, Lu H, Levine AJ, and Verdine GL (1997). Induced alpha Helix in the VP16 Activation Domain upon Binding to a Human TAF. Science 277, 1310–1313. [DOI] [PubMed] [Google Scholar]
- Uversky VN (2013). The alphabet of intrinsic disorder. Intrinsically Disord Proteins 1, e24684. [DOI] [PMC free article] [PubMed] [Google Scholar]
- Vaquerizas JM, Kummerfeld SK, Teichmann SA, and Luscombe NM (2009). A census of human transcription factors: function, expression and evolution. Nat Rev Genet 10, 252–263. [DOI] [PubMed] [Google Scholar]
- Wales DJ, Doye JPK (1997) Global optimization by basin-hopping and the lowest energy structures of Lennard-Jones clusters containing up to 110 atoms. J. Phys. Chem. A, 101, 5111–5116. [Google Scholar]
- Warfield L, Tuttle LM, Pacheco D, Klevit RE, and Hahn S (2014). A sequence-specific transcription activator motif and powerful synthetic variants that bind Mediator using a fuzzy protein interface. Proceedings of the National Academy of Sciences 111, E3506–13. [DOI] [PMC free article] [PubMed] [Google Scholar]
- Wei Y, Resetca D, Li Z, Johansson-Akhe I, Ahlner A, Helander S, Wallenhammar A, Morad V, Raught B, Wallner B, et al. (2019). Multiple direct interactions of TBP with the MYC oncoprotein. Nat Struct Mol Biol 26, 1035–1043. [DOI] [PubMed] [Google Scholar]
- Weintraub H, Dwarki VJ, Verma I, Davis R, Hollenberg S, Snider L, Lassar A, and Tapscott SJ (1991). Muscle-specific transcriptional activation by MyoD. Gene Dev 5, 1377–1386. [DOI] [PubMed] [Google Scholar]
- Zimmermann L, Stephens A, Nam S-Z, Rau D, Kübler J, Lozajic M, Gabler F, Söding J, Lupas AN, and Alva V (2018). A Completely Reimplemented MPI Bioinformatics Toolkit with a New HHpred Server at its Core. Journal of Molecular Biology 430, 2237–2243. [DOI] [PubMed] [Google Scholar]
Associated Data
This section collects any data citations, data availability statements, or supplementary materials included in this article.
Supplementary Materials
Data Availability Statement
Raw DNA sequence data generated during this study has been deposited at NCBI Sequence Read Archive (SRA) with accession number SAMN14330228. Custom code and algorithms can be found at: https://github.com/aerijman/ADpred_publication.