

SUMMARY
Free-living mammals such as humans and wild mice display heightened immune activation compared with artificially maintained laboratory mice. These differences are partially attributed to microbial exposure as laboratory mice infected with pathogens exhibit immune profiles more closely resembling that of free-living animals. Here, we examine how colonization by microorganisms within the natural environment contributes to immune system maturation by releasing inbred laboratory mice into an outdoor enclosure. In addition to enhancing differentiation of T cell populations previously associated with pathogen exposure, outdoor release increased circulating granulocytes. However, these rewilded mice were not infected by pathogens previously implicated in immune activation. Rather, immune system changes were associated with altered microbiota composition with notable increases in intestinal fungi. Fungi isolated from rewilded mice were sufficient to increase circulating granulocytes. These findings establish a model to investigate how the natural environment impacts immune development and show that sustained fungal exposure impacts granulocyte numbers.
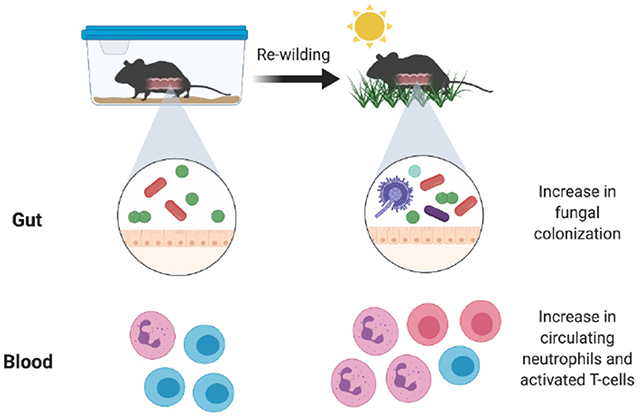
Graphical Abstract
eTOC blurb
Laboratory mice are maintained in artificial conditions that potentially impact immunity. In this issue of Cell Host & Microbe, Yeung et al. (2020) demonstrate that mice released into a wild enclosure display increases in circulating granulocytes that are associated with an altered microbiota, notably expansion of fungi.
INTRODUCTION
The house mouse is the most prevalent mammalian model organism used in biomedical research and has enabled fundamental advances in basic immunology. Yet, this ubiquitous model fails to recreate certain aspects of human immunity. Inbred laboratory mice and adult humans differ in the proportion of leukocyte subsets, transcriptional responses to microbial challenges, and other immune parameters (Masopust et al., 2017; Tao and Reese, 2017). Such differences may limit the predictive value of experiments with mice when studying complex inflammatory and infectious diseases, resulting in significant shortcomings in translating laboratory observations to humans.
Recent findings suggest that this shortcoming of the rodent model may be due to the specific pathogen free (SPF) environment in which they are maintained. Wild mice and pet store mice, both of which are exposed to a litany of pathogens that are typically excluded from SPF facilities, display an abundance of differentiated memory T cells that more closely resembles the state of immunity in adult humans (Abolins et al., 2017; Beura et al., 2016; Choi et al., 2019). Similarly, transferring embryos from lab mice into wild mice generates commensal- and pathogen-exposed offspring (wildlings) that more faithfully recreate human immunity than standard SPF mice, including the unresponsiveness to immunotherapies that failed in clinical trials (Rosshart et al., 2019). Sequentially infecting SPF mice with 3 viruses and a helminth shifts the gene expression profile of peripheral blood mononuclear cells (PBMCs) towards that of pet store mice and adult humans (Reese et al., 2016), further highlighting the role for pathogen experience in normalizing the immune system. SPF mice are also distinguished from free-living mammals by the lack of exposure to potentially immuno-stimulatory members of the microbiota that are absent in a laboratory animal facility. For example, the offspring of germ-free mice inoculated with ileocecal contents from wild mice display increased resistance to influenza infection and colorectal tumorigenesis (Rosshart et al., 2017). However, the specific effect of the naturally-acquired microbiota on immune development is unclear, and the non-bacterial members of the wild microbiota such as fungi have not been examined in detail.
We recently described a mesocosm system in which SPF mice are ‘rewilded’ through controlled release into an outdoor enclosure facility (Leung et al., 2018). In contrast to approaches that rely on catching wild mice, our experimental system allows us to control genetics and the timing of environmental exposure by releasing lab-bred mice into a natural environment. We can thus systematically compare genetically defined mice maintained outdoors with control mice of the same genotype kept in a conventional animal facility. Another key feature of the enclosure is that a zinced iron wall excludes predators and rodents harboring disease-causing infectious agents, while allowing exposure to natural soil, vegetation, and weather. Mice rewilded through transient release into the enclosure acquire a bacterial microbiota characterized by increased diversity and display heightened susceptibility to helminth infection (Leung et al., 2018).
In a companion manuscript (Lin et al), we describe deep immune-profiling of rewilded mice to identify a series of changes that occur to the immune system upon exposure to the natural environment, and apply computational analyses to infer the impact of genetic and environmental variables. Here, we tested the hypothesis that colonization by microorganisms present in the natural environment contribute to the maturation of the immune system that occurs in free-living mammals. We found that rewilded mice display an increase in central and effector T cells similar to pet store mice infected with pathogens. We also identified an additional feature, an increase in granulocyte populations in the blood and lymph node. These changes were not associated with pathogen infection, and instead, were associated with an altered gut microbiota characterized by a substantial increase in fungi. Colonization of lab mice with the model fungus Candida albicans or fungi isolated from rewilded mice recreated the expansion of granulocytes. These findings implicate fungi and other members of the gut microbiota in the maturation of the immune system, and suggest that differences between lab mice and humans are due, in part, to lack of colonization by environmental microbes.
RESULTS
Rewilding increases the maturation of lymphocytes
To determine the consequences of microbial colonization and exposure to the natural environment on the steady-state immune system, we applied multicolor flow cytometry to analyze the immune cell composition of blood and mesenteric lymph nodes (MLNs) from SPF mice aged 6-8 weeks old at the time of release into the enclosure and captured 6-7 weeks later. Details of the cohort of rewilded mice are described in the Methods and includes male and female wild-type C57BL6/J mice, and also an additional cohort of mice harboring mutations in inflammatory bowel disease (IBD) genes (Atg16L1 and Nod2) described in the companion study (Lin et. al.). Matched control mice were maintained under SPF conditions in the institutional vivarium, herein referred to as lab mice. The initial flow cytometry analyses were performed on all rewilded and lab mice as genotype did not affect the outcome (Lin et. al.). We provide the detailed breakdown by Atg16L1 and Nod2 mutation status in subsequent analyses.
In contrast to adult humans and pet store mice, SPF mice and human neonates lack differentiated memory CD8+ T cells harboring CD44 and other markers of antigen experience (Beura et al., 2016). We found that release into the outdoor enclosure led to the acquisition of these signatures of differentiation in T cells from the blood and MLNs. Compared with lab control mice, rewilded mice had CD8+ T cells with surface markers identifying them as CD62LloCD44hi effector memory (TEM) and CD62LhiCD44hi central memory (TCM) populations, and a corresponding decrease in CD62LhiCD44lo naïve T cells (Figures 1A–1B). Similar increases in differentiated CD4+ T cell populations were observed in rewilded mice (Figures S1A and S1B). We also found an increase in CD8+ and CD4+ T cells expressing activation markers KLRG1 and CD25, respectively (Figures 1C and S1C). Another striking feature of pet shop mice is the increase in mucosally-distributed T cells compared with lab mice. Histological examination of the small intestine from rewilded mice revealed an increased number of CD8+ cells (Figure 1D). Despite these features of enhanced immune activation, we did not detect inflammatory lesions in intestinal sections (Figure 1D). Thus, rewilding is associated with a general enhancement in T cell maturation resembling observations made in pet store mice.
Figure 1. Rewilding Alters the Proportion of Lymphoid Cell Subsets.
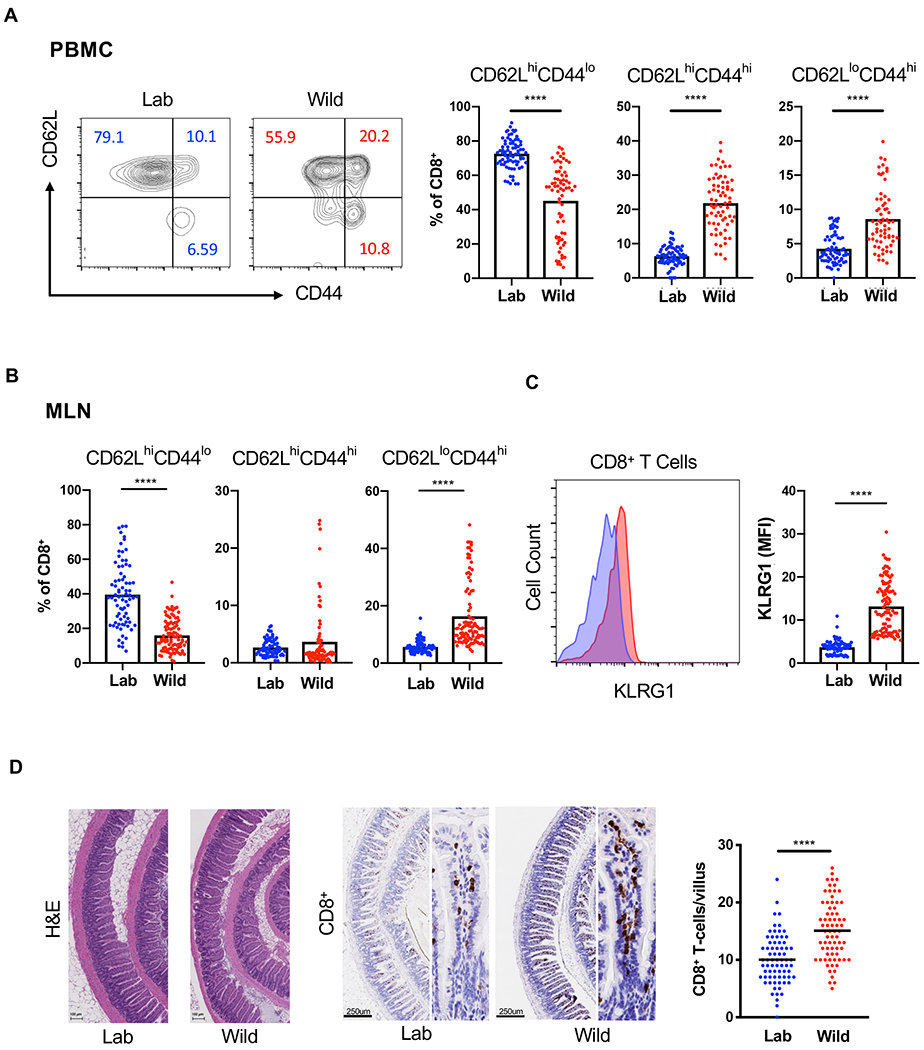
(A) Representative flow cytometry plots and quantification of CD62LhiCD44lo, CD62LhiCD44hi and CD62LloCD44hi CD8+ T cells in the peripheral blood of rewilded mice (Wild) and control mice maintained in the laboratory condition (Lab). Cells were gated on Live+CD45+Myeloid− CD3+CD19−CD8+. N = 79 lab and 101 rewilded mice (B) Quantification of the indicated CD8+ T cells in the mesenteric lymph nodes (MLNs). (C) Mean fluorescent intensity of MLN CD8+ T cells expressing activation marker KLRG1. (D) Representative images of small intestinal sections stained with H&E or anti-CD8 antibodies and quantification. N = 50 villi from 5 mice per condition. Mean and spread are shown. **** P < 0.0001 by two-tailed Student’s t-test between groups, (A) to (D). See also Figure S1.
Rewilding leads to an increase in granulocytes
We complemented the above flow cytometric and microscopic analyses of T cells by performing RNA-Seq on MLNs from the same lab and rewilded mice described above. 112 genes were differentially regulated by >1.5-fold, the majority of which have known immune-related functions and were upregulated in the rewilded condition (Figure 2A). Consistent with the aforementioned changes in T cells, pathway analyses indicated that release into an outdoor enclosure increased the expression of genes involved in lymphocyte signaling, differentiation, and migration. Other differentially regulated genes represented pathways associated with polarization of myeloid cell types, such as IL-12 production and iNOS signaling (Figure 2A). Wild mice have been shown to harbor changes in myeloid sub-populations (Abolins et al., 2017). Therefore, we examined the flow cytometry data for potential changes to non-lymphocyte cell types. We found a striking increase in the side scatter high (SSChi) fraction of PBMCs and cells harboring myeloid markers in rewilded mice compared with lab mice, indicating that release into the outdoor enclosure induced an enrichment in granulocytes (Figure 2B). Similarly, we observed an increase in both the proportion and total numbers of neutrophils in the MLNs of rewilded mice (Figure 2C). These findings indicate that rewilding leads to substantial changes in granulocyte numbers and identifies expansion of this leukocyte subset as another key difference in addition to differentiated T cells between the immune system of lab mice and mice exposed to the natural environment.
Figure 2. Rewilding Leads to an Expansion in Granulocytes.
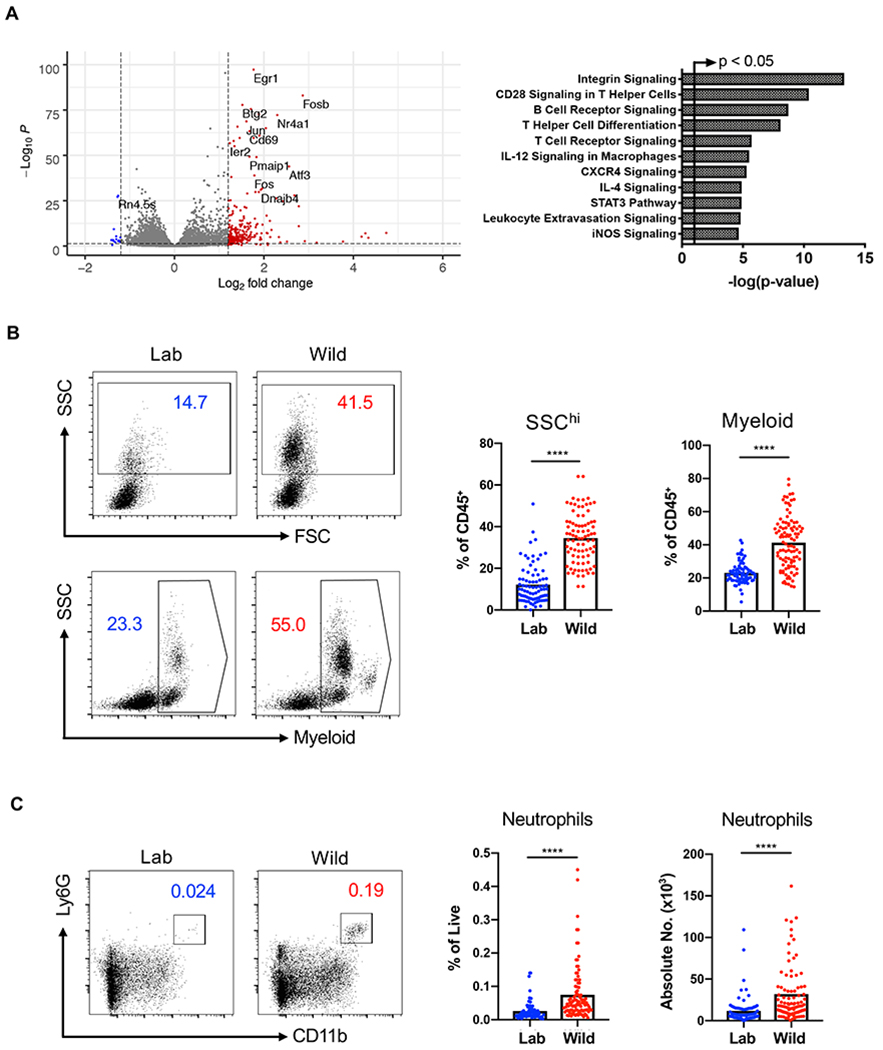
(A) Functional classification of 112 differentially regulated genes (log2FC>1.5) by Ingenuity pathway analysis comparing RNA-Seq of MLN cells from lab and rewilded mice. The arrowed line marks where the p-value becomes less than 0.05. N = 40 lab and 46 rewilded mice. (B) Representative forward scatter (FSC) and side scatter (SSC) flow cytometry plots and quantification of SSChi cells (granulocytes) and myeloid cells in the peripheral blood of lab and rewilded mice. All cells were gated on Live+CD45+ and myeloid cells were identified by cell surface markers CD11b/CD11c/DX5. N = 79 lab and 101 rewilded mice. (C) Quantification of the absolute number of MLN cells expressing neutrophil markers (CD11b+Ly6G+). Mean and spread are shown. **** P < 0.0001 by two-tailed Student’s t-test between groups, (B) to (C).
Lymph node cells from rewilded mice display enhanced responses to microbial antigens
The ability of immune cells to respond to microbes can be assessed by measuring cytokine production upon stimulation with antigens ex vivo. At the time of sacrifice, we distributed single cell suspensions of MLNs from rewilded and lab mice into 96-well plates pre-coated with a panel of UV-killed microbes (Figure 3A) that are frequently found in the soil, surfaces of the human body, or both: Bacillus subtilis, Pseudomonas aeruginosa, Clostridium perfringens, Candida albicans, Bactroides vulgatus, and Staphylococcus aureus. We also included PBS as a negative control to establish baseline production of soluble factors and αCD3/CD28 beads as a positive control that non-specifically activates T cells. A multiplex bead array was used to quantify 13 cytokines and chemokines in the supernatant following 48-hour incubation.
Figure 3. Lymph Node Cells from Rewilded Mice Display Increased Cytokine Production in Response to Microbial Stimulation.
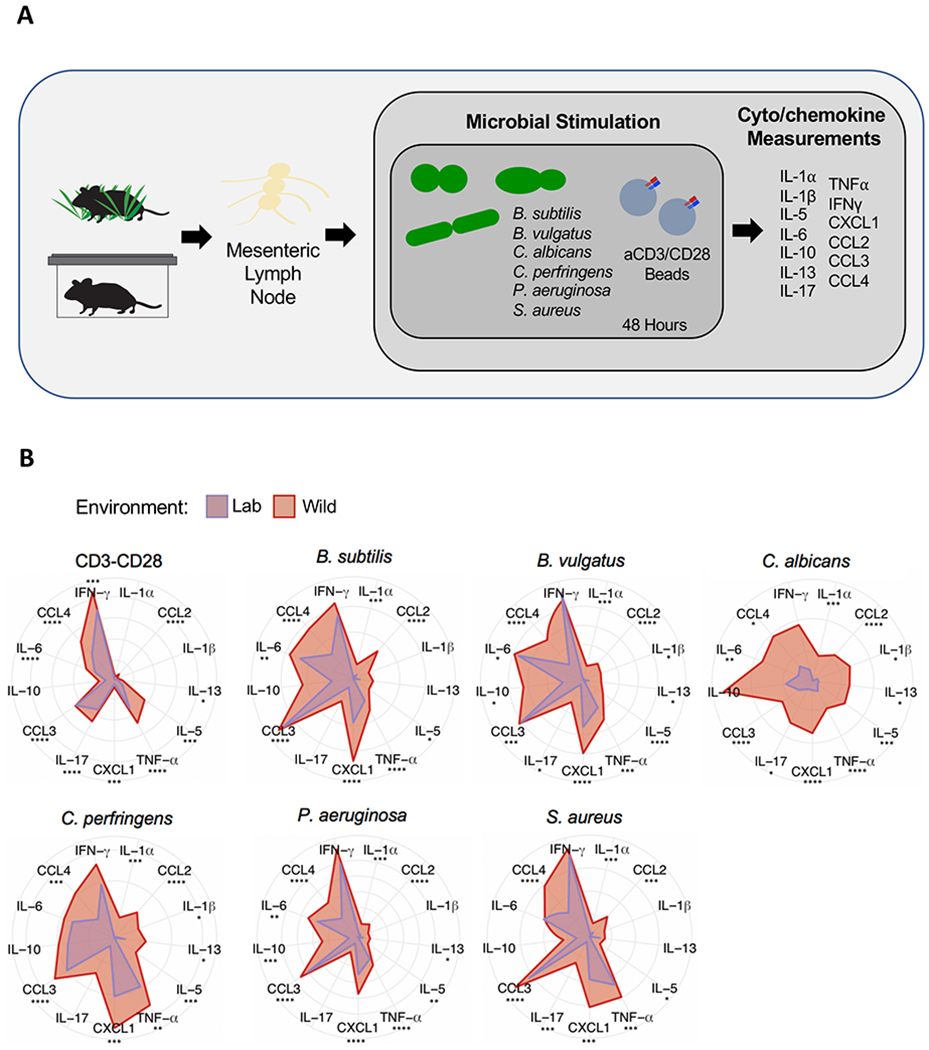
(A) Schematic of the experimental design: single cell suspensions of MLNs from lab and rewilded mice were distributed in 96 well plates containing αCD3/CD28 beads or the following microbes: Bacillus subtilus, Bacteroides vulgatus, Candida albicans, Clostrdium perfringens, and Staphylococcus aureus. The indicated cytokines and chemokines were measured in the supernatant after 48 hours of stimulation. (B) Radar plots showing the amount of each indicated cytokine/chemokine produced in response to the microbial stimulants. Data represents Log2 fold change over MLN cells unstimulated PBS controls. N = 40 lab and 47 rewilded mice. Mean is shown. * P < 0.05, ** P < 0.01, *** P < 0.001, **** P < 0.0001 by two-tailed Student’s t-test between groups, (B).
MLN cells derived from rewilded mice responded to microbial or T cell stimulation by secreting generally higher amounts of cytokines and chemokines compared with cells derived from lab mice (Figure 3B). The exact cytokines that were over-produced were specific to the microbial stimulant, although some general trends include 2–10-fold increases in IL-17, CXCL1, CCL3, and IL-10. Ex vivo stimulation with the model fungus C. albicans, which frequently colonizes the gastrointestinal tract of humans, led to a particularly striking difference between cells from rewilded versus lab mice. These results suggest that immune cells of rewilded mice are in a hyperactivated state due to exposure to microbes, including fungi.
Rewilded mice display differential colonization by microbes
Pet store mice and wild mice harbor a multitude of pathogens, some of which are lethal when transmitted to co-housed lab mice (Beura et al., 2016). Rewilded mice are predicted to display reduced exposure to disease-causing pathogens because our enclosure prevents contact with wild rodents. We did not trap a single rodent other than our released lab animals during the entirety of the experiment. To screen for pathogen exposure, we subjected representative mice to a comprehensive serology panel similar to the one that identified the presence of infections in pet store mice (Beura et al., 2016). Rewilded mice were sero-negative for all 24 of the pathogens tested in this panel (Table S1). Also, an extended PCR-based analysis that includes a skin swab was negative for most agents (see below), and we did not detect Tritrichomonas protozoan species recently shown to mediate expansion of granulocytes in mice (Chudnovskiy et al., 2016) (Table S2).
Through the above PCR-based assay, several agents were detected in a subset of rewilded mice (15-95%) that may be considered opportunistic pathogens. These microbes are often described as commensals depending on the context. Still, we considered the possibility that these hits from the PCR panel were responsible for the effect of rewilding on immunity. Staphylococcus aureus was detected in the stool of most of the rewilded mice examined. S. aureus is a commensal bacterium of the skin in humans and typically not considered a gastrointestinal pathogen, although fecal-oral transmission may be important for spread of antibiotic resistant strains associated with invasive diseases in humans and can be found in the intestines of mice following experimental inoculation (Kernbauer et al., 2014b). Sequencing of the S. aureus strain we isolated from a representative rewilded mouse revealed the presence of an intact β-hemolysin gene that was not disrupted by prophage φSa3, which encodes immune modulatory proteins that are highly human specific, indicating that rewilded mice are likely colonized by an animal strain rather than a clinical isolate (McCarthy et al., 2012; Price et al., 2012) (Table S3). We found that a few of the mice within our SPF facility harbored S. aureus, suggesting that this bacterium was already present in a subset of mice prior to release into the outdoor enclosure and was spread within the enclosure. Thus, the presence of S. aureus is not unique to the rewilding conditions.
The PCR panel also indicated that a subset of rewilded mice harbored other microbes that are frequently found in SPF facilities, such as Proteus and Klebsiella species that belong to the Enterobacteriaceae family of pathobionts (Table S2. We were able to isolate Enterobacteriaceae species including Citrobacter koseri from stool of rewilded mice plated on MacConkey agar, which selects for Gram-negative bacilli from the gut. We inoculated mice with pooled Enterobacteriaceae species isolated from rewilded mice, and although we detected stable colonization, T cell and granulocyte population were unchanged (Figures S2A and S2B). These results are consistent with our observation that only a subset of rewilded mice were positive for this group of bacteria by PCR, and indicate that Enterobacteriaceae species are unlikely to be sufficient to mediate the changes to the immune system observed in rewilded mice. However, it is possible that these and other types of bacteria work in concert as part of an altered microbiota community, which we examine below.
16S rDNA sequencing of stool samples indicated that rewilding was associated with enrichment of Bacteroides and related taxa, and a decrease in Firmicutes such as Lactobacillus and Faecalibaculum species (Figures 4A–4D). These changes were modest when considering the previously reported large increase in Bacteroides abundance in the microbiota of wild mice compared with SPF mice (Rosshart et al., 2017), likely reflecting the fact that in our system, adult mice are released into the wild environment with an intact microbiota. Although we did not detect a change in the number of taxa represented in rewilded mice compared with lab mice (Figure 4B), it is possible that the coding capacity of the microbiota is altered following release into the outdoor enclosure. Therefore, we performed shotgun sequencing on a subset of WT mice. Principle coordinate analysis (PCA) indicated that the communities of microbes segregate by environment (lab versus wild) (Figure 4E). 184 gene families were identified as differentially regulated, many of which were attributed to the Parabacteroides genus and are associated with metabolic processes (Figure S3). Together with the 16S sequencing results, these findings indicate that the composition and gene content of the bacterial microbiota is different in lab and rewilded mice.
Figure 4. Altered Immunity in Rewilded Mice is Associated with Microbial Exposure in the Natural Environment.
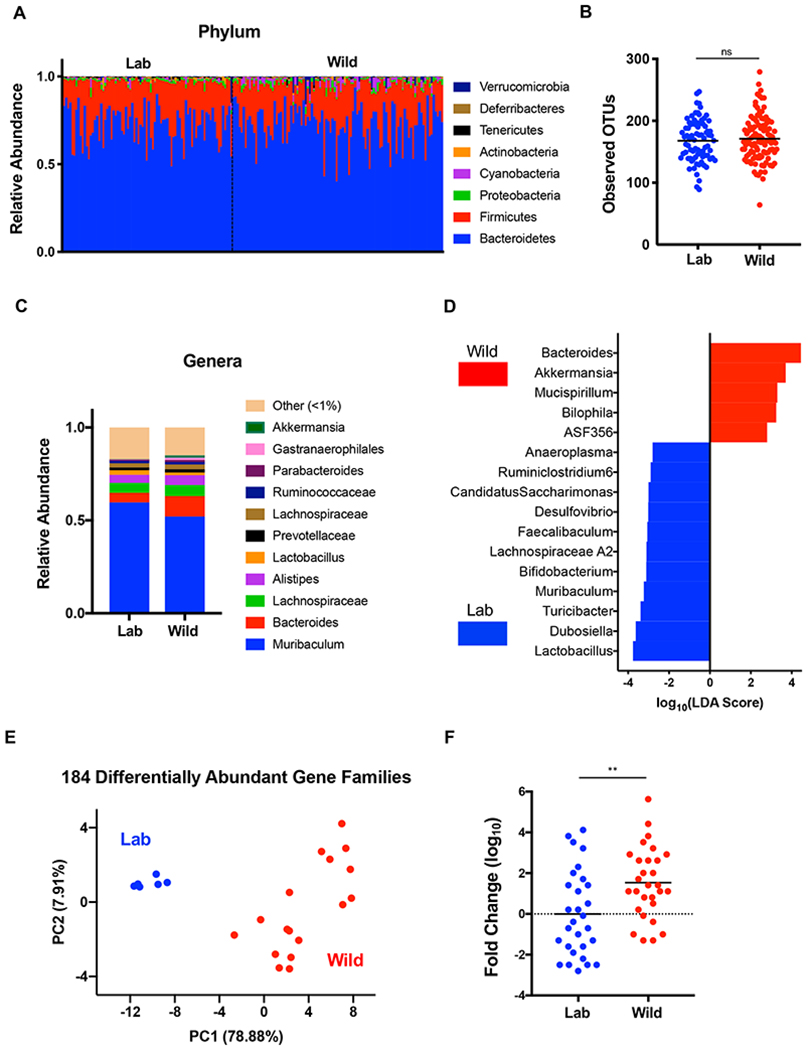
(A) Relative abundance of phylum level taxa that constitute the fecal microbial community of lab (Lab) and rewilded (Wild) mice as determined by 16S sequencing. N = 79 lab and 102 rewilded mice. (B) Alpha diversity quantification through number of operational taxonomic units (OTUs). (C) Stacked bar plot of mean relative abundances of genus level taxa. (D) Bacterial taxa from (C) significantly enriched in lab versus wild conditions as determined by linear discriminant analysis effect size (LEfSe) analysis using a LDA threshold score of 2.5. (E) Principle coordinate analysis of differential microbial gene families abundance between lab and wild mice determined by shotgun sequencing. N = 6 lab and 17 rewilded mice. (F) Quantification of relative fungal burden in stool of lab and rewilded mice as determined by qPCR of the internal transcribed space (ITS) region normalized to the average of lab mice. Mean and spread are shown. N = 45 lab and 50 rewilded mice. **** P <0.01 by two-tailed Student’s t-test between groups, (F). See also Figure S3 and S4.
Our experiments in which we quantified cytokine production by antigen-stimulated MLN cells suggest that rewilding is associated with reactivity to fungi. We mined the shotgun sequencing reads for fungal genomes and found that samples from rewilded mice included sequences corresponding to fungal taxa such as Candida (Figure S4). Quantification of fungal burden by qPCR of the conserved internal transcribed spacer (ITS) region of ribosomal RNA on the same samples as above indicated that rewilded mice harbor a significant increase in intestinal colonization by fungi compared with lab mice (Figure 4F). These findings raise the possibility that acquisition of fungi contribute to changes in immunity. Below, we analyze the effect of Atg16l1 and Nod2 mutations on immune parameters, and subsequently examine the effect of introducing fungi into lab mice.
Atg16L1 and Nod2 mutations are associated with signs of disease but do not affect immune cell populations
ATG16L1 and NOD2 are among the most highly investigated susceptibility genes for IBD, an inflammatory disorder of the gut that is associated with alterations in the microbiota (Wlodarska et al., 2015). Inhibition of ATG16L1, which mediates the cellular degradative process of autophagy, leads to excess inflammasome activity and epithelial defects in models of intestinal inflammation (Cadwell et al., 2008; Cadwell et al., 2010; Lassen et al., 2014; Murthy et al., 2014; Saitoh et al., 2008). NOD2 is a cytosolic bacterial sensor that is important for host defense, as demonstrated by the heightened sensitivity of Nod2−/− mice to inflammation and mortality during oral infection by the extracellular Gram-negative pathogen Citrobacter rodentium (Kim et al., 2011). Although NOD2 can function upstream of ATG16L1 to promote immunity against intracellular bacteria or antigen presentation (Chu et al., 2016; Cooney et al., 2010; Travassos et al., 2010), Atg16l1 mutant mice display enhanced immunity towards C. rodentium (Marchiando et al., 2013; Martin et al., 2018), indicating that mutations in these genes can lead to different outcomes when responding to microbial colonization of the gut. Therefore, we included both mice harboring the IBD variant of Atg16l1 (T316A) and Nod2−/− mice in the cohort of animals released into the enclosure.
Only a subset of mice in the enclosure displayed any sign of disease. Rewilded Atg16l1T316A homozygous (5 out of 24) and heterozygous mice (1 out of 27) presented with diarrhea, and none of the other genotypes of rewilded mice or lab mice showed watery stool. Interestingly, all the Atg16l1 mutant mice with diarrhea were collected during the second week of the capture (Figure 5A). Although diarrhea was not observed in Nod2−/− mice at any point during the experiment, many of them failed to gain weight following release into the enclosure (Figure 5B). Despite these observations, we did not detect intestinal inflammation by histopathology in small intestinal or colonic tissue sections from representative mice under any condition (data not shown).
Figure 5. Atg16L1 and Nod2 Variants are Associated with Disease Pathology But Do Not Affect Immune Cell Populations.
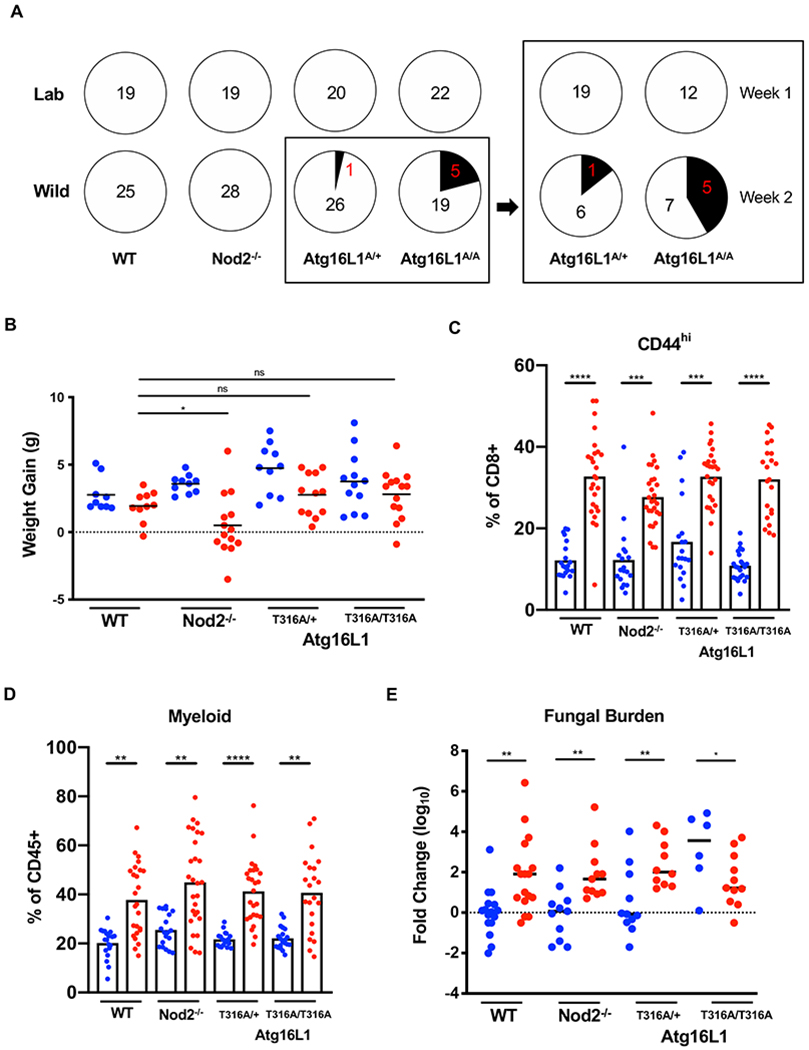
(A) Number of mice presenting diarrhea at time of sacrifice for lab and rewilded wildtype (WT), Atg16l1, and Nod2 mutant mice. Right panel displays number of Atg16l1T300A het (A/+) and homozygous (A/A) mice with diarrhea when sacrificed during the first week or second week of trapping. N > 11 mice per group (B) Weight gain of the WT, Atg16l1, and Nod2 mutant mice over a period of 7 weeks in Lab (blue) and Wild (red) conditions. N > 20 mice per group (C) Quantification of CD44+CD8+ T cells in the peripheral blood of WT, Atg16l1, and Nod2 mutant mice in Lab (blue) and Wild (red) conditions. (D) Quantification of myeloid cells as identified by cell surface markers CD11b/CD11c/DX5. (E) Quantification of relative fungal burden in stool of WT, Atg16l1, and Nod2 mutant mice in Lab (blue) and Wild (red) conditions as determined by ITS qPCR. N > 6 mice per group. Mean and spread are shown. * P < 0.05, ** P < 0.01, *** P < 0.001, **** P < 0.0001 by two-tailed Student’s t-test between groups, (B) to (E). See also Figure S5.
Next, we examined whether mutation in these IBD genes affect the expansion of differentiated T cells and myeloid cells, the focus of this study. We found that these leukocyte populations in the blood displayed similar increases in rewilded Atg16l1 and Nod2 mutant mice as their wild-type counterparts (Figures 5C and 5D). We also examined whether Atg16l1 and Nod2 mutant mice differ in their microbiota composition. The results from breaking down the 16S analyses by genotype were similar to those from analyses of the pooled data in Figure 4. Generally, genera that were enriched or reduced in rewilded WT mice were also enriched or reduced in rewilded Atg16l1 and Nod2 mutant mice, and the total number of observed taxa were similar across all conditions (Figures S5A and S5B).
The more striking effect of genotype was on fungal colonization. We found that lab Atg16l1 mutant mice displayed expansion of fungi to levels similar to rewilded mice (Figure 5E). This expansion in the lab environment potentially reflects the role of ATG16L1 in the antifungal pathway of LC3-associated phagocytosis (Akoumianaki et al., 2016; Martinez et al., 2015; Oikonomou et al., 2016). Separating mice by genotype revealed that all of the rewilded mice regardless of genotype had similar levels of fungal colonization. Rewilded Nod2−/− mice had a similar expansion of fungi as rewilded WT mice. Rewilded WT mice displayed a 150-fold increase in fungal load compared with lab WT mice (Figure 5E). Given the striking difference in the fungal burden between lab and rewilded WT mice, we focused the remainder of this study on examining the identity of these fungi and their contribution to changes in leukocyte populations.
Microbial colonization induces granulocytes expansion
The effects of rewilding could be a response to a number of possible environmental variables, including diversification of diet and activity levels outdoors (e.g., (Budischak et al., 2018)). To determine the extent to which the enhanced activation and maturation of the immune system was due to changes in microbial exposure, germ-free mice were reconstituted with microbiota through inoculation with cecal contents from rewilded and lab mice, and then blood and MLNs harvested from their offspring were analyzed by flow cytometry. We chose 3 representative lab and rewilded WT mice (defined as within a standard deviation of the average number of blood granulocytes in the respective conditions) as donors of cecal contents. Mice harboring the microbiota of rewilded mice displayed an increase in granulocytes including neutrophils (Figures 6A and 6B). However, this increase was modest compared with the rewilded mice that served as donors. 16S rDNA sequencing showed that the bacterial community structures were preserved in the offspring of the germ-free mice reconstituted with cecal contents (Figure S6A). In contrast, quantification of total fungal burden indicated that the difference in fungal load within the microbiota of lab versus rewilded mice was not maintained in the progeny of reconstituted mice (Figure 6C). Therefore, it is possible that sustained exposure to a high fungal burden is necessary to recreate the full effect of rewilding. The modest increase in granulocytes observed in reconstituted germ-free mice could be due to either remaining fungi, immunostimulatory bacteria, or both.
Figure 6. Altering the Microbiota of Lab Mice Recreates Expansion of Granulocytes Observed in Rewilded Mice.
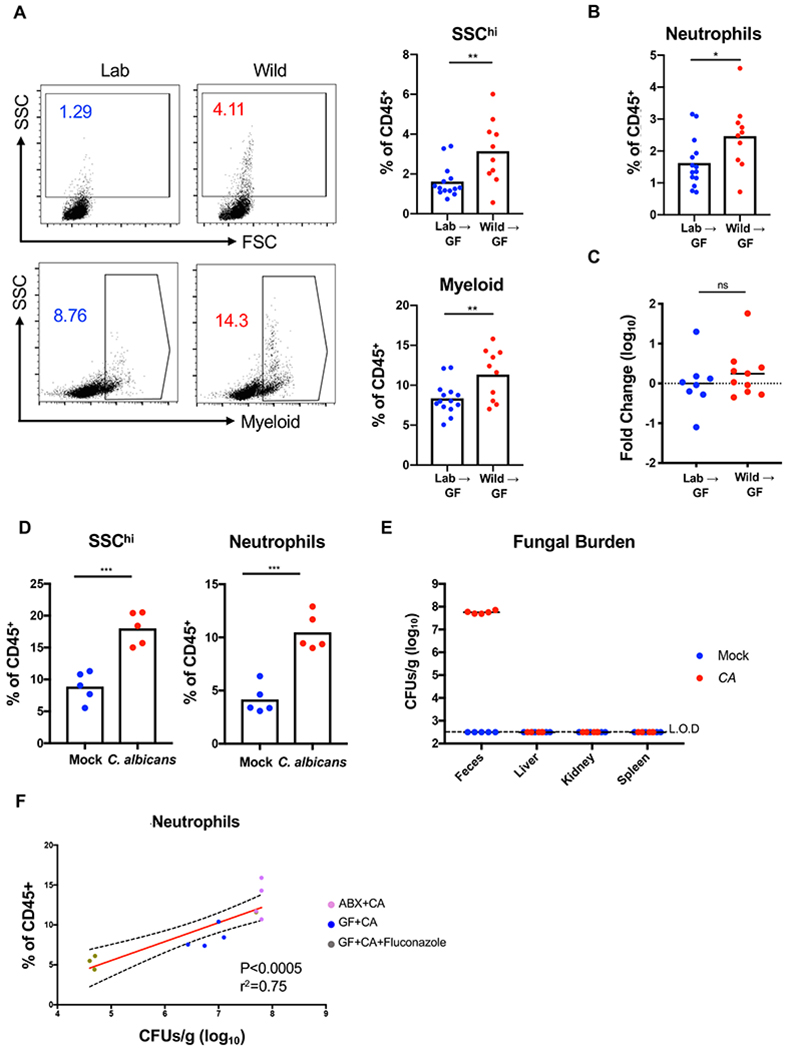
(A) Representative flow cytometry plots and quantification of SSChi cells and myeloid cells (CD11b/CD11c/DX5) gated on Live+CD45+ in the peripheral blood of the F1 progeny from germ-free (GF) mice reconstituted with cecal contents from lab (Lab) and rewilded (Wild) mice. N>10 recipient mice per condition were reconstituted with 3 donor lab and rewilded mice each. Data represents 2 independent repeats. (B) Quantification of the proportion of neutrophils (CD11b+Ly6G+) in the peripheral blood from the mice in (A). (C) Quantification of the relative fungal burden in stool of mice from (A) as determined by ITS qPCR. N = 8 and 10 mice reconstituted with lab and rewilded cecal contents from (A), respectively. (D) Quantification of SSChi cells and neutrophils in the peripheral blood from antibiotic-treated conventional mice 4 weeks post-inoculation with PBS or C. albicans. N = 5 mice per group, 2 independent repeats. (E) Colony forming units (CFUs) of fungi in feces and indicated organs for mice from (D). Dotted line denotes limit of detection (L.O.D.). (F) Linear regression analysis comparing frequency of neutrophils in the blood and fungal CFUs in feces from antibiotics treated mice inoculated with C. albicans(ABX+CA) from (D), germ-free mice mono-associated with C. albicans (GF+CA), and germ-free mice mono-associated with C. albicans and treated with fluconazole (GF+CA+Fluconazole). N = 5 ABX+CA, 4 GF+CA, and 3 GF+CA+Fluconazole. Mean and spread are shown. * P <0.05, ** P <0.01, *** P < 0.001 by two-tailed Student’s t-test between groups, (A) to (D). See also Figure S6.
Intestinal colonization by commensal fungi (the gut mycobiota) can contribute to mammalian immunity and represents an understudied component of the microbiota (Chiaro et al., 2017; Iliev et al., 2012; Jiang et al., 2017; Leonardi et al., 2018; Li et al., 2018; Limon et al., 2019; Tso et al., 2018; Wheeler et al., 2016; Zhang et al., 2016). To circumvent the technical difficulties with establishing prolonged fungal colonization in lab mice, we used an established model in which C. albicans is introduced into antibiotics-treated mice (Figure S6B). Although not a natural colonizer of the mouse gastrointestinal tract, C. albicans was an attractive model to initially test our hypothesis because we demonstrated that MLNs from rewilded mice are hyper-reactive to this fungus (Figure 3). We found that antibiotics-treated mice inoculated with C. albicans displayed a substantial increase in granulocytes and neutrophils compared with similarly treated mice receiving a control inoculum (Figure 6D). In addition, increases in differentiated CD8+ T cell populations were observed in C. albicans colonized mice (Figure S6C). These immune cell composition changes were not due to systemic infection as C. albicans colonization was restricted to the gut in this model (Figure 6E). Inoculation of germ-free mice with C. albicans also reproduced the increase in granulocytes demonstrating that fungal colonization is sufficient, though this approach led to a lower amount of C. albicans colonization, and a corresponding less dramatic change in granulocyte numbers (Figures 6F and S6D). The degree of C. albicans colonization is comparable to the level we achieve upon inoculation with Enterobacteriacceae (Figure S2A), suggesting a certain degree of specificity for the microbial stimulant is involved in the increase in granulocytes. To further demonstrate that fungal burden directly influences granulocyte numbers, we treated C. albicans mono-associated mice with the antifungal drug fluconazole. Our results show that pharmacologically decreasing fungal burden rapidly leads to a further decrease in granulocytes (Figures 6F and S6E), indicating that the degree of intestinal colonization by fungi impacts the proportion of immune cells in the periphery.
Fungi isolated from rewilded mice induce granulocyte expansion in lab mice
C. albicans represents a useful model and is relevant to human disease, but its utility may be limited because it is unlikely to be representative of fungi acquired in the outdoor enclosure. Having determined that exposure to the natural environment leads to a large increase in fungal burden, we wished to compare the precise composition of the fungal microbiota of rewilded and lab mice. Fungal sequences represent a minor proportion of shotgun sequencing reads due to the dominant presence of bacteria. To address this issue, we performed ITS sequencing of stool to increase our resolution of fungal taxa. We found that the fungal microbiota of rewilded and lab mice segregated by PCA (Figures 7A and S7A). In contrast to the bacterial microbiota, we found that rewilding was associated with an increase in α-diversity of fungi detected (Figure 7B). We observed increases in several fungal taxa, most notably an enrichment in Aspergillus species (Figures 7C and 7D). Therefore, exposure to the natural environment leads to the acquisition of an altered and expanded fungal microbiota.
Figure 7. Rewilding Leads to Colonization by Immunomodulatory Fungi.
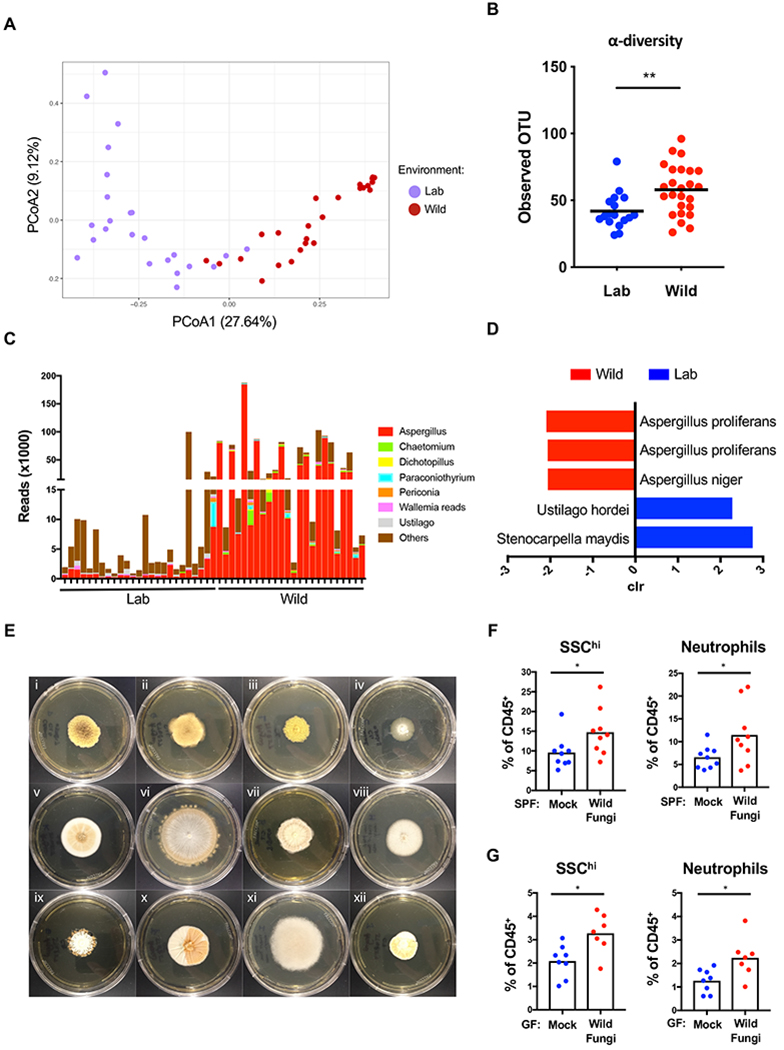
(A) Beta diversity (Bray Curtis) plots of fungal taxa detected by ITS sequencing of stool from lab (Lab) mice (purple dots) and rewilded (Wild) mice (red dots). N = 24 lab and 25 rewilded mice. (B) Alpha diversity quantification through number of operational taxonomic units (OTUs) from (A). (C) Number of ITS sequencing reads corresponding to the indicated genus from (A). (D) Fungal species from (A) significantly enriched in lab versus wild conditions by analysis of composition of microbiomes (ANCOM). (E) Representative images of colonies growing on Sabouraud dextrose agar plates following plating of cecal suspensions harvested from rewilded mice corresponding to (i) Aspergillus proliferans, (ii) Aspergillus proliferans, (iii) Aspergillus proliferans, (iv) Aspergillus candidus, (v) Aspergillus sp., (vi) Chaetomium globosum, (vii) Dichotomopilus indicus, (viii) Aspergillus niger, (ix) Malbranchea flavorosea, (x) Talaromyces tratensis, (xi) Syncephalastrum racemosum, (xii) Talaromyces tratensis. (F) Frequency of SSChi cells and neutrophils in peripheral blood from conventional mice repetitively gavaged with a consortium of 7 wild fungi isolates from plates (i)–(vii) in (E) or PBS for 2 weeks. N = 9 mice per group, 2 independent repeats. (G) Frequency of SSChi cells and neutrophils in the peripheral blood from germ-free mice 2 weeks post-inoculation with a consortium of 7 wild fungi. N > 7 mice per group, 2 independent repeats. Mean and spread are shown. * P <0.05, ** P <0.01, **** P < 0.0001 by two-tailed Student’s t-test between groups, (B), (F), and (G).
Finally, we examined whether fungi acquired in the outdoor enclosure are capable of driving changes to granulocyte numbers that we observed in rewilded mice. We were able to isolate many of the fungi corresponding to the taxa identified in the ITS sequencing reads when we plated stool from rewilded mice on Sabouraud dextrose agar (Figure 7E), but were unable to grow any fungi from lab mice. We gavaged SPF mice every other day repeatedly for 2 weeks (Figure S7B) with a consortium of representative “wild” fungi consisting of Aspergillus candidus, Aspergillus proliferans, Chaetomium globosum and Dichotomopilus Indicus (corresponding to plates (i)–(vii) depicted in Figure 7E). We found that these wild fungi were able to induce the increase in peripheral granulocytes and neutrophils (Figure 7F). To test whether these fungi were sufficient and to circumvent artifacts that may arise from repeated inoculations, we inoculated germ-free mice with the same consortium and found a similar increase in granulocytes and neutrophils (Figure 7G). Together, these experiments show that fungi in the natural environment can contribute to the state of the immune system.
DISCUSSION
Recent studies have shown that infection with disease-causing pathogens that are excluded from SPF facilities lead to large-scale changes in immunity that can alter subsequent immune responses (Abolins et al., 2017; Beura et al., 2016; Reese et al., 2016; Rosshart et al., 2019). Exposure to these pathogens have been suggested to ‘correct’ the immune system by increasing the number of mature immune cells to more closely resemble the state of the adult human immune system (Masopust et al., 2017; Tao and Reese, 2017). These fundamentally important findings suggest that childhood infections that occur in most individuals contribute to the education and function of our immune system. However, the extent to which commensal or environmentally-acquired agents are capable of driving these changes in immunity was unclear.
We found that releasing laboratory mice into a natural environment, even for a limited amount of time, can reproduce the enhanced differentiation of memory T cells previously attributed to infection by life-threatening pathogens (Beura et al., 2016). ~25% of lab mice co-housed with pet store mice did not survive the procedure (Beura et al., 2016), whereas 90% of mice released into our outdoor enclosure were recovered at the end of the 6-7 week period, with several of the stragglers successfully trapped thereafter (all together, >95% recovery). Comprehensive serology indicated that rewilded mice were not infected by the pathogens detected in pet store mice, although we acknowledge the possibility that agents not covered by the assay may be present, and that our rewilded mice were likely exposed to pathobionts that can cause disease in immunocompromised mice such as those included in the PCR panel. Consistent with the minimal infection by disease-causing pathogens, visual inspection and handling of rewilded WT mice indicated that they were healthy and their movements were sharper and their muscles stronger than lab control mice. Thus, our outdoor enclosure system may be useful for identifying immunomodulatory microbes that are difficult to isolate from wild or pet shop mice that have a more complex infectious history. We suggest that controlled release into nature can complement other approaches that expose mice to the natural environment, and that each method has its strengths and weaknesses.
The most striking effect of rewilding that we identified was the expansion of granulocytes in the blood including neutrophils. This finding is notable because granulocytes are abundant in human blood and scarce in laboratory mice. Hence, we were eager to identify the environmental variables that drive granulocyte expansion. The microbiota of rewilded mice was characterized by a significant increase in total fungi that included acquisition of Aspergillus species. Transfer of total microbiota including bacteria and fungi from rewilded mice into germ-free mice was able to reproduce the increase in granulocytes. Still, the proportion of blood granulocytes in reconstituted germ-free mice was lower than that of rewilded mice, potentially due to the poor engraftment of fungi. Therefore, we examined the contribution of fungi directly and found that granulocytes expansion could be recreated through inoculation of lab mice with a model human commensal fungus, C. albicans, or a cocktail of fungi isolated from rewilded mice. Our observation that the degree of fungal burden recovered in stool correlates with neutrophil numbers provides additional evidence that fungi contribute to the proportion of granulocytes in the blood. Intestinal colonization by C. albicans occurs in the majority of adult humans and is associated with enhanced Th17 CD4+ T cell differentiation, and IL-17 produced by these T cells can explain the increase in neutrophils (Bacher et al., 2019; Shao et al., 2019). It is possible that the normalization of the immune system that occurs upon rewilding, at least with respect to granulocytes, mimics intestinal colonization by C. albicans in humans.
Our results do not rule out a role for bacteria and other agents acquired in the wild. For instance, it is possible that an immunogenic bacterial species was not successfully transferred to germ-free mice upon reconstitution, leading us to miss an important contribution of the bacterial microbiota. An intriguing and perhaps likely possibility is that bacteria and fungi conspire to mediate the full effect of rewilding. An important future direction would be to identify interactions between the fungi we isolated and the bacterial microbiota. Similarly, other environmental variables may contribute to our observations in rewilded mice. In addition to initiating microbial exposure, eating vegetation and burrowing in the dirt could lead to continuous re-exposure or provide nutrients to the microbiota (Budischak et al., 2017). A comprehensive profiling of microbes in the environment and dietary interventions in the lab environment are useful avenues to pursue.
We also had an opportunity to determine the contribution of two IBD susceptibility genes. Neither Atg16l1 nor Nod2 mutation had a noticeable effect on the leukocyte populations we measured. Interestingly, Atg16l1 mutant mice that served as the lab controls displayed a large increase in fungal burden. Although unclear if related, a subset of the rewilded Atg16l1 mutant mice displayed diarrhea. We previously demonstrated that Atg16l1 and Nod2 mutant mice develop small intestinal defects in a manner dependent on specific commensal-like agents, and that close relatives of these agents do not trigger any abnormalities (Cadwell et al., 2010; Kernbauer et al., 2014a; Matsuzawa-Ishimoto et al., 2017; Ramanan et al., 2016; Ramanan et al., 2014). The observation that most of the Atg16l1 and Nod2 mutant mice did not display obvious signs of intestinal inflammation may reflect this specificity of gene-microbe interactions in IBD. As we only included two genotypes and on one background (C57BL/6J) in this study, a more comprehensive examination of genetic susceptibility to a change in environment is warranted.
In conclusion, our results indicate that fungi are among the different infectious entities that mammals encounter in the natural environment and represent one of the missing or altered components of the microbiota in lab mice kept under SPF conditions. Microbes, vegetation, and climate vary across the globe, and it is likely that exposure to nature has a different consequence depending on the location. Nevertheless, the recent study characterizing wildings noted that wild mice when compared with lab mice indeed display increased colonization by Ascomycota, the phylum that includes the Aspergillus species we found in our rewilded mice (Rosshart et al., 2019). Therefore, exposure to fungi may not be unique to our experimental system, and it remains possible that this fungal exposure drives the altered immunity observed in other studies examining wild or pet shop mice. When taken together, the findings we present here expand our understanding of the immunomodulatory role of intestinal microbes and indicate that a diverse fungal microbiota, likely together with the bacterial microbiota, participates in the differentiation of the immune system in a free-living mammal.
STAR METHODS
LEAD CONTACT AND MATERIALS AVAILABILITY
Further information and requests for resources and reagents should be directed to and will be fulfilled by Lead Contact, Dr. Ken Cadwell (ken.cadwell@nyulangone.org). All unique/stable reagents generated in this study are available from the Lead Contact with a completed Materials Transfer Agreement.
EXPERIMENTAL MODEL AND SUBJECT DETAILS
Mice and wild enclosure.
All animal work was approved by NYU Langone IACUC (#IA16-0087 and #IA16-00864). All mouse lines were bred onsite in an MNV/Helicobacter-free specific pathogen free (SPF) facility at NYU School of Medicine to generate littermates from multiple breeding pairs that were randomly assigned to either remain in the institutional vivarium (lab mice) or released into the outdoor enclosures (rewilded mice) to control for the microbiota at the onset of the experiment. Nod2−/− and Atg16l1T316A/T316A mice on the C57BL/6J background were previously described (Matsuzawa-Ishimoto et al., 2017; Ramanan et al., 2014). Atg16l1T316A/T316A mice, Atg16l1T316A/+, and wild-type (WT) control mice were generated from Atg16l1T316A/+ breeder pairs, and Nod2−/− mice were generated from Nod2−/− breeder pairs. Additional C57BL/6J mice were purchased from Jackson Laboratory and bred onsite to supplement WT controls for experiments. 16S microbial diversity at the conclusion of the experiment did not show appreciable differences in microbial composition within the lab populations (see companion manuscript (Lin et al. Figure S5). Outdoor enclosures were previously described (Budischak et al., 2018; Leung et al., 2018) and the protocols for releasing the laboratory mice into the outdoor enclosure facility were approved by Princeton IACUC (#1982-17).
The enclosures consist of replicate outdoor pens, each measuring about 180 m2 and fenced by 1.5-m high, zinced iron walls that are buried >80 cm deep and topped with electrical fencing to keep out terrestrial predators. Aluminum pie plates are strung up to deter aerial predators. A (180 × 140 × 70 cm) straw-filled shed is provided in each enclosure, along with two watering stations and a feeding station, so that the same mouse chow used in the laboratory (PicoLab Rodent Diet 20) was provided ad libitum to all mice. Mice outdoors, however, also had access to food sources found within the enclosures, including berries, seeds, and insects. 26-30 mice of mixed genotypes but the same sex were housed in each enclosure for 6-7 weeks. Longworth traps baited with chow were used to catch mice approximately 2 weeks and 4 weeks after release and again 6-7 weeks after release; for each trapping session, two baited traps were set per mouse per enclosure in the early evening, and all traps were checked within 12 hours. For subsequent microbiome assessment, a fresh stool sample was collected directly from the caught mice, flash frozen on dry ice, and stored at −80°C until further analysis. Mice were weighed with a spring balance.
30 WT, 29 Nod2−/−, 31 Atg16l1T316A/+, and 26 Atg16l1T316A/T316A laboratory mice (Total=116) were released into the outdoor enclosure. 19 WT, 19 Nod2−/−, 20 Atg16l1T316A/+, 22 Atg16l1T316A/T316A matched littermates (Total=80) were maintained in the institutional vivarium for comparison. For rewilded mice, traps were set regularly until the remaining mice were caught and were sampled for fecal microbiota. 25 WT, 28 Nod2−/−, 27 Atg16l1T316A/+, and 24 Atg16l1T316A/T316A rewilded mice (Total=104) were caught in the final trapping for terminal analyses. All lab control mice were recovered. Euthanasia was performed by CO2 asphyxiation, and blood, MLNs, and intestinal tissue were harvested. Two Atg16l1T316A/+ rewilded mice failed quality control and were not included in downstream analyses. One Atg16l1T316A/+ lab mouse was not appropriately processed and excluded in the final meta data table (Table S2; N=79 in lab mice and N=102 in rewilded mice).
6-10 week old C57BL/6J mice of both genders bred onsite in a manner similar to the rewilding experiments were used for microbial inoculation experiments performed under conventional laboratory settings.
METHOD DETAILS
Flow cytometry analysis
At harvesting, MLNs were removed and the single-cell suspensions were prepared in FACS buffer (HBSS containing 1% BSA, 1mM EDTA, 20mM HEPES, and 1mM sodium pyruvate). The whole blood were also collected in a heparin containing tube and after centrifuging at 2000 rpm for 5 minutes, the designated plasma from supernatant was removed and stored at −80°C until all samples were collected and analyzed together. After two rounds of red blood cell lysis with 1x RBC lysis buffer for 5 minutes and wash with FACS buffer, the single-cell suspensions of whole blood cells were ready for the following staining procedure. MLN and whole blood cells were stained for live/dead with blue reactive dye and cell surface markers were labeled with the following antibody panels: Lymphoid panel: CD49b Pacific Blue, CD11b Pacific Blue, CD11c Pacific Blue, CXCR3 Brilliant Violet 421, CD27 Brilliant Violet 510, KLRG1 Brilliant Violet 605, CD3 Brilliant Violet 786, CD127 Brilliant Violet 711, PD1 PerCP/Cy5.5, CD4 APC/Cy7, CD19 PE/Dazzle594, CD8 Brilliant Violet 650, CD43 Alexa Fluor 488, CD62L APC, CD44 PE, CD69 Alexa Fluor 700, CD45 Buv395, CD25 PE/Cy7. Myeloid panel: B220 Pacific Blue, CD86 Brilliant Violet 510, CD3 Brilliant Violet 605, CD69 Brilliant Violet 786, CD40 Alexa Fluor 488, Ly6G PerCP/Cy5.5, PDL2 APC, IA/IE APC/Cy7, PDL1 PE, CD64 PE/Dazzle594, F4/80 Alexa Fluor 700, CD11c Brilliant Violet 650, Siglec-F Brilliant Violet 421, CD103 Brilliant Violet 711, Ly6C PE/Cy7, CD11b Buv395. FACS analyses were performed in a ZE5 cell analyzer (BIO-RAD) and recorded FACS data were analyzed by Flowjo v10.4.2.
MLN cell stimulation and cytokine profiling
Single cell suspension of MLN cells were reconstituted in complete RPMI at 2 × 10⁶ cells/mL, and 0.1 mL was cultured in 96-well microtiter plates that contained 107 cfu/mL UV-killed microbes, 105 α CD3/CD28 beads, or PBS control. Overnight microbial cultures were reconstituted at 108 cfu/mL prior to irradiation. The stimulated microbes are as following: Staphylococcus aureus (Maurer et al., 2015), Pseudomonas aeruginosa (PAO1) (kindly provided by Dr. Andrew Darwin, NYU) (Srivastava et al., 2018), Bacillus subtilis (ATCC 6633), Clostridium perfringens (NCTC 10240), Bacteroides vulgatus (ATCC 8482), and Candida albicans (UC820, kindly provided by Dr. Stefan Feske, NYU). Supernatants were collected after 2 days and stored at −80°C. Concentrations of IL-1 α , IL-1 β, IL-4, IL-5, IL-6, IL-10, IL-13, IL-17A, CCL2, CCL3, CCL4, CXCL1, IFN- γ, and TNF- α in supernatants were measured using a custom mouse LEGENDplex assay (Biolegend) according to the manufacturer’s instructions. Plasma concentrations of IL-1 α, IL-1 β, IL-6, IL-10, RANTES, CCL2, CCL3, CCL4, CCL20, CXCL1, CXCL10, TNF α, GM-CSF were measured using a second custom mouse LEGENDplex assay (Biolegend). For each mouse profiled for cytokine production in response to microbial stimuli a PBS control was also sampled. In order to normalize per mouse cytokine production, we calculated the fold change of each cytokine measure to the PBS control. There was no overall difference in baseline cytokine production for any cytokine in response to PBS between lab and rewilded mice.
16S library preparation and sequencing
DNA was isolated from stool samples using the NucleoSpin Soil Kit (Macherey-Nagel). Bacterial 16S rRNA gene was amplified at the V4 region using primer pairs and paired-end amplicon sequencing was performed on the Illumina MiSeq system as previously described (Neil et al., 2019). See Key Resource Table for full primer sequences. Sequencing reads were processed using the DADA2 pipeline in the QIIME2 software package. Taxonomic assignment was performed against the Silva v132 database. Alpha diversity analysis was done using observed OTUs. Differential abundance taxa were identified using linear discriminant analysis effect size (LefSE) in different biological groups at a threshold LDA score described in the legends (Segata et al., 2011).
KEY RESOURCES TABLE
| REAGENT or RESOURCE | SOURCE | IDENTIFIER |
|---|---|---|
| Antibodies | ||
| Pacific Blue anti-mouse CD49b (pan-NK) Antibody | Biolegend | CAT#108918; RRID: AB_2265144 |
| Pacific Blue anti-mouse/human CD11b Antibody | Biolegend | CAT#101224; RRID: AB_755986 |
| Pacific Blue anti-mouse CD11c Antibody | Biolegend | CAT#117322; RRID: AB_755988 |
| Brilliant Violet 421 anti-mouse CD183 (CXCR3) Antibody | Biolegend | CAT#126529; RRID: AB_2563100 |
| Brilliant Violet 510 anti-mouse/rat/human CD27 Antibody | Biolegend | CAT#124229; RRID: AB_2565795 |
| Brilliant Violet 605 anti-mouse/human KLRG1 (MAFA) Antibody | Biolegend | CAT#138419; RRID: AB_2563357 |
| Brilliant Violet 785 anti-mouse CD3ε Antibody | Biolegend | CAT#100355 |
| Brilliant Violet 711 anti-mouse CD127 (IL-7Rα) Antibody | Biolegend | CAT#135035; RRID: AB_2564577 |
| PerCP/Cyanine5.5 anti-mouse CD279 (PD-1) Antibody | Biolegend | CAT#109120; RRID: AB_2566641 |
| APC/Cyanine7 anti-mouse CD4 Antibody | Biolegend | CAT#100414; RRID: AB_312699 |
| PE/Dazzle594 anti-mouse CD19 Antibody | Biolegend | CAT#115554; RRID: AB_2564001 |
| Brilliant Violet 650 anti-mouse CD8a Antibody | Biolegend | CAT#100742; RRID: AB_2563056 |
| Alexa Fluor 488 anti-mouse CD43 Activation-Associated Glycoform Antibody | Biolegend | CAT#121210; RRID: AB_528801 |
| APC anti-mouse CD62L Antibody | Biolegend | CAT#104412; RRID: AB_313099 |
| PE anti-mouse/human CD44 Antibody | Biolegend | CAT#103008; RRID: AB_312959 |
| Alexa Fluor 700 anti-mouse CD69 Antibody | Biolegend | CAT#104539; RRID: AB_2566304 |
| BUV395 Rat Anti-Mouse CD45 Antibody | BD Bioscience | CAT#564279; RRID: AB_2651134 |
| CD25 Monoclonal Antibody (PC61.5), PE-Cyanine7 | eBioscience | CAT#25-0251-82; RRID: AB_469608 |
| Pacific Blue anti-mouse/human CD45R/B220 Antibody | Biolegend | CAT#103227; RRID: AB_2566304 |
| Brilliant Violet 510 anti-mouse CD86 Antibody | Biolegend | CAT#105040; RRID: AB_2315766 |
| Brilliant Violet 605 anti-mouse CD3 Antibody | Biolegend | CAT#100237; RRID: AB_2562039 |
| Brilliant Violet 785 anti-mouse CD69 Antibody | Biolegend | CAT#104543; RRID: AB_2629640 |
| Alexa Fluor 488 anti-mouse CD40 Antibody | Biolegend | CAT#102910; RRID: AB_492852 |
| PerCP/Cyanine5.5 anti-mouse Ly-6G Antibody | Biolegend | CAT#127616; RRID: AB_1877271 |
| APC anti-mouse CD274 (B7-DC, PDL2) Antibody | Biolegend | CAT#127210; RRID: AB_2566345 |
| APC/Cyanine7 anti-mouse IA/IE Antibody | Biolegend | CAT#107628; RRID: AB_2069377 |
| PE anti-mouse CD274 (B7-H1, PD-L1) Antibody | Biolegend | CAT#124308; RRID: AB_2073556 |
| PE/Dazzle594 anti-mouse CD64 (FCγRI) Antibody | Biolegend | CAT#139320; RRID: AB_2566559 |
| Alexa Fluor 700 anti-mouse F4/80 Antibody | Biolegend | CAT#123130; RRID: AB_2293450 |
| Brilliant Violet 650 anti-mouse CD11c Antibody | Biolegend | CAT#117339; RRID: AB_2562414 |
| BV421 Rat Anti-Mouse Siglec-F Antibody | BD Bioscience | CAT#562681; RRID: AB_2722581 |
| BV711 Rat Anti-Mouse CD103 Antibody | BD Bioscience | CAT#564320; RRID: AB_2738743 |
| PE-Cy7 Rat Anti-Mouse Ly-6C Antibody | BD Bioscience | CAT#560593; RRID: AB_1727557 |
| BUV395 Rat Anti-CD11b Antibody | BD Bioscience | CAT#563553; RRID: AB_2738276 |
| Bacterial and Fungal Strains | ||
| Staphylococcus aureus | K. Maurer et al., 2015 | USA300 |
| Pseudomonas aeruginosa (PAO1) | D. Srivastava et al., 2018 | PAO1 |
| Bacillus subtilis | ATCC | ATCC 6633 |
| Clostridium perfringens | NCNC | NCTC 10240 |
| Bacteroides vulgatus | ATCC | ATCC 8482 |
| Candida albicans | Dr. Stefan Feske, NYU | UC820 |
| Candida albicans | ATCC | SC-5314 |
| Chemicals, Peptides, and Recombinant Proteins | ||
| RBC lysis buffer | SANTA CRUZ | Cat#sc-296258 |
| HBSS | Gibco | Cat#14175-095 |
| BSA | Sigma | Cat#A7030 |
| EDTA | Invitrogen | Cat#15575-038 |
| HEPES | Corning | Cat#25-060-CI |
| Sodium pyruvate | Corning | Cat#25-000-CI |
| Dynabeads Mouse T-cell Activator CD3/CD28 | Gibco | Cat#11452D |
| Critical Commercial Assays | ||
| Live/Dead Fixable Dead Cell Stain Kits | Invitrogen | Cat#L23105 |
| Custom mouse LEGENDplex assay | Biolegend | |
| NucleoSpin Soil Kit | Macherey-Nagel | Cat#740780.250 |
| RNeasy Plus Mini Kit | QIAGEN | Cat#74136 |
| Oligonucleotides | ||
| ITS2 forward primer (XXXXXXX indicating barcode): AATGATACGGCGACCACCGAGATCTACACXXXXXXXXACACTCTTTCCCTACACGACGCTCTTCCGATCTAAAGCCTCCGCTTATTGATATGCTTAART | IDT DNA | |
| ITS2 reverse primer (XXXXXX indicating barcode): CAAGCAGAAGACGGCATACGAGATXXXXXXXXGTGACTGGAGTTCAGACGTGTGCTCTTCCGATCTGGAACTTTYRRCAAYGGATCWCT | IDT DNA | |
| 16s forward primer (XXXXXXXXX indicating barcode): AATGATACGGCGACCACCGAGATCTACACGCTXXXXXXXXXXXXTATGGTAATTGTGTGYCAGCMGCCGCGGTAA | IDT DNA | |
| 16s reverse primer: CAAGCAGAAGACGGCATACGAGATAGTCAGCCAGCCGGACTACNVGGGTWTCTAAT | IDT DNA | |
| ITS qPCR forward primer: CTTGGTCATTTAGAG-GAAGTAA | IDT DNA | |
| ITS qPCR reverse primer: GCTGCGTTCTTCATCGATGC | IDT DNA | |
| Deposited Data | ||
| 16S, ITS, and RNA sequencing reads | NCBI Sequence Read Archive | PRJNA559026 |
| RNA expression counts | Gene Expression Omnibus | GSE135472 |
| Cytokine and flow cytometry profiles | Github | https://github.com/ruggleslab/RewildedMice |
| Experimental Models: Organisms/Strains | ||
| Mouse: C57BL/6J | The Jackson Laboratory | JAX: 000664 |
| Mouse: Nod2−/− | Ramanan et. al., 2014 | |
| Mouse: Atg16l1T316A/+ | Y. Matsuzawa-Ishimoto et al., 2017 | |
| Mouse: Atg16l1T316A/T316A | Y. Matsuzawa-Ishimoto et al., 2017 | |
| Software and Algorithms | ||
| Flowjo 10.4.2 | Flowjo, LLC | https://www.flowjo.com/ |
| Illustrator CC | Adobe | https://www.adobe.com/products/illustrator.html |
| Algorithms: t-SNE | fitsne v1.0.1 package | https://arxiv.org/abs/1712.09005 |
| Algorithms: UMAP | umap-learn v0.3.7 package | https://arxiv.org/abs/1802.03426 |
| Software: Python v3.6.5 | Python.org | https://www.python.org/downloads/release/python-365/ |
| Software: R v3.4.1 | https://www.r-statistics.com/ | |
| Algorithms: principal component analysis | ape v5.2 package | https://www.springer.com/gp/book/9781461417422 |
| Algorithms: Effect size measures | MDMR v0.5.1 package | https://link.springer.com/article/10.1007/s11336-016-9527-8 |
| Algorithms: random forest model | caret v6.0-80 package | R v3.4.1 |
| QIIME2 | Github | https://doc.qiime2.org |
Whole shotgun metagenomic sequencing
Shotgun metagenomics sequence data was analyzed from rewilded and lab mice for microbial abundance and gene family abundance profiles as previously described (Devlin et al., 2018). In brief, the sequencing data were processed through an analysis pipeline utilizing the Huttenhower Biobakery pipeline (McIver et al., 2018), including FastQC, Kneaddata, MetaPh1An (Truong et al., 2015) and HUMAnN2 (Abubucker et al., 2012) to obtain an annotated gene abundance matrix. In order to discern major differences between lab and rewilded mice we utilized the WHAM! (Devlin et al., 2018) interactive analysis platform and subsequent statistical tests to uncover major gene family abundance differences and changes in microbial taxa. Differentially abundant gene families were evaluated by a fold change difference of 1.8 in either direction of lab versus rewilded mice and an adjusted p-value of 0.05 from a t-test. The abundance of these differentially significant gene families was also used for principal component analysis.
Pathogen screen
Randomly selected mice were screened for the presence of infectious agents using EZ-Spot Assessment Plus Multiplexed Fluorometric Immunoassay (MFIA) and PCR Infectious Agent Testing (PRIA) Surveillance Plus Panel (Charles River Laboratories). Dried blood, feces, and body swabs were collected according to submission guidelines.
MLN cell RNA preparation and sequencing
Frozen samples of single cell suspensions from MLN of lab or rewilded mice were thaw to isolate RNA from approximately 106 cells by RNeasy Plus Mini Kit according to manufacturer’s instructions. CEL-seq2 were performed to do RNA sequencing on samples with good RNA qualities (RNA integrity number ≧ 5)
Histology and imaging
Immunohistochemistry was performed on 10% neutral buffered formalin fixed, paraffin-embedded small intestine and colon tissue. Sections were collected at 5-microns onto plus slides (Fisher Scientific, Cat # 22-042-924) and stored at room temperature prior to use. Unconjugated, rabbit anti-mouse CD 8a, T-cell surface glycoprotein alpha chain, clone D4W2Z (Cell Signaling Cat# 98941 Lot# 1 RRID: unassigned) raised against synthetic peptide corresponding to residues surrounding Asp42 of mouse CD8 α protein (Russell et al., 2018) was used for immunohistochemistry.
Transfer of wild microbiota
Flash frozen cecal contents from rewilded mice were transferred by two consecutive daily oral gavage procedures into timed pregnant germ-free mice as previously described (Rosshart et al., 2017). Three representative lab and rewilded wildtype mice (defined as within a standard deviation of the average number of blood granulocytes in the respective conditions) served as donors of cecal contents. Each recipient germ-free dam received the same 0.1 to 0.15 mL suspension on day 14 and 15 of pregnancy. 16S rRNA sequencing was performed as described above. Flow cytometry analyses were performed on offspring of both gender 6-10 weeks of age.
Wild enterobacteriaceae isolation
Serial dilutions of cecal contents from rewilded or lab mice were plated on MacConkey Agar and incubated overnight at 37°C. Colonies grew from rewilded samples within 12–16 hours but not lab samples. Colonies were chosen at random and were identified by 16S rRNA sequencing. For inoculation into mice, unique species was cultured in LB broth at 37°C for 16 hrs, pooled, and conventional mice were gavaged with 1.5×10⁸ bacteria. Stool was collected after two weeks and bacterial burden was determined.
Staphylococcus aureus isolation
Fecal bacteria were quantified by dilution plating on CHROMagar Staph aureus plates at 37°C. Colonies were selected at random and genotyped by DNA sequence analysis of the protein A gene variable repeat region (spa typing) and a variety of additional DNA polymorphisms and the presence of pv1 genes as previously described (Copin et al., 2019).
Fecal Fungi quantification by qPCR
Fungal DNA was isolated from individual fecal pellets using the NucleoSpin Soil kit (Macherey-Nagel) as described in 16S library preparation. Quantitative PCR was performed using SybrGreen (Roche) on a Roche480II Lightcycler. See Key Resource Table for full primer sequences. Relative abundance of fungal-specific internal transcribed spacer (ITS) rDNA was calculated using the ΔCT method and the values were converted as fold change from the average CT of control lab mice samples.
ITS library preparation and sequencing
The fungal ITS2 region was targeted for amplification and sequencing with primers that append barcodes and Illumina adapters, similar to those described by (Taylor et al., 2016). See Key Resource Table for full primer sequences. Notably, this results in the Illumina read-one from the reverse (LSU) side of the ITS reference sequence and the read-two from the 5.8S side. The ITS2 region was amplified and Illumina adapters appended by PCR in 25 μ 1 volume with Q5 High-Fidelity 2X master mix (NEB, # M0492L). PCR conditions were as follows: initial denaturation at 95°C for 2 minutes, followed by 32 cycles of 98°C for 15 seconds, 52°C for 20 seconds, 72°C for 45 seconds, and a final 2 minute extension at 72°C. We performed triplicate PCR reactions for each sample, then combined triplicates and cleaned the PCR products with Axygen AxyPrep Mag PCR cleanup beads (Corning, #MAG-PCR-CL-50) using 1.8X volumes of beads diluted to 62.5% in water (v/v) to remove large primer-dimers. Cleaned products were quantified then multiplexed at even abundances and sequenced on an Illumina MiSeq in paired-end mode with 300 cycles each and a 5% PhiX library spike-in to provide increased base diversity. All sequences have been deposited at NCBI under the BioProject PRJNA559026.
ITS sequences analysis
Raw sequences were imported into QIIME2 and read-pairs were joined with the vsearch plugin requiring a minimum length of 300 nucleotides (a completely overlapping pair of reads). Joined reads were then quality filtered and exported to reverse-complement reads with the fastx toolkit (http://hannonlab.cshl.edu/fastx_toolkit/) due to the orientation of our ITS2 primers. Joined, quality-filtered and reverse-complemented reads were re-imported into QIIME2 to employ the ITSxpress plugin in order to trim primers and extract the ITS2 sub-region (Bengtsson-Palme et al., 2013; Rivers et al., 2018). ITS2 sub-region extracted sequences were then denoised with deblur and a trim-length of 150 against the UNITE fungal database reference sequences (version 7) (Amir et al., 2017; Nilsson et al., 2018). Finally, the UNITE database was used to train a naïve Bayes classifier and to assign fungal taxonomies in QIIME2 (Bokulich et al., 2018). The community matrix was subsampled at a depth of 906 sequences per sample and Bray-Curtis distances and alpha diversity metrics (observed otus) were calculated within QIIME2.
Candida albicans inoculation
The C. albicans laboratory strain SC5314 was purchased from the ATCC. Fungi were cultured in Sabouraud Dextrose media with chloramphenicol (25 μ g/ml, Sigma) at 30°C for 16 hours. The culture then was washed and suspended in PBS. Antibiotic treated or germ-free mice were orally gavaged with 150 μ 1 of C. albicans (107 fungal CFUs). Feces and organs were collected and analyzed after 4 weeks colonization. For depletion of colonized C. albicans, germ-free mice were supplemented with fluconazole (0.5 mg/ml) in drinking water for another 2 weeks. Feces and organs were collected accordingly for analysis.
Isolation of Wild fungi
Feces or ileocecal contents from re-wilded mice were resuspended in PBS and plated on Sabouraud Dextrose Agar (SDA) with chloramphenicol (25 μ g/ml, Sigma) at 25 °C for 3 days. Individual colonies were re-grown on SDA plates to acquire the pure strains. Fungal DNA then was extracted from each isolated strains and sequenced using the ITS primers described below to identify the fungal species.
Wild fungal consortium inoculation
A wild fungi consortium consisting of A. candidus, 4 strains of A. proliferans, C. globosum and D. Indicus (corresponding to the fungi on plates (i)–(vii) from Figure 4E was cultured on SDA for 5 days and further cultured in Sabouraud Dextrose broth at 25°C for 2 days. Fungi were passed through a 19-gauge syringe needle several times to break down the mycelium prior to oral gavage into mice and mixed at equal ratios. SPF mice were orally gavaged with 150 μ 1 of wild fungi consortium every other day for 2 weeks and germ-free mice were giving with 150 μ 1 of wild fungi consortium at the first day of experiment.
Quantification and Statistical analysis
Statistical parameters including the definition of central value and the exact number (n) of mice per group are annotated in the corresponding figure legend. Statistical analysis was performed with GraphPad Prism version 8.21 for Mac (GraphPad) by using an unpaired two-tailed t test to evaluate differences between two groups. For statistical analysis of multiple groups, the one-way ANOVA with Holm-Sidak multiple comparisons test was applied. (* p value < 0.05; ** p value < 0.01; *** p value < 0.001; **** p value < 0.0001; ns, not statistically significant)
Data and Code Availability
Raw sequence data from 16S, ITS, and RNA sequencing experiments are deposited in the NCBI Sequence Read Archive under BioProject accession number PRJNA559026 and gene expression omnibus (GEO) accession number GSE135472. All processing was performed in R and analysis scripts can be found on Github at https://github.com/ruggleslab/RewildedMice
Supplementary Material
Highlights.
Controlled release of lab mice into the wild alters the state of the immune system
Rewilded mice harbor an altered microbiota including increases in intestinal fungi
Fungi from rewilded mice induce granulocyte expansion in laboratory mice
Acknowledgements
We wish to thank William Craigens, Daniel Navarrete Prado, Allison Lee, and Veena Chittamuri for assistance with trapping and husbandry in the field, the PU Lab Animal Resources staff for logistical support. We wish to thank the NYU School of Medicine Flow Cytometry and Cell Sorting, Microscopy, Genome Technology, and Histology Cores for use of their instruments and technical assistance (supported in part by National Institute of Health (NIH) grant P31CA016087, S10OD01058, and and S10OD018338). We also wish to thank Margie Alva, Juan Carrasquillo, and Beatriz Delgado for technical assistance with gnotobiotics. Graphical abstract created with Biorender.com
Funding: This research was supported by the Division of Intramural Research, National Institute of Allergy and Infectious Diseases, National Institutes of Health (NIH) and also NIH grants DK103788 (K.C. and P.L.), AI121244 (K.C.), HL123340 (K.C.), DK093668 (K.C.), AI130945 (P.L. and K.C.), R01 HL125816 (K.C.), R01 AI140754 (K.C.), HL084312, AI133977 (P.L.), research station and research rebate awards from PU EEB (A.L.G.), pilot award from the NYU CTSA grant UL1TR001445 from the National Center for Advancing Translational Sciences (NCATS) (K.C., P.L.), pilot award from the NYU Cancer Center grant P30CA016087 (K.C.), AI100853 (Y.H.C.), and DK122698 (F.Y.). This work was also supported by the Department of Defense grant W81XWH-16-1-0256 (P.L.), Faculty Scholar grant from the Howard Hughes Medical Institute (K.C.), Crohn’s & Colitis Foundation (K.C.), Merieux Institute (K.C.), Kenneth Rainin Foundation (K.C.), Stony-Wold Herbert Fund (K.C.), and Bernard Levine Postdoctoral Research Fellowship in Immunology (Y.H.C.). K.C. is a Burroughs Wellcome Fund Investigator in the Pathogenesis of Infectious Diseases.
Declaration of Interests
K.C. receives research funding from Pfizer and Abbvie and P.L. receives research funding from Pfizer. K.C. has consulted for or received an honorarium from Puretech Health, Genentech, and Abbvie. K.C. has a provisional patent, U.S. Patent Appln. No. 15/625,934. P.L. consults for and has equity in Toilabs. P.L. is a federal employee.
Footnotes
Publisher's Disclaimer: This is a PDF file of an unedited manuscript that has been accepted for publication. As a service to our customers we are providing this early version of the manuscript. The manuscript will undergo copyediting, typesetting, and review of the resulting proof before it is published in its final form. Please note that during the production process errors may be discovered which could affect the content, and all legal disclaimers that apply to the journal pertain.
References
- Abolins S, King EC, Lazarou L, Weldon L, Hughes L, Drescher P, Raynes JG, Hafalla JCR, Viney ME, and Riley EM (2017). The comparative immunology of wild and laboratory mice, Mus musculus domesticus. Nature communications 8, 14811. [DOI] [PMC free article] [PubMed] [Google Scholar]
- Abubucker S, Segata N, Goll J, Schubert AM, Izard J, Cantarel BL, Rodriguez-Mueller B, Zucker J, Thiagarajan M, Henrissat B, White O, et al. (2012) Metabolic reconstruction for metagenomic data and its application to the human microbiome. PLoS Comput. Biol 8(6), e1002358. [DOI] [PMC free article] [PubMed] [Google Scholar]
- Akoumianaki T, Kyrmizi I, Valsecchi I, Gresnigt MS, Samonis G, Drakos E, Boumpas D , Muszkieta L, Prevost MC, Kontoyiannis DP, et al. (2016). Aspergillus Cell Wall Melanin Blocks LC3-Associated Phagocytosis to Promote Pathogenicity. Cell Host Microbe 19, 79–90. [DOI] [PubMed] [Google Scholar]
- Amir A, McDonald D, Navas-Molina JA, Kopylova E, Morton JT, Zech Xu Z, Kightley DP, Thompson LR, Hyde ER, Gonzalez A, et al. (2017) Deblur Rapidly Resolves Single-Nucleotide Community Sequence Patterns. mSystems. 2(2), e00191–16. [DOI] [PMC free article] [PubMed] [Google Scholar]
- Bacher P, Hohnstein T, Beerbaum E, Rocker M, Blango MG, Kaufmann S, Rohmel J, Eschenhagen P, Grehn C, Seidel K, et al. (2019). Human Anti-fungal Th17 Immunity and Pathology Rely on Cross-Reactivity against Candida albicans. Cell 176, 1340–1355 e1315. [DOI] [PubMed] [Google Scholar]
- Bengtsson-Palme J, Ryberg M, Hartmann M, Branco S, Wang Z, Godhe A, De Wit P, Sanchez-Garcia M, Ebersberger I, de Sousa F, et al. (2013). Improved software detection and extraction of ITS1 and ITS2 from ribosomal ITS sequences of fungi and other eukaryotes for analysis of environmental sequencing data. Methods in Ecology and Evolution. 4(10), 914–919. DOI: 10.1111/2041-210X.12073. [DOI] [Google Scholar]
- Beura LK, Hamilton SE, Bi K, Schenkel JM, Odumade OA, Casey KA, Thompson EA, Fraser KA, Rosato PC, Filali-Mouhim A, et al. (2016). Normalizing the environment recapitulates adult human immune traits in laboratory mice. Nature 532, 512–516. [DOI] [PMC free article] [PubMed] [Google Scholar]
- Bokulich NA, Kaehler BD, Rideout JR, Dillon M, Bolyen E, Knight R, Huttley GA, and Gregory Caporaso J (2018) Optimizing taxonomic classification of marker-gene amplicon sequences with QIIME 2’s q2-feature-classifier plugin. Microbiome. 6(1), 90. [DOI] [PMC free article] [PubMed] [Google Scholar]
- Budischak SA, Hansen CB, Caudron Q, Garnier R, Kartzinel TR, Pelczer I, Cressler BE, van Leeuwen A, and Graham AL (2017). Feeding Immunity: Physiological and Behavioral Responses to Infection and Resource Limitation. Front Immunol 8, 1914. [DOI] [PMC free article] [PubMed] [Google Scholar]
- Budischak SA, Hansen CB, Caudron Q, Garnier R, Kartzinel TR, Pelczer I, Cressler CE, van Leeuwen A, and Graham AL (2018). Feeding Immunity: Physiological and Behavioral Responses to Infection and Resource Limitation. Front Immunol 8, 1914. [DOI] [PMC free article] [PubMed] [Google Scholar]
- Cadwell K, Liu JY, Brown SL, Miyoshi H, Loh J, Lennerz JK, Kishi C, Kc W, Carrero JA, Hunt S, et al. (2008). A key role for autophagy and the autophagy gene Atg16l1 in mouse and human intestinal Paneth cells. Nature 456, 259–263. [DOI] [PMC free article] [PubMed] [Google Scholar]
- Cadwell K, Patel KK, Maloney NS, Liu TC, Ng AC, Storer CE, Head RD, Xavier R, Stappenbeck TS, and Virgin HW (2010). Virus-plus-susceptibility gene interaction determines Crohn’s disease gene Atg16L1 phenotypes in intestine. Cell 141, 1135–1145. [DOI] [PMC free article] [PubMed] [Google Scholar]
- Chiaro TR, Soto R, Zac Stephens W, Kubinak JL, Petersen C, Gogokhia L, Bell R, Delgado JC, Cox J, Voth W, et al. (2017). A member of the gut mycobiota modulates host purine metabolism exacerbating colitis in mice. Sci Transl Med 9. [DOI] [PMC free article] [PubMed] [Google Scholar]
- Choi YJ, Kim S, Choi Y, Nielsen TB, Yan J, Lu A, Ruan J, Lee HR, Wu H, Spellberg B, and Jung JU (2019). SERPINB1-mediated checkpoint of inflammatory caspase activation. Nat Immunol 20, 276–287. [DOI] [PMC free article] [PubMed] [Google Scholar]
- Chu H, Khosravi A, Kusumawardhani IP, Kwon AH, Vasconcelos AC, Cunha LD, Mayer AE, Shen Y, Wu WL, Kambal A, et al. (2016). Gene-microbiota interactions contribute to the pathogenesis of inflammatory bowel disease. Science 352, 1116–1120. [DOI] [PMC free article] [PubMed] [Google Scholar]
- Chudnovskiy A, Mortha A, Kana V, Kennard A, Ramirez JD, Rahman A, Remark R, Mogno I, Ng R, Gnjatic S, et al. (2016). Host-Protozoan Interactions Protect from Mucosal Infections through Activation of the Inflammasome. Cell 167, 444–456 e414. [DOI] [PMC free article] [PubMed] [Google Scholar]
- Cooney R, Baker J, Brain O, Danis B, Pichulik T, Allan P, Ferguson DJ, Campbell BJ, Jewell D, and Simmons A (2010). NOD2 stimulation induces autophagy in dendritic cells influencing bacterial handling and antigen presentation. Nat Med 16, 90–97. [DOI] [PubMed] [Google Scholar]
- Copin R, Sause WE, Fulmer Y, Balasubramanian D, Dyzenhaus S, Ahmed JM, Kumar K, Lees J, Stachel A, Fisher JC, et al. (2019). Sequential evolution of virulence and resistance during clonal spread of community-acquired methicillin-resistant Staphylococcus aureus. Proceedings of the National Academy of Sciences of the United States of America. 116(5), 1745–1754. Published online 2019/01/13 DOI: 10.1073/pnas.1814265116. [DOI] [PMC free article] [PubMed] [Google Scholar]
- Devlin JC, Battaglia T, Blaser MJ, and Ruggles KV (2018) WHAM!: a web-based visualization suite for user-defined analysis of metagenomic shotgun sequencing data. BMC Genomics. 19(1), 493. [DOI] [PMC free article] [PubMed] [Google Scholar]
- Iliev ID, Funari VA, Taylor KD, Nguyen Q, Reyes CN, Strom SP, Brown J, Becker CA, Fleshner PR, Dubinsky M, et al. (2012). Interactions between commensal fungi and the C-type lectin receptor Dectin-1 influence colitis. Science 336, 1314–1317. [DOI] [PMC free article] [PubMed] [Google Scholar]
- Jiang TT, Shao TY, Ang WXG, Kinder JM, Turner LH, Pham G, Whitt J, Alenghat T, and Way SS (2017). Commensal Fungi Recapitulate the Protective Benefits of Intestinal Bacteria. Cell Host Microbe 22, 809–816 e804. [DOI] [PMC free article] [PubMed] [Google Scholar]
- Kernbauer E, Ding Y, and Cadwell K (2014a). An enteric virus can replace the beneficial function of commensal bacteria. Nature 516, 94–98. [DOI] [PMC free article] [PubMed] [Google Scholar]
- Kernbauer E, Maurer K, Torres VJ, Shopsin B, and Cadwell K (2014b). Gastrointestinal dissemination and transmission of Staphylococcus aureus following bacteremia. Infect Immun. [DOI] [PMC free article] [PubMed] [Google Scholar]
- Kim YG, Kamada N, Shaw MH, Warner N, Chen GY, Franchi L, and Nunez G (2011). The Nod2 Sensor Promotes Intestinal Pathogen Eradication via the Chemokine CCL2-Dependent Recruitment of Inflammatory Monocytes. Immunity. [DOI] [PMC free article] [PubMed] [Google Scholar]
- Lassen KG, Kuballa P, Conway KL, Patel KK, Becker CE, Peloquin JM, Villablanca EJ, Norman JM, Liu TC, Heath RJ, et al. (2014). Atg16L1 T300A variant decreases selective autophagy resulting in altered cytokine signaling and decreased antibacterial defense. Proc Natl Acad Sci U S A 111, 7741–7746. [DOI] [PMC free article] [PubMed] [Google Scholar]
- Leonardi I, Li X, Semon A, Li D, Doron I, Putzel G, Bar A, Prieto D, Rescigno M, McGovern DPB, et al. (2018). CX3CR1(+) mononuclear phagocytes control immunity to intestinal fungi. Science 359, 232–236. [DOI] [PMC free article] [PubMed] [Google Scholar]
- Leung JM, Budischak SA, Chung The H, Hansen C, Bowcutt R, Neill R, Shellman M, Loke P, and Graham AL (2018). Rapid environmental effects on gut nematode susceptibility in rewilded mice. PLoS Biol 16, e2004108. [DOI] [PMC free article] [PubMed] [Google Scholar]
- Li X, Leonardi I, Semon A, Doron I, Gao IH, Putzel GG, Kim Y, Kabata H, Artis D, Fiers WD, et al. (2018). Response to Fungal Dysbiosis by Gut-Resident CX3CR1(+) Mononuclear Phagocytes Aggravates Allergic Airway Disease. Cell Host Microbe 24, 847–856 e844. [DOI] [PMC free article] [PubMed] [Google Scholar]
- Limon JJ, Tang J, Li D, Wolf AJ, Michelsen KS, Funari V, Gargus M, Nguyen C, Sharma P, Maymi VI, et al. (2019). Malassezia Is Associated with Crohn’s Disease and Exacerbates Colitis in Mouse Models. Cell Host Microbe 25, 377–388 e376. [DOI] [PMC free article] [PubMed] [Google Scholar]
- Marchiando AM, Ramanan D, Ding Y, Gomez LE, Hubbard-Lucey VM, Maurer K, Wang C, Ziel JW, van Rooijen N, Nunez G, et al. (2013). A deficiency in the autophagy gene Atg16L1 enhances resistance to enteric bacterial infection. Cell Host Microbe 14, 216–224. [DOI] [PMC free article] [PubMed] [Google Scholar]
- Martin PK, Marchiando A, Xu R, Rudensky E, Yeung F, Schuster SL, Kernbauer E, and Cadwell K (2018). Autophagy proteins suppress protective type I interferon signalling in response to the murine gut microbiota. Nat Microbiol 3, 1131–1141. [DOI] [PMC free article] [PubMed] [Google Scholar]
- Martinez J, Malireddi RK, Lu Q, Cunha LD, Pelletier S, Gingras S, Orchard R, Guan JL, Tan H, Peng J, et al. (2015). Molecular characterization of LC3-associated phagocytosis reveals distinct roles for Rubicon, NOX2 and autophagy proteins. Nat Cell Biol 17, 893–906. [DOI] [PMC free article] [PubMed] [Google Scholar] [Retracted]
- Masopust D, Sivula CP, and Jameson SC (2017). Of Mice, Dirty Mice, and Men: Using Mice To Understand Human Immunology. J Immunol 199, 383–388. [DOI] [PMC free article] [PubMed] [Google Scholar]
- Matsuzawa-Ishimoto Y, Shono Y, Gomez LE, Hubbard-Lucey VM, Cammer M, Neil J, Dewan MZ, Lieberman SR, Lazrak A, Marinis JM, et al. (2017). Autophagy protein ATG16L1 prevents necroptosis in the intestinal epithelium. J Exp Med. [DOI] [PMC free article] [PubMed] [Google Scholar]
- Maurer K, Reyes-Robles T, Alonzo F 3rd, Durbin J, Torres VJ, and Cadwell K (2015). Autophagy mediates tolerance to Staphylococcus aureus alpha-toxin. Cell Host Microbe. 17(4), 429–440. Published online 2015/03/31 DOI: S1931-3128(15)00116-X [pii] 10.1016/j.chom.2015.03.001. [DOI] [PMC free article] [PubMed] [Google Scholar]
- McCarthy AJ, van Wamel W, Vandendriessche S, Larsen J, Denis O, Garcia-Graells C, Uhlemann AC, Lowy FD, Skov R, and Lindsay JA (2012). Staphylococcus aureus CC398 clade associated with human-to-human transmission. Applied and environmental microbiology 78, 8845–8848. [DOI] [PMC free article] [PubMed] [Google Scholar]
- McIver LJ, Abu-Ali G, Franzosa EA, Schwager R, Morgan XC, Waldron L, Segata N, and Huttenhower C (2018). bioBakery: a meta’omic analysis environment. Bioinformatics (Oxford, England). 34(7), 1235–1237. Published online 2017/12/02 DOI: 10.1093/bioinformatics/btx754. [DOI] [PMC free article] [PubMed] [Google Scholar]
- Murthy A, Li Y, Peng I, Reichelt M, Katakam AK, Noubade R, Roose-Girma M, Devoss J, Diehl L, Graham RR, and van Lookeren Campagne M (2014). A Crohn’s disease variant in Atg16l1 enhances its degradation by caspase 3. Nature 506, 456–462. [DOI] [PubMed] [Google Scholar]
- Neil JA, Matsuzawa-Ishimoto Y, Kernbauer-Holzl E, Schuster SL, Sota S, Venzon M, Dallari S, Galvao Neto A, Hine A, Hudesman D, et al. (2019). IFN-I and IL-22 mediate protective effects of intestinal viral infection. Nat Microbiol. Published online 2019/06/12 DOI: 10.1038/s41564-019-0470-110.1038/s41564-019-0470-1 [pii]. [DOI] [PMC free article] [PubMed] [Google Scholar]
- Nilsson RH, Larsson KH, Taylor AFS, Bengtsson-Palme J, Jeppesen TS, Schigel D, Kennedy P, Picard K, Glockner FO, Tedersoo L, et al. (2019) The UNITE database for molecular identification of fungi: handling dark taxa and parallel taxonomic classifications. Nucleic Acids Res. 47(D1), D259–D264. [DOI] [PMC free article] [PubMed] [Google Scholar]
- Oikonomou V, Moretti S, Renga G, Galosi C, Borghi M, Pariano M, Puccetti M, Palmerini CA, Amico L, Carotti A, et al. (2016). Noncanonical Fungal Autophagy Inhibits Inflammation in Response to IFN-gamma via DAPK1. Cell Host Microbe 20, 744–757. [DOI] [PMC free article] [PubMed] [Google Scholar]
- Price LB, Stegger M, Hasman H, Aziz M, Larsen J, Andersen PS, Pearson T, Waters AE, Foster JT, Schupp J, et al. (2012). Staphylococcus aureus CC398: host adaptation and emergence of methicillin resistance in livestock. mBio 3. [DOI] [PMC free article] [PubMed] [Google Scholar]
- Ramanan D, Bowcutt R, Lee SC, Tang MS, Kurtz ZD, Ding Y, Honda K, Gause WC, Blaser MJ, Bonneau RA, et al. (2016). Helminth infection promotes colonization resistance via type 2 immunity. Science 352, 608–612. [DOI] [PMC free article] [PubMed] [Google Scholar]
- Ramanan D, Tang MS, Bowcutt R, Loke P, and Cadwell K (2014). Bacterial sensor Nod2 prevents inflammation of the small intestine by restricting the expansion of the commensal Bacteroides vulgatus. Immunity 41, 311–324. [DOI] [PMC free article] [PubMed] [Google Scholar]
- Reese TA, Bi K, Kambal A, Filali-Mouhim A, Beura LK, Burger MC, Pulendran B, Sekaly RP, Jameson SC, Masopust D, et al. (2016). Sequential Infection with Common Pathogens Promotes Human-like Immune Gene Expression and Altered Vaccine Response. Cell Host Microbe 19, 713–719. [DOI] [PMC free article] [PubMed] [Google Scholar]
- Rivers AR, Weber KC, Gardner TA, Liu S, and Armstrong SD (2018) ITSxpress: Software to rapidly trim internally transcribed spacer sequences with quality scores for marker gene analysis. F1000Res. 7, 1418. [DOI] [PMC free article] [PubMed] [Google Scholar]
- Rosshart SP, Herz J, Vassallo BG, Hunter A, Wall MK, Badger JH, McCulloch JA, Anastasakis DG, Sarshad AA, Leonardi I, et al. (2019). Laboratory mice born to wild mice have natural microbiota and model human immune responses. Science 365. [DOI] [PMC free article] [PubMed] [Google Scholar]
- Rosshart SP, Vassallo BG, Angeletti D, Hutchinson DS, Morgan AP, Takeda K, Hickman HD, McCulloch JA, Badger JH, Ajami NJ, et al. (2017). Wild Mouse Gut Microbiota Promotes Host Fitness and Improves Disease Resistance. Cell 171, 1015–1028 e1013. [DOI] [PMC free article] [PubMed] [Google Scholar]
- Russell L, Swanner J, Jaime-Ramirez AC, Wang Y, Sprague A, Banasavadi-Siddegowda Y, Yoo JY, Sizemore GM, Kladney R, Zhang J, et al. (2018) PTEN expression by an oncolytic herpesvirus directs T-cell mediated tumor clearance. Nat Commun. 9(1), 5006. [DOI] [PMC free article] [PubMed] [Google Scholar]
- Saitoh T, Fujita N, Jang MH, Uematsu S, Yang BG, Satoh T, Omori H, Noda T, Yamamoto N, Komatsu M, et al. (2008). Loss of the autophagy protein Atg16L1 enhances endotoxin-induced IL-1beta production. Nature 456, 264–268. [DOI] [PubMed] [Google Scholar]
- Shao TY, Ang WXG, Jiang TT, Huang FS, Andersen H, Kinder JM, Pham G, Burg AR, Ruff B, Gonzalez T, et al. (2019). Commensal Candida albicans Positively Calibrates Systemic Th17 Immunological Responses. Cell Host Microbe 25, 404–417 e406. [DOI] [PMC free article] [PubMed] [Google Scholar]
- Srivastava D, Seo J, Rimal B, Kim SJ, Zhen S, and Darwin AJ (2018). A Proteolytic Complex Targets Multiple Cell Wall Hydrolases in Pseudomonas aeruginosa. MBio. 9(4). Published online 2018/07/19 DOI: mBio.00972-18 [pii]10.1128/mBio.00972-18. [DOI] [PMC free article] [PubMed] [Google Scholar]
- Tao L, and Reese TA (2017). Making Mouse Models That Reflect Human Immune Responses. Trends in immunology 38, 181–193. [DOI] [PubMed] [Google Scholar]
- Taylor DL, Walters WA, Lennon NJ, Bochicchio J, Krohn A, Caporaso JG, and Pennanen T (2016) Accurate Estimation of Fungal Diversity and Abundance through Improved Lineage-Specific Primers Optimized for Illumina Amplicon Sequencing. Appl Environ Microbiol. 82(24), 7217–7226. [DOI] [PMC free article] [PubMed] [Google Scholar]
- Travassos LH, Carneiro LA, Ramjeet M, Hussey S, Kim YG, Magalhaes JG, Yuan L, Soares F, Chea E, Le Bourhis L, et al. (2010). Nod1 and Nod2 direct autophagy by recruiting ATG16L1 to the plasma membrane at the site of bacterial entry. Nat Immunol 11, 55–62. [DOI] [PubMed] [Google Scholar]
- Truong DT, Franzosa EA, Tickle TL, Scholz M, Weingart G, Pasolli E, Tett A, Huttenhower C, and Segata N (2015) MetaPhlAn2 for enhanced metagenomic taxonomic profiling. Nat Methods. 12(10), 902–903. [DOI] [PubMed] [Google Scholar]
- Tso GHW, Reales-Calderon JA, Tan ASM, Sem X, Le GTT, Tan TG, Lai GC, Srinivasan KG, Yurieva M, Liao W, et al. (2018). Experimental evolution of a fungal pathogen into a gut symbiont. Science 362, 589–595. [DOI] [PubMed] [Google Scholar]
- Wheeler ML, Limon JJ, Bar AS, Leal CA, Gargus M, Tang J, Brown J, Funari VA, Wang HL, Crother TR, et al. (2016). Immunological Consequences of Intestinal Fungal Dysbiosis. Cell Host Microbe 19, 865–873. [DOI] [PMC free article] [PubMed] [Google Scholar]
- Wlodarska M, Kostic AD, and Xavier RJ (2015). An integrative view of microbiome-host interactions in inflammatory bowel diseases. Cell Host Microbe 17, 577–591. [DOI] [PMC free article] [PubMed] [Google Scholar]
- Zhang Z, Li J, Zheng W, Zhao G, Zhang H, Wang X, Guo Y, Qin C, and Shi Y (2016). Peripheral Lymphoid Volume Expansion and Maintenance Are Controlled by Gut Microbiota via RALDH+ Dendritic Cells. Immunity 44, 330–342. [DOI] [PMC free article] [PubMed] [Google Scholar]
Associated Data
This section collects any data citations, data availability statements, or supplementary materials included in this article.
Supplementary Materials
Data Availability Statement
Raw sequence data from 16S, ITS, and RNA sequencing experiments are deposited in the NCBI Sequence Read Archive under BioProject accession number PRJNA559026 and gene expression omnibus (GEO) accession number GSE135472. All processing was performed in R and analysis scripts can be found on Github at https://github.com/ruggleslab/RewildedMice