

Summary
SARS-CoV-2, the virus responsible for COVID-19, is causing a devastating worldwide pandemic, and there is a pressing need to understand the development, specificity, and neutralizing potency of humoral immune responses during acute infection. We report a cross-sectional study of antibody responses to the receptor-binding domain (RBD) of the spike protein and virus neutralization activity in a cohort of 44 hospitalized COVID-19 patients. RBD-specific IgG responses are detectable in all patients 6 days after PCR confirmation. Isotype switching to IgG occurs rapidly, primarily to IgG1 and IgG3. Using a clinical SARS-CoV-2 isolate, neutralizing antibody titers are detectable in all patients by 6 days after PCR confirmation and correlate with RBD-specific binding IgG titers. The RBD-specific binding data were further validated in a clinical setting with 231 PCR-confirmed COVID-19 patient samples. These findings have implications for understanding protective immunity against SARS-CoV-2, therapeutic use of immune plasma, and development of much-needed vaccines.
Keywords: COVID-19, SARS-CoV-2, neutralizing antibody, spike protein, receptor-binding protein, coronavirus, protective immunity, serology test, humoral immune response
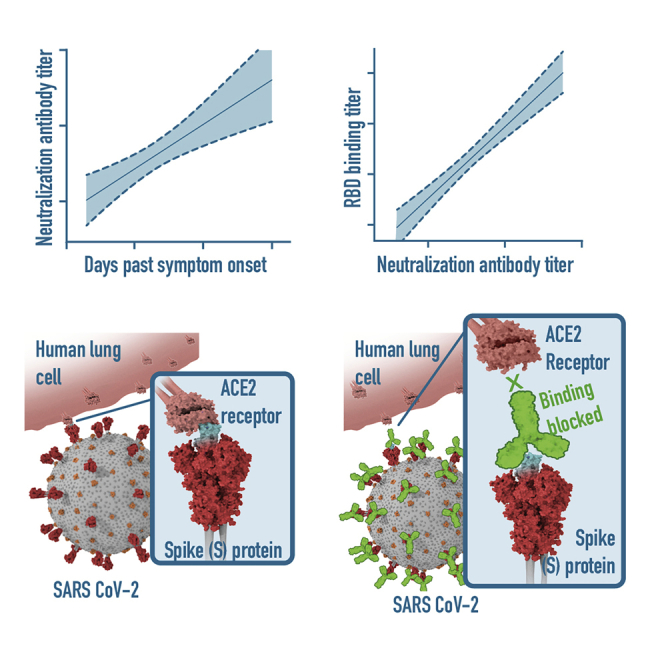
Graphical Abstract
HIGHLIGHTS
Cross-sectional study of 44 hospitalized COVID-19 patients
RBD-specific IgG responses detectable in all patients 6 days after PCR confirmation
Neutralizing titers are detectable in all patients 6 days after PCR confirmation
RBD-specific IgG titers correlate with the neutralizing potency
Suthar et al. report on a cross-sectional study of hospitalized COVID-19 patients suggesting a correlation between the SARS-CoV-2 receptor-binding-domain-specific IgG responses and virus neutralizing antibody responses. These findings have implications for understanding protective immunity against SARS-CoV-2, therapeutic use of immune plasma, and development of vaccines.
Introduction
Coronavirus disease 2019 (COVID-19) is a worldwide pandemic. There is a pressing need to understand the immunological response that mediates protective immunity to SARS-CoV-2. Antibody responses to the spike (S) protein are thought to be to the primary target of neutralizing activity during viral infection, conferring superior protective immunity compared to the membrane (M), envelope (E), and nucleocapsid proteins.1, 2, 3 The S glycoprotein is a class I viral fusion protein that exists as a metastable prefusion homotrimer consisting of individual polypeptide chains (between 1,100 and 1,600 residues in length) responsible for cell attachment and viral fusion.4, 5, 6 Each of the S protein protomers is divided into two distinct regions, the S1 and S2 subunits.4,7 The S1 subunit is a V-shaped polypeptide with four distinct domains, domains A, B, C, and D, with domain B functioning as the receptor-binding domain (RBD) for most coronaviruses, including the pathogenic β-coronaviruses such as SARS-CoV-2, severe acute respiratory syndrome (SARS), and Middle East respiratory syndrome (MERS) (Figure 1A; Figure S1A).7, 8, 9, 10 Recent studies have shown that the SARS-CoV-2 RBD interacts with the ACE2 receptor for cellular attachment.5,6,10 Sequence analysis of the RBD shows extensive homology in this region to SARS (73%). In contrast, MERS and other seasonal coronaviruses show minimal sequence homology to the SARS-CoV-2 RBD (7%–18%) (Figure 1B). Herein, we set out to understand the development, specificity, and neutralizing potency of the humoral immune response against the RBD of the SARS-CoV-2 spike protein during acute infection.
Figure 1.

Antibody Responses against SARS-CoV-2 RBD in PCR-Confirmed Acutely Infected COVID-19 Patients
(A) Structure of a SARS-CoV-2 spike protein (single monomer is shown) with the RBD highlighted in red.6
(B) Sequence homology analysis of SARS-CoV-2 spike protein RBD compared to SARS, MERS, and seasonal alpha- and beta-CoVs.
(C) ELISA endpoint titers for SARS-CoV-2 RBD-specific IgG, IgA, and IgM in PCR confirmed acute COVID-19 patients (n = 44) and healthy controls collected in early 2019. Endpoint cutoff values were calculated using the average plus 3 standard deviations of the 32 healthy controls at 1/100 dilution (shown as a dotted line).
(D) Representative ELISA assays for 10 patients and 12 healthy controls.
(E) Direct comparison of IgM and IgG for individual donors. A number of the IgG negative or low early samples were IgM positive (shown in green).
(F) Endpoint titer analysis of IgG subclass distribution. Each experiment was performed at least twice, and representative donors were selected to display the dynamic range observed in the dataset.
Results
The Magnitude of RBD-Specific Antibody Responses in Acutely Infected COVID-19 Patients
To determine the magnitude of antibody responses, immunoglobulin (Ig) isotype, and IgG subclass usage against the RBD of the SARS-CoV-2 spike protein, we analyzed a cohort of acutely infected COVID-19 patients (n = 44) enrolled at two hospitals in the Emory Healthcare System in Atlanta (Emory University Hospital and Emory University Hospital Midtown). These patients were recruited from both the inpatient ward and the ICU (patient details are provided in Table 1). These samples represent a cross-section of days after patient-reported symptom onset (3–30 days) and PCR confirmation (2–19 days). As healthy controls, we used plasma samples collected at baseline in a vaccine study performed in early 2019 (n = 32). The RBD protein was cloned and expressed in mammalian cells (Figure S1B) and was validated by ELISA using CR3022, a SARS-specific human monoclonal antibody that cross-reacts with SARS-CoV-211 (Figure S1C). Size-exclusion chromatography shows that the recombinant RBD protein is homogeneous and does not form aggregates (Figure S1D). We found that a majority of COVID-19 patients (36 out of 44) developed RBD-specific class-switched IgG responses (Figure 1C) (mean titer: 18,500, range: <100–142,765). These patients also showed IgM and IgA responses of lower magnitude as compared to IgG (IgM mean titer: 3731, range: <100–40,197 and IgA mean titer: 973, range: <100–19,918). All of the negative controls were below the limit of detection in the endpoint analysis for binding to the RBD antigen (Figure 1C, red). A representative RBD-specific IgG ELISA assay for a subset of these donors is shown in Figure 1D to illustrate the dynamic range of these measurements. A number of the COVID-19 patient samples that scored either negative or low in the RBD IgG ELISA had higher titers of IgM (Figure 1E, green). Finally, IgG subclass analysis showed that the COVID-19 patients exclusively made RBD-specific IgG1 and IgG3, with no detectable IgG2 or IgG4 (Figure 1F). Taken together, these findings illustrate that antibody class-switching to IgG occurs early during acute infection.
Table 1.
COVID-19 Patient Cohort
| Patient ID# | Age | Sex | Days after +PCR | Days after Symptom Onset | IgG | IgM | IgA | FRNT50 |
|---|---|---|---|---|---|---|---|---|
| 1 | 25 | F | 2 | 3 | <100 | <100 | <100 | <50 |
| 2 | 41 | M | 2 | 8 | 259 | 599 | 116 | 245 |
| 3 | 66 | M | 2 | 10 | 4,988 | 795 | 297 | 1,502 |
| 4 | 76 | F | 2 | 11 | 31,205 | 2906 | 230 | 1,718 |
| 5 | 70 | F | 2 | 11 | 1,100 | 246 | <100 | 138 |
| 6 | 74 | M | 2 | 12 | <100 | <100 | <100 | <50 |
| 7 | 33 | F | 3 | 7 | 243 | 325 | <100 | 174 |
| 8 | 66 | M | 3 | 8 | 419 | 220 | 85 | 167 |
| 9 | 64 | F | 3 | 8 | <100 | 166 | <100 | 55 |
| 10 | 39 | F | 3 | 8 | 814 | 362 | 287 | 262 |
| 11 | 87 | M | 3 | 9 | <100 | <100 | <100 | 124 |
| 12 | 64 | F | 3 | 9 | <100 | 119 | 161 | 67 |
| 13 | 47 | F | 3 | 9 | 467 | 1,042 | <100 | 158 |
| 14 | 63 | F | 3 | 10 | 134 | 186 | <100 | 99 |
| 15 | 58 | F | 3 | 11 | 317 | 364 | 258 | 175 |
| 16 | 37 | F | 3 | 13 | 205 | 419 | <100 | 126 |
| 17 | 37 | F | 3 | 14 | 202 | 578 | <100 | 118 |
| 18 | 49 | M | 3 | 16 | 15,772 | 491 | 589 | 126 |
| 19 | 70 | M | 4 | 5 | <100 | 136 | <100 | 156 |
| 20 | 55 | M | 4 | 8 | 377 | 1,560 | 178 | 79 |
| 21 | 73 | M | 4 | 11 | 683 | 303 | <100 | <50 |
| 22 | 61 | M | 4 | 19 | 445 | 282 | <100 | 645 |
| 23 | 80 | M | 5 | 5 | 899 | 470 | 316 | 167 |
| 24 | 44 | F | 5 | 9 | 2,560 | 947 | 442 | 194 |
| 25 | 63 | F | 5 | 12 | <100 | <100 | <100 | <50 |
| 26 | 52 | M | 5 | 12 | <100 | 317 | <100 | 108 |
| 27 | 56 | M | 5 | 17 | 10,422 | 1,574 | 4,033 | 3,200 |
| 28 | 48 | M | 6 | 8 | 9,311 | 1,750 | 884 | 1,068 |
| 29 | 60 | M | 6 | 10 | 27,557 | 50,483 | <100 | 5,763 |
| 30 | 75 | M | 6 | 18 | 1,174 | 369 | 131 | 539 |
| 31 | 59 | M | 7 | 11 | 21,323 | 3,865 | 140 | 2,799 |
| 32 | 62 | F | 7 | 12 | 17,917 | 4,414 | 706 | 603 |
| 33 | 76 | M | 7 | 17 | 28,352 | 1,493 | 6,865 | 2,561 |
| 34 | 66 | M | 7 | 22 | 4,269 | 1,207 | 324 | 496 |
| 35 | 80 | M | 7 | 29 | 22,219 | 1,242 | 176 | 2,483 |
| 36 | 65 | M | 8 | 8 | 1,692 | 507 | <100 | 761 |
| 37 | 36 | F | 8 | 15 | 86,698 | 664 | 313 | 2,233 |
| 38 | 60 | F | 8 | 15 | 43,072 | 443 | 214 | 337 |
| 39 | 56 | F | 8 | 18 | 71,204 | 16,298 | 1,754 | 1,177 |
| 40 | 54 | M | 10 | 30 | 72,949 | 13,310 | 700 | 3,341 |
| 41 | 60 | M | 12 | 17 | 142,766 | 40,197 | <100 | 5,378 |
| 42 | 46 | M | 13 | 20 | 69,361 | 706 | 1,112 | 408 |
| 43 | 73 | M | 15 | 11 | 69,902 | 3,412 | 19,918 | 911 |
| 44 | 69 | M | 19 | 18 | 33,684 | 5,517 | 180 | 1,882 |
Neutralization Potency of Antibody Responses in COVID-19 Patients
We next determined the neutralization capacity of samples from the cohort of acutely infected COVID-19 patients. We have developed a focus reduction neutralization titer (FRNT) assay for SARS-CoV-2. In this assay, COVID-19 patient plasma is incubated with a clinical isolate of SARS-CoV-2 followed by infection of VeroE6 cells.12 The neutralization potency of the plasma sample is measured by the reduction in virally infected foci. We screened plasma from COVID-19 patients (n = 44) and found that a majority of the samples (40/44) showed neutralization capacity, with titers ranging from 1:5,763 to 1:55 (Figure 2A). A representative example of viral neutralization is shown in Figure 2B where pre-incubation with control plasma yields about 250 foci, whereas the COVID-19 patient sample completely inhibited the formation of infected foci (Figure 2B). Representative neutralization curves for a subset of samples are shown to illustrate the dynamic range of the results obtained (Figure 2C). A plaque reduction neutralization titer (PRNT) assay is the classic method for determining the neutralization capacity of a plasma sample against coronavirus infection.13 To confirm the efficiency of these two assays, we compared the neutralization titers between a standard PRNT assay and an FRNT assay for a subset of the patient samples (n = 9). Overall, we observed a strong positive correlation between these two assays (Figure 2D), demonstrating the robustness of the FRNT assay. Overall, these findings demonstrate that neutralizing antibody responses are generated early during acute COVID-19 infection.
Figure 2.

COVID-19 Patient Plasma Neutralizes SARS-CoV-2
(A) Neutralization activity of serum samples against SARS-CoV-2. The FRNT50 titers of COVID-19 patients (n = 44) and healthy controls (n = 21) sera were determined by a FRNT assay using an immunostain to detect infected foci. Each circle represents one serum sample. The dotted line represents the maximum concentrations of the serum tested (1/50).
(B) Representative sample showing a reduction in foci from a neutralization assay with sera from an infected COVID-19 patient.
(C) Representative FRNT50 curves were selected to display the dynamic range observed in the dataset (n = 22). The dotted line represents 50% neutralization.
(D) Comparison of PRNT50 against FRNT50 titers (n = 9). Each experiment was performed at least twice, and a representative dataset is shown.
Development of Antibody Responses during Acute SARS-CoV-2 Infection
The patient samples were collected across a range of days after symptom onset or PCR confirmation of SARS-CoV-2 infection (Table 1). To understand the relationship between these variables and RBD-specific IgG antibody titers and viral neutralization potency, we performed correlation analyses. In all cases, we observed significant correlations between the number of days elapsed after symptom onset or positive PCR test and the RBD-specific IgG titer or viral neutralization titer (Figure 3). Several key points regarding the kinetics of antibody responses can be made from this correlation analysis. Antibody responses against the RBD (Figure 3A), as well as SARS-CoV-2 virus neutralization titers (Figure 3B), can be detected in a majority of patients around day 8 after symptom onset. When the number of days after PCR confirmation is used to assess the duration of infection, both RBD-binding titers (Figure 3C) and viral neutralization titers (Figure 3D) can be detected in many patients already between days 2–6. Beyond 6 days post-PCR confirmation, patients display both antibody binding and neutralization titers. Taken together, these findings illustrate that both RBD-specific and neutralizing antibody responses occur rapidly after SARS-CoV-2 infection.
Figure 3.

SARS-CoV-2 Antibody Responses Correlate with the Progression of Acute SARS-CoV-2 Infection
Comparison of RBD-specific IgG titers and neutralization titers with (A and B) days after symptom onset or (C and D) days after PCR positive confirmation for each patient. Correlation analysis was performed by log transformation of the endpoint ELISA titers followed by linear regression analysis.
RBD-Specific Antibody Titers as a Surrogate of Neutralization Potency in Acutely Infected COVID-19 Patients
We observed a wide range of RBD-specific and neutralizing antibody responses across the cohort of acutely infected COVID-19 patients. We found that the magnitude of RBD-specific IgG titers positively correlated with neutralization titers (r2 = 0.7; p < 0.0001; Figure 4A). Overall, we observed viral neutralization activity in 40 out of 44 samples from acutely infected COVID-19 patients.
Figure 4.

RBD-Specific Antibody Titers as a Surrogate of Neutralization Potency in Acutely Infected COVID-19 Patients
(A) Comparison of RBD-specific IgG endpoint titers with SARS-CoV-2-specific FRNT50 titers. Correlation analysis was performed by log transformation of the endpoint ELISA or FRNT50 titers followed by linear regression analysis.
(B) The RBD-specific ELISA was validated for high-throughput clinical testing in Emory Medical Laboratories. Sera (n = 231) were collected from COVID-19 patients within the first 22 days after PCR-confirmation (Table S1). Sera (n = 490) collected in 2019 were used as negative controls. ROC curves are shown comparing the true-positive and false-negative rates of the ELISA using different OD cutoffs and sera collected at different times post-infection. Whereas the RBD ELISA produced an area under the curve (AUC) of 0.89 when samples were collected close to the time of infection (within 3 days of positive PCR; n = 76), longer sampling times resulted in better performance. Assay performance was nearly perfectly discriminatory (AUC = 1.00) when samples were collected at least 7 days after the positive PCR (n = 83).
We next validated the RBD-specific IgG ELISA for high-throughput testing at the Emory Medical Laboratories. For these analyses, we collected serum from 231 PCR-confirmed COVID-19 patient samples within the first 22 days after PCR confirmation (Table S1). In addition, 490 samples collected in 2019 were used as negative controls. The patient samples were grouped from 0–3 days, 4–6 days, and 7 or more days after PCR confirmation and analyzed using a high-throughput clinical RBD ELISA. The cumulative results of these efforts are shown as receiver operating characteristic (ROC) curves (Figure 4B). This assay is almost perfectly discriminatory by day 7 after PCR confirmation, with an area under the curve (AUC) of 1.00 (n = 83). When utilized earlier in the disease course, the performance of this diagnostic assay is reduced. When the RBD-specific IgG ELISA were analyzed for the samples collected closer to the time of infection, the AUC for the day 4–6 group (n = 76) and the day 0–3 group (n = 72) fell to 0.96 and 0.89, respectively. Using an OD cutoff of 0.175 resulted in calculated sensitivity and specificity values of 97.5% and 98%, respectively. Taken together, these findings demonstrate that RBD-specific IgG titers could be used as a surrogate of neutralization activity against SARS-CoV-2 infection and that the RBD assay is highly specific and sensitive. Further, this demonstrates the necessity of appropriate timing of sample collection when using serologic diagnostic tests of acutely infected COVID-19 patients.14,15
Discussion
In this study, we show that RBD-specific IgG antibody responses are rapidly induced in hospitalized acutely infected COVID-19 patients, with most patients showing RBD-specific antibody responses by 6 days post-PCR confirmation. Consistently, we found that class-switching also occurs early during infection and is dominated by RBD-specific IgG1 and IgG3 responses. We also detected both RBD-specific IgM and IgA responses at relatively lower levels as compared to IgG. These responses result in neutralizing antibody responses that directly correlated with RBD-specific IgG antibody titers. These findings strongly indicate that a robust humoral immune response occurs early during severe or moderate COVID-19 infections.
The validation of the sensitive and selective RBD-based clinical assay at Emory Medical Laboratories and the correlation with viral neutralization are promising for both diagnostic purposes and ongoing seroprevalence studies of healthcare workers and the general population. These serology tests could be used for making informed decisions for convalescent plasma therapy that are currently undergoing clinical testing as a possible therapeutic or even prophylactic option.16,17 Further, the kinetic findings presented herein are essential for ongoing efforts aimed at applying antibody testing for clinical diagnostic purposes, highlighting the importance of appropriate timing of these tests relative to PCR testing and/or symptom onset after infection. A comprehensive understanding of the dynamics of antibody responses after infection will also be key for understanding disease pathogenesis, risk assessment in vulnerable populations, evaluation of therapeutics, and development of vaccines.
The appearance of high titer neutralizing antibody responses early after the infection is promising and may offer some degree of protection from re-infection. Future studies will need to define the neutralizing titer that constitutes a robust correlate of protective immunity and determine the durability of these responses over time18. This information will be essential for ongoing vaccine development efforts19.
Limitations of Study
This report is a cross-sectional study that analyzed antibody responses to SARS-CoV-2 in a cohort of hospitalized COVID-19 patients. One limitation is that this study only includes patients with severe disease. In the future, we will extend these observations to evaluate antibody responses in patients with mild or subclinical infections. Another important aspect that we are currently addressing is the durability of neutralizing antibody responses in recovered COVID-19 patients.
STA★RMethods
Key Resources Table
| REAGENT or RESOURCE | SOURCE | IDENTIFIER |
|---|---|---|
| Antibodies | ||
| Peroxidase AffiniPure F(ab’)2 Fragment Goat Anti-Human IgM, Fc5μ fragment specific | Jackson ImmunoResearch | Cat# 109-036-129, RRID:AB_2337598 |
| Peroxidase AffiniPure F(ab’)2 Fragment Goat Anti-Human Serum IgA, α chain specific | Jackson ImmunoResearch | Cat# 109-036-011, RRID:AB_2337592 |
| Peroxidase AffiniPure F(ab’)2 Fragment Goat Anti-Human IgG, Fcγ fragment specific | Jackson ImmunoResearch | Cat# 109-036-098, RRID:AB_2337596 |
| Mouse Anti- Human IgG1 Fc-HRP | Southern Biotech | Cat# 9054-05, RRID:AB_2796627 |
| Mouse Anti- Human IgG2 Fc-HRP | Southern Biotech | Cat# 9060-05, RRID:AB_2796633 |
| Mouse Anti- Human IgG3 Hinge-HRP | Southern Biotech | Cat# 9210-05, RRID:AB_2796699 |
| Mouse Anti- Human IgG4 Fc-HRP | Southern Biotech | Cat# 9200-05, RRID:AB_2796691 |
| Virus Strains | ||
| 2019-nCoV/USA-WA1-A12/2020 (SARS-CoV-2) | CDC, Atlanta, GA | GenBank Accession #MT020880 |
| Biological Samples | ||
| Human Serum/Plasma samples | Emory University Hospital/Emory Medical Laboratories | N/A |
| Chemicals, Peptides, and Recombinant Proteins | ||
| Recombinant binding protein (SARS-CoV-2 Spike) | Dr. Jens Wrammert Emory University | N/A |
| Methylcellulose | Sigma-Aldrich | Cat. #: M0512-250G |
| TrueBlue Peroxidase Substrate | KPL | Cat. #: 5067428 |
| Experimental Models: Cell Lines | ||
| VeroE6 C1008 cells | ATCC | Cat# CRL-1586, RRID:CVCL_0574 |
| Software and Algorithms | ||
| GraphPad Prism (v7 and v8) | N/A | N/A |
Resource Availability
Lead Contact
Further information and requests for resources and reagents should be directed to and will be fulfilled by the Lead Contact Author Mehul Suthar (mehul.s.suthar@emory.edu).
Materials Availability
All unique/stable reagents generated in this study are available from the Lead Contact with a completed Materials Transfer Agreement.
Data and Code Availability
The datasets supporting the current study are available from the corresponding author on request.
Experimental Model and Subject Details
Ethics statement
The serum and plasma samples used for this study were collected at Emory University Hospital and Emory University Hospital Midtown in Atlanta. All patients were adults diagnosed with acute SARS-CoV-2 infection by PCR, and samples were collected at a range of times post-PCR-confirmation. No specific criteria or demographics were used for enrollment beyond PCR confirmed SARS-CoV-2 infection. All collection, processing, and archiving of human specimens was performed under approval from the University Institutional Review Board (IRB #00000510 and #00022371). For IRB #00000510, informed consent was obtained prior to patient participation. For #00022371, an IRB waiver was obtained allowing the use of discarded samples in the clinical laboratory at the Emory Hospital.
Virus
SARS-CoV-2 (2019-nCoV/USA_WA1/2020) was isolated from the first reported case in the US12. A plaque purified passage 4 stock was kindly provided by Natalie Thornburg (CDC, Atlanta, GA). Viral titers were determined by plaque assay on Vero cells (ATCC).
Cells
VeroE6 cells were obtained from ATCC (C1008) and cultured in complete DMEM medium consisting of 1x DMEM (Corning Cellgro), 10% FBS, 25mM HEPES Buffer (Corning Cellgro), 2mM L-glutamine, 1mM sodium pyruvate, 1x Non-essential Amino Acids, and 1x antibiotics. Expi293F cells were obtained from ThermoFisher Scientific (A14527), and maintained according to the manufaturors protocols.
Method Details
Cloning, expression, and purification of SARS-CoV-2 RDB
A recombinant form of the spike glycoprotein receptor-binding domain (RBD) from SARS-CoV-2, Wuhan-Hu-1 (GenPept: QHD43416) was cloned for mammalian expression in human embryonic kidney expi293F cells. The receptor-binding domain consisting of amino acids 319 (arginine) to 541 (phenylalanine) of the SARS-Cov-2 S gene was amplified by PCR using a mammalian codon-optimized sequence as the DNA template (Genscript MC_0101081). PCR amplification appended the first 12 amino acids of the native S gene signal peptide sequence to the N-terminal end of the protein and, at the C-terminal end a 6X polyhistidine tag preceded by a short linker sequence (GGGGS).
Forward and Reverse primer sequences consisted were:
5′-AGAGAATTCACCATGTTCGTCTTCCTGGTCCTGCTGCCTCTGGTCTCCAGGGTGCAGC CACCGAGTCTATC-3′
and 5′-CTCTAAGCTTCTATCATTAGTGGTGGTGGTGGTGGTGGCTTCCGCCTCCGCCGAA GTTCACGCACTTGTTCTTCAC-3′.
25 uL PCR reaction conditions were: 1X Phusion HF Buffer, 0.2 mM dNTP, 0.63 units Phusion DNA polymerase, and 500 nM of each primer. PCR cycling conditions were: initial denaturation at 98°C, 1 minute; then 25 cycles of: 98°C, 20 s, 65°C 30 s, 72°C 30 s; followed a final extension at 72°C for 5 minutes. Following amplification, purified PCR products (QIAquick PCR Purification, QIAGEN) were digested with EcoRI-HF (NEB) and HindIII (NEB) and cloned into the EcoRI-HindIII cloning site of a mammalian expression vector containing a CMV promoter (GenBank Reference ID FJ475055). Plasmid DNA was prepared using the QIAGEN PlasmidPlus Midi purification system and constructs were sequence verified. Recombinant protein expression was performed in Expi293F cells according to the manufacturer’s instructions (ThermoFisher Scientific). Briefly, expression plasmid DNA was complexed with the expifectamine lipid-based transfection reagent. Complexes were added to the cell suspensions shaking at 125 RPM and incubated overnight at 37°C in an 8% CO2 humidified incubator. After 20 hours, protein expression supplements and antibiotics were added. Cultures were then incubated for an additional three days to allow for expression into the supernatant. Cell culture supernatants were harvested by centrifugation at 16,000xg for 10 minutes. Supernatants were sterile filtered through a 0.2 um filter and stored at 4°C for < 7 days before purification. Analytical SDS-PAGE was performed on supernatants and the protein concentration in solution was determined by densitometry relative to the purified protein. Recombinant RBD protein levels were between 100 mg and 150 mg per liter. Purification was performed according to manufacturer’s instructions using 5 mL HisTALON Superflow Cartridges (Clontech Laboratories). Briefly, an additional 11.7 g/L of sodium chloride and 0.71 g/L of cobalt(II) chloride hexahydrate were added to culture supernatants, which were adjusted to pH 7.5. The supernatant was then loaded on to the column equilibrated with 10 column volumes of 50 mM phosphate 300 mM sodium chloride buffer pH 7.5 (equilibration buffer). The column was washed with 8 column volumes of equilibration buffer supplemented with 10 mM imidazole. Protein was eluted with 6 column volumes of equilibration buffer supplemented with 150 mM imidazole. The eluted protein was dialyzed overnight against 80 volumes of phosphate-buffered saline pH 7.2. The protein was filter-sterilized (0.2 μm) and normalized to 1 mg/mL by UV spectrophotometry using an absorption coefficient of 1.3 AU at 280 nm = 1 mg/mL. Proteins were aliquoted and stored at −80°C prior to use. SDS-PAGE analysis of purified recombinant protein stained with Coomassie blue demonstrated that samples were > 90% pure (Figure 1). The RBD resolves at an apparent molecular weight of 30 kDa (Figure 1D) which is slightly larger than the theoretical molecular weight of 26.5 kDa, presumably caused by glycosylation.
Preparation of CR3022 monoclonal antibody and biotinylation
The SARS-CoV S glycoprotein specific antibody CR3022 was generated recombinantly using previously reported heavy and light variable domain sequences deposited in GenBank under accession numbers DQ168569 and DQ16857011. Antibody variable domain gene sequences were synthesized by IDT and cloned into human IgG1 and human kappa expression vectors as previously described20. Antibodies were produced in Expi293F cells according to the manufacturer’s recommendations by co-transfecting heavy and light chain plasmids at a ratio of 1:1.5. Antibodies were purified using rProtein A Sepharose Fast Flow antibody purification resin (GE Healthcare) and buffer exchanged into PBS before use. Biotinylated versions of CR3022 used in viral neutralization assays were produced by combining the antibody with a 20 molar excess of EZ-Link NHS-PEG4-Biotin (ThermoFisher Scientific) for 1 hour at room temperatures. Reactions were stopped by adding Tris pH 8 to a final concentration of 10 mM. The biotinylated antibody was then buffer exchanged > 1000X into PBS using a 10 kDa protein spin-concentrator (Amicon).
Sequence analysis and alignment
The SARS-CoV-2 spike protein structure21 was visualized in Pymol (Schrödinger, LLC). To assess the homology of coronavirus spike proteins, a global protein alignment was performed in Geneious (Geneious, Inc.) with translations of genome sequences accessed through NCBI Nucleotide. Sequences used were GenBank MN908947.3 (SARS-CoV-2), RefSeq NC_004718.3 (SARS-CoV), RefSeq NC_019843.3 (MERS-CoV), NC_006577.2 (HCoV-HKU1), RefSeq NC_006213.1 (HCoV-OC43), RefSeq NC_005831.2 (HCoV-NL63), and RefSeq NC_005831.2 (HCoV-229E). Homology at the RBD was determined by sequence identity between SARS-CoV-2 RBD residues T302 to L5606,10.
ELISA assays
Recombinant SARS-CoV-2 RDB was coated on Nunc MaxiSorp plates at a concentration of 1 μg/mL in 100 uL phosphate-buffered saline (PBS) at 4°C overnight. Plates were blocked for two hours at room temperature in PBS/0.05%Tween/1% BSA (ELISA buffer). Serum or plasma samples were heated to 56°C for 30 min, aliquoted, and stored at −20°C before use. Samples were serially diluted 1:3 in dilution buffer (PBS-1% BSA-0.05% Tween-20) starting at a dilution of 1:100. 100 μL of each dilution was added and incubated for 90 minutes at room temperature. 100 uL of horseradish peroxidase-conjugated isotype and subclass specific secondary antibodies, diluted 1 to 2,000 in ELISA buffer, were added and incubated for 60 minutes at room temperature. Development was performed using 0.4 mg/mL o-phenylenediamine substrate (Sigma) in 0.05 M phosphate-citrate buffer pH 5.0, supplemented with 0.012% hydrogen peroxide before use. Reactions were stopped with 1 M HCl and absorbance was measured at 490 nm. Between each step, samples were washed four times with 300 uL of PBS-0.05% Tween. Prior to development, plates were additionally washed once with 300 uL of PBS. Secondary antibodies used for development were as follows: anti-hu-IgM-HRP, anti-hu-IgG-HRP, and anti-hu-IgA-HRP (Jackson Immuno Research, and Mouse anti-hu-IgG1 Fc-HRP, Mouse anti-hu-IgG2 Fc-HRP, Mouse anti-hu-IgG3 Fc-HRP, or Mouse anti-hu-IgG4 Fc-HRP (Southern Biotech).
Clinical RBD ELISA assay
This assay was performed essentially as described above, with the following modifications to increase throughput: all serum samples were diluted 1:200, and the incubation times were reduced to 30 minutes after the addition of serum samples and the secondary antibody conjugate.
Focus Reduction Neutralization Assays
Serially diluted patient plasma and COVID-19 (100-200 FFU) were combined in DMEM + 1% FBS (Corning Cellgro), and incubated at 37°C for 1 hour. The antibody-virus mixture was aliquoted on a monolayer of VeroE6 cells, gently rocked to distribute the mixture evenly, and incubated at 37°C for 1 hour. After 1 hour, the antibody-virus inoculum was removed and prewarmed DMEM supplemented with 1% FBS (Optima, Atlanta Biologics), HEPES buffer (Corning Cellgro), 2mM L-glutamine (Corning Cellgro), 1mM sodium pyruvate (Corning Cellgro), 1x Non-essential Amino Acids (Corning Cellgro), 1x antibiotics (penicillin, streptomycin, amphotericin B; Corning Cellgro) was mixed with methylcellulose (DMEM [Corning Cellgro], 1% antibiotic, 2% FBS, 2% methylcellulose [Sigma Aldrich]) at a 1:1 ratio and overlaid on the infected VeroE6 cell layer. Plates were incubated at 37°C for 24 hours. After 24 hours, plates were gently washed three times with 1x PBS (Corning Cellgro) and fixed with 200 μl of 2% paraformaldehyde (Electron Microscopy Sciences) for 30 minutes. Following fixation, plates were washed twice with 1x PBS and 100 μl of permeabilization buffer (0.1% BSA-Saponin in PBS) (Sigma Aldrich), was added to the fixated Vero cell monolayer for 20 minutes. Cells were incubated with an anti-SARS-CoV spike protein primary antibody conjugated to biotin (CR3022-biotin) for 1-2 hours at room temperature, then with avidin-HRP conjugated secondary antibody for 1 hour at room temperature. Foci were visualized using True Blue HRP substrate and imaged on an ELISPOT reader (CTL). Each plate contained three positive neutralization control wells, three negative control wells containing healthy control serum mixed with COVID-19, and three mock-infected wells.
Quantification and Statistical Analysis
Statistical analysis
FRNT50 curves were generated by non-linear regression analysis using the 4PL sigmoidal dose curve equation on Prism 8 (Graphpad Software). Maximum neutralization (100%) was considered the number of foci counted in the wells infected with a virus mixed with COVID-19 naive healthy patient serum. Neutralization titers were calculated as 100% x [1-(average number of foci in wells incubated with COVID-19 patient serum) ÷ (average number of foci in wells incubated with control serum)]. For the clinical data Receiver Operating Characteristic (ROC) curves were generated separately for each of three cohorts of clinical validation samples with progressively increasing PCR-to-serum collection intervals (0-3 days, 4-6 days, 7+ days). Optical densities (OD) for each sample were entered into Microsoft Excel for Office 365 v16, and a custom software package was used to iteratively compute the false positive rate (1 - specificity) and true positive rate (sensitivity) at every OD cutoff level for each cohort. The false-positive rates (x) and true positive rates (y) were then rendered as scatterplots to generate the ROC curves. Correlations analyses were done by log transforming RBD binding titers or neutralization titers, followed by linear regression analysis. The R2 and p value are reported in each figure.
Acknowledgments
We would like to thank Laurel Bristow, Ariel Kay, Youssef Saklawi, Ghina Alaaeddine, Nina McNair, Ellie Butler, Brandi Johnson, Christopher Huerta, Jennifer Kleinhenz, Vinit Karmali, Yong Xu, Dongli Wang, and Michele McCullough for sample processing at the Hope Clinic. We also acknowledge the dedicated efforts of Hassan Bilal, DeAndre Brown, Davette Campbell, Lisa Cole, Ginger Crews, Shanessa Fakour, Natalie Hicks, Mark Meyers, and Katherine Normile for sample collection, processing, and organization. We thank Gabrielle Holenstein, Corin Jones, Alethea Luo-Gardner, Hoa Nguyen, Keyanna Seville, and Corazon Tomblin for the exceptional technical performance of the ELISA at the Emory Medical Laboratories. We also acknowledge thorough and rapid chart reviews by Kari Broder. We thank Guido Silvestri for helpful discussions. We thank Michael Konomos for help with generating the graphical abstract. Finally, we thank all the participating patients and the hospital staff caring for them. This work was funded in part by an Emory EVPHA Synergy Fund award (M.S.S. and J.W.), and by the National Institutes of Health NIAID Infectious Diseases Clinical Research Consortium (IDCRC) UM1 AI148684 (D.S.S., R.A., and J.W), R01 AI137127 (J.W.), ORIP/OD P51OD011132 (M.S.S.), 5T32 AI074492 (S.L.L.), R00 AG049092 (V.D.M.), World Reference Center for Emerging Viruses and Arboviruses R24 AI120942 (V.D.M.), HIPC 5U19AI090023-10 (N.R., E.A., and A.M.), VTEU 1UM1AI148576-01 (E.A. and N.R.), and a grant from The Marcus Foundation (J.D.R). The funders had no role in study design, data collection and analysis, decision to publish, or preparation of the manuscript.
Author Contributions
M.S., S.R., H.P.V., D.N.A., J.G., G.M., S.L., and A.V. contributed to the acquisition, analysis, and interpretation of the data, J.B. and M.C.H. contributed to the acquisition and interpretation of the data, C.M.A. and N.S. contributed to the acquisition of the data, G.H.S., M.G.Z., and R.C.K. contributed to the acquisition, analysis, and interpretation of the data and helped draft the work, A.K.M., A.S.N., and S.R.S. contributed to the acquisition, analysis, and interpretation of the data, as well as the conception and design of the work, D.S.S., L.N., S.A., M.A., W.H.H., C.W.D., and V.D.M. contributed to the analysis, and interpretation of the data, S.E. served as the principal investigator of the clinical protocol for acquisition of patient samples and contributed to the interpretation of data, E.M.S., K.H., A.C., J.A.M., N.R., and E.J.A. contributed to the acquisition and interpretation of the data, and J.D.R., R.A., J.W., and M.S.S. contributed to the acquisition, analysis, and interpretation of the data, as well as the conception and design of the work, and writing the manuscript.
Declaration of Interests
The authors declare no competing interests.
Published: June 5, 2020
Footnotes
Supplemental Information can be found online at https://doi.org/10.1016/j.xcrm.2020.100040.
Contributor Information
Mehul S. Suthar, Email: mehul.s.suthar@emory.edu.
Jens Wrammert, Email: jwramme@emory.edu.
Supplemental information
References
- 1.Bolles M., Donaldson E., Baric R. SARS-CoV and emergent coronaviruses: viral determinants of interspecies transmission. Curr. Opin. Virol. 2011;1:624–634. doi: 10.1016/j.coviro.2011.10.012. [DOI] [PMC free article] [PubMed] [Google Scholar]
- 2.Deming D., Sheahan T., Heise M., Yount B., Davis N., Sims A., Suthar M., Harkema J., Whitmore A., Pickles R. Vaccine efficacy in senescent mice challenged with recombinant SARS-CoV bearing epidemic and zoonotic spike variants. PLoS Med. 2006;3:e525. doi: 10.1371/journal.pmed.0030525. [DOI] [PMC free article] [PubMed] [Google Scholar]
- 3.Buchholz U.J., Bukreyev A., Yang L., Lamirande E.W., Murphy B.R., Subbarao K., Collins P.L. Contributions of the structural proteins of severe acute respiratory syndrome coronavirus to protective immunity. Proc. Natl. Acad. Sci. USA. 2004;101:9804–9809. doi: 10.1073/pnas.0403492101. [DOI] [PMC free article] [PubMed] [Google Scholar]
- 4.Bosch B.J., van der Zee R., de Haan C.A., Rottier P.J. The coronavirus spike protein is a class I virus fusion protein: structural and functional characterization of the fusion core complex. J. Virol. 2003;77:8801–8811. doi: 10.1128/JVI.77.16.8801-8811.2003. [DOI] [PMC free article] [PubMed] [Google Scholar]
- 5.Hoffmann M., Kleine-Weber H., Schroeder S., Kruger N., Herrler T., Erichsen S., Schiergens T.S., Herrler G., Wu N.H., Nitsche A. SARS-CoV-2 Cell Entry Depends on ACE2 and TMPRSS2 and Is Blocked by a Clinically Proven Protease Inhibitor. Cell. 2020;181:271–280. doi: 10.1016/j.cell.2020.02.052. [DOI] [PMC free article] [PubMed] [Google Scholar]
- 6.Wang Q., Zhang Y., Wu L., Niu S., Song C., Zhang Z., Lu G., Qiao C., Hu Y., Yuen K.Y. Structural and Functional Basis of SARS-CoV-2 Entry by Using Human ACE2. Cell. 2020;181:894–904. doi: 10.1016/j.cell.2020.03.045. [DOI] [PMC free article] [PubMed] [Google Scholar]
- 7.Tortorici M.A., Veesler D. Structural insights into coronavirus entry. Adv. Virus Res. 2019;105:93–116. doi: 10.1016/bs.aivir.2019.08.002. [DOI] [PMC free article] [PubMed] [Google Scholar]
- 8.Li F., Li W., Farzan M., Harrison S.C. Structure of SARS coronavirus spike receptor-binding domain complexed with receptor. Science. 2005;309:1864–1868. doi: 10.1126/science.1116480. [DOI] [PubMed] [Google Scholar]
- 9.Lu G., Hu Y., Wang Q., Qi J., Gao F., Li Y., Zhang Y., Zhang W., Yuan Y., Bao J. Molecular basis of binding between novel human coronavirus MERS-CoV and its receptor CD26. Nature. 2013;500:227–231. doi: 10.1038/nature12328. [DOI] [PMC free article] [PubMed] [Google Scholar]
- 10.Walls A.C., Park Y.J., Tortorici M.A., Wall A., McGuire A.T., Veesler D. Structure, Function, and Antigenicity of the SARS-CoV-2 Spike Glycoprotein. Cell. 2020;181:281–292. doi: 10.1016/j.cell.2020.02.058. [DOI] [PMC free article] [PubMed] [Google Scholar]
- 11.ter Meulen J., van den Brink E.N., Poon L.L., Marissen W.E., Leung C.S., Cox F., Cheung C.Y., Bakker A.Q., Bogaards J.A., van Deventer E. Human monoclonal antibody combination against SARS coronavirus: synergy and coverage of escape mutants. PLoS Med. 2006;3:e237. doi: 10.1371/journal.pmed.0030237. [DOI] [PMC free article] [PubMed] [Google Scholar]
- 12.Harcourt J., Tamin A., Lu X., Kamili S., Sakthivel S.K., Murray J., Queen K., Tao Y., Paden C.R., Zhang J. Severe Acute Respiratory Syndrome Coronavirus 2 from Patient with Coronavirus Disease, United States. Emerg. Infect. Dis. 2020;26:1266–1273. doi: 10.3201/eid2606.200516. [DOI] [PMC free article] [PubMed] [Google Scholar]
- 13.Rockx B., Corti D., Donaldson E., Sheahan T., Stadler K., Lanzavecchia A., Baric R. Structural basis for potent cross-neutralizing human monoclonal antibody protection against lethal human and zoonotic severe acute respiratory syndrome coronavirus challenge. J. Virol. 2008;82:3220–3235. doi: 10.1128/JVI.02377-07. [DOI] [PMC free article] [PubMed] [Google Scholar]
- 14.Lee Y.L., Liao C.H., Liu P.Y., Cheng C.Y., Chung M.Y., Liu C.E., Chang S.Y., Hsueh P.R. Dynamics of anti-SARS-Cov-2 IgM and IgG antibodies among COVID-19 patients. J. Infect. 2020 doi: 10.1016/j.jinf.2020.04.019. Published online April 23, 2020. [DOI] [PMC free article] [PubMed] [Google Scholar]
- 15.Okba N.M.A., Müller M.A., Li W., Wang C., GeurtsvanKessel C.H., Corman V.M., Lamers M.M., Sikkema R.S., de Bruin E., Chandler F.D. Severe Acute Respiratory Syndrome Coronavirus 2-Specific Antibody Responses in Coronavirus Disease 2019 Patients. Emerg. Infect. Dis. 2020;26:9. doi: 10.3201/eid2607.200841. [DOI] [PMC free article] [PubMed] [Google Scholar]
- 16.Bloch E.M., Shoham S., Casadevall A., Sachais B.S., Shaz B., Winters J.L., van Buskirk C., Grossman B.J., Joyner M., Henderson J.P. Deployment of convalescent plasma for the prevention and treatment of COVID-19. J. Clin. Invest. 2020;130:2757–2765. doi: 10.1172/JCI138745. [DOI] [PMC free article] [PubMed] [Google Scholar]
- 17.Shen C., Wang Z., Zhao F., Yang Y., Li J., Yuan J., Wang F., Li D., Yang M., Xing L. Treatment of 5 Critically Ill Patients with COVID-19 with Convalescent Plasma. JAMA. 2020;323:1582–1589. doi: 10.1001/jama.2020.4783. [DOI] [PMC free article] [PubMed] [Google Scholar]
- 18.Liu W., Fontanet A., Zhang P.H., Zhan L., Xin Z.T., Baril L., Tang F., Lv H., Cao W.C. Two-year prospective study of the humoral immune response of patients with severe acute respiratory syndrome. J. Infect. Dis. 2006;193:792–795. doi: 10.1086/500469. [DOI] [PMC free article] [PubMed] [Google Scholar]
- 19.Amanat F., Krammer F. SARS-CoV-2 Vaccines: Status Report. Immunity. 2020;52:583–589. doi: 10.1016/j.immuni.2020.03.007. [DOI] [PMC free article] [PubMed] [Google Scholar]
- 20.Smith K., Garman L., Wrammert J., Zheng N.Y., Capra J.D., Ahmed R., Wilson P.C. Rapid generation of fully human monoclonal antibodies specific to a vaccinating antigen. Nat. Protoc. 2009;4:372–384. doi: 10.1038/nprot.2009.3. [DOI] [PMC free article] [PubMed] [Google Scholar]
- 21.Wrapp D., Wang N., Corbett K.S., Goldsmith J.A., Hsieh C.L., Abiona O., Graham B.S., McLellan J.S. Cryo-EM structure of the 2019-nCoV spike in the prefusion conformation. Science. 2020;367:1260–1263. doi: 10.1126/science.abb2507. [DOI] [PMC free article] [PubMed] [Google Scholar]
Associated Data
This section collects any data citations, data availability statements, or supplementary materials included in this article.
Supplementary Materials
Data Availability Statement
The datasets supporting the current study are available from the corresponding author on request.