

Abstract
A key principle of oncolytic viral therapy is that many cancers develop defects in their antiviral responses, making them more susceptible to virus infection. However, some cancers display resistance to viral infection. Many of these resistant cancers constitutively express interferon-stimulated genes (ISGs). The goal of these experiments was to determine the role of two tumor suppressor genes, MAP3K7 and CHD1, in viral resistance and ISG expression in PC3 prostate cancer cells resistant to oncolytic vesicular stomatitis virus (VSV). MAP3K7 and CHD1 are often co-deleted in aggressive prostate cancers. Silencing expression of MAP3K7 and CHD1 in PC3 cells increased susceptibility to the matrix (M) gene mutant M51R-VSV, as shown by increased expression of viral genes, increased yield of progeny virus, and reduction of tumor growth in nude mice. Silencing MAP3K7 alone had a greater effect on virus susceptibility than did silencing CHD1. Silencing MAP3K7 and CHD1 decreased constitutive expression of ISG mRNAs and proteins, whereas silencing MAP3K7 alone decreased expression of ISG proteins, but actually increased expression of ISG mRNAs. These results suggest a role for the protein product of MAP3K7, transforming growth factor β-activated kinase 1 (TAK1), in regulating translation of ISG mRNAs and a role of CHD1 in maintaining the transcription of ISGs.
Keywords: Oncolytic Virus, Prostate cancer, MAP3K7, CHD1, vesicular stomatitis virus, interferon-stimulated genes
Graphical Abstract

Some cancers are resistant to oncolytic viruses because they constitutively express antiviral genes, raising the question of pathways leading to resistance. Lyles et al. describe the role of two tumor suppressor genes in resistance to oncolytic vesicular stomatitis virus in prostate cancer cells.
Introduction
Cancers commonly develop defects in antiviral signaling.1,2 Antiviral cytokines such as interferons (IFNs) typically inhibit proliferation, induce apoptosis, recruit the cellular immune system, and inhibit angiogenesis, none of which is favorable for the tumor microenvironment.3, 4, 5 Thus, many cancers suppress these signaling pathways through a variety of mechanisms. As a result, many viruses display tropism for cancer cells. This is the basis for development of oncolytic viral therapies of cancer.6 Oncolytic viruses typically initiate an infection at the site of the tumor, causing cell death and inflammation, and stimulate anti-tumor as well as antiviral immune responses. Oncolytic viruses are effective against a wide variety of malignancies in experimental models, and dozens of oncolytic viruses are in development.6,7 Thus far one oncolytic virus therapy has been approved for use in humans.8 However, a challenge to the application of oncolytic virus therapy is that some cancers display resistance to viral infection. Many of these resistant cancers express IFN-stimulated genes (ISGs) through aberrant signaling without suffering the anti-tumor effects of IFN.9, 10, 11 The goal of the experiments presented herein was to determine genetic mechanisms that affect ISG expression in prostate cancer cells resistant to oncolytic vesicular stomatitis virus (VSV).
Prostate cancer is the second-leading cause of cancer death in men.12 The majority of cases take an indolent course.13,14 However, some patients progress to metastatic disease, which is usually treated by hormone deprivation therapy, eventually leading to metastatic castration-resistant prostate cancer (mCRPC).15,16 Current treatment options have limited effects; measurements of median overall survival range from 9 to 39 months.15,17 Therefore, these patients could benefit from new treatment options such as oncolytic virus therapy. VSV is a candidate oncolytic virus that replicates rapidly in tumors and induces apoptosis and anti-tumor immune responses.18, 19, 20, 21 The selectivity of VSV for cancers with defective antiviral responses has been enhanced by developing viruses that express IFN,22,23 such as ones currently in clinical trials (e.g., ClinicalTrials.gov: NCT01628640, NCT02923466, NCT03017820, NCT03120624, NCT03647163, and NCT03865212). Similarly, viruses with mutations in the matrix (M) gene are selective for cancer because of their ability to induce IFN and other antiviral cytokines in normal cells while replicating in cancer cells with defective antiviral signaling,11,24,25 The M protein of VSV interacts with the host transcription and mRNA transport apparatus and inhibits host gene expression, including the production of IFN.26, 27, 28, 29, 30, 31 A single amino acid change (M51R) in the M protein renders VSV unable to inhibit host transcription, and it greatly increases the activation of IFN signaling and selectivity of VSV for cancer cells versus normal cells.11,24,25,31, 32, 33 Several cell lines derived from human and murine prostate cancers are susceptible to oncolysis by M51R-VSV.11,34,35 However, other prostate cancer cells, such as PC3 cells, are resistant to oncolysis by M51R-VSV, likely because they constitutively expresses ISGs.9,34
The experiments presented herein tested the role of two tumor suppressor genes, MAP3K7 and CHD1, in viral resistance and ISG expression in PC3 cells. MAP3K7 encodes transforming growth factor β (TGF-β)-activated kinase 1 (TAK1), and CHD1 encodes chromodomain helicase DNA binding protein 1 (CHD1). TAK1 plays a role in numerous signaling pathways and is activated downstream of Toll-like receptors (TLRs) as well as receptors for interleukin (IL)-1, TGF-β, tumor necrosis factor α (TNF-α), and Wnt1, leading to activation of transcription factors such as nuclear factor κB (NF-κB) and Jun family members.36 CHD1 is a chromatin-remodeling enzyme that acts at nucleosomes with trimethylation of histone H3 at lysine 4 (H3K4me3). CHD1 promotes transcription at H3K4me3 sites by maintaining open chromatin.37 Approximately 30%–40% of primary prostate tumors have either homozygous or heterozygous deletion of MAP3K7, which is significantly correlated with high Gleason grade tumors.38,39 About half of these also have deletions of CHD1.40 MAP3K7 and CHD1 are more likely to be co-deleted in metastatic tumors than they are to be deleted alone.40 This frequent co-deletion suggests that MAP3K7 and CHD1 may be mechanistically linked in prostate cancer. A recent chromatin immunoprecipitation sequencing (ChIP-seq) study identified more than 8,000 binding sites of CHD1 in the genome of PC3 cells. These sites were enriched in TNF-α and NF-κB signaling genes, which could link CHD1 to the function of TAK1 and to viral resistance.41
We found that silencing MAP3K7 and/or CHD1 expression significantly increased the susceptibility of PC3 cells to M51R-VSV, and also decreased the expression of ISG proteins. Silencing both MAP3K7 and CHD1 had the most profound effects on ISG expression. Silencing MAP3K7 alone had the predominant effect on the response to viral infection compared to silencing CHD1 alone. Silencing MAP3K7 alone decreased the expression of ISGs at the protein level, but had the unexpected effect of increasing the expression of ISG mRNAs, suggesting that TAK1 plays a role in enhancing translation of ISG mRNAs. The proposed model integrates these results with the known functions of TAK1 and CHD1 as described in the Discussion. These results indicate that MAP3K7 and CHD1 regulate antiviral signaling in prostate cancer, and they suggest that cancers in which these genes have been deleted may be good targets for oncolytic virus therapy.
Results
Viral Resistance Is Decreased in MAP3K7 and/or CHD1 Silenced Cells
PC3 prostate cancer cells are highly resistant to VSV infection.9,11 To determine the effect of MAP3K7 and CHD1 on viral resistance, cell lines were established by stably transducing PC3 cells with lentiviral vectors expressing short hairpin RNA (shRNA) against MAP3K7, CHD1, or both (shMAP3K7, shCHD1, shMAP3K7/CHD1). The singly transduced shMAP3K7 and shCHD1 cell lines were also stably transduced with a control vector expressing a nontargeting RNA sequence, and a control cell line was stably transduced with the two nontargeting vectors (shControl). The expression of TAK1 and CHD1 was analyzed in clonal cell lines by immunoblots, and cells with the greatest extent of silencing were chosen for further analysis. Figure S1 shows levels of TAK1 and CHD1 determined from immunoblots and levels of MAP3K7 and CHD1 mRNAs from RNA sequencing (RNA-seq) data. MAP3K7 mRNA and its protein product TAK1 were reduced by approximately 50% in shMAP3K7 cells, and they were more substantially reduced in shMAP3K7/CHD1 cells (Figures S1A, S1B, and S1D). CHD1 protein was almost undetectable in shCHD1 and shMAP3K7/CHD1 cells, and CHD1 mRNA was reduced to approximately a third of the level in shControl cells (Figures S1C and S1E). Attempts to achieve more substantial reduction in TAK1 levels using CRISPR-Cas9 approaches were unsuccessful (unpublished data). Despite the inability to reduce TAK1 levels by more than about 50% in the singly silenced shMAP3K7 cells, RNA-seq data provided evidence of reduced signaling through the TGF-β pathway in these cells (unpublished data).
In order to determine the role of MAP3K7 and CHD1 in resistance to VSV in PC3 cells, shControl, shMAP3K7, shCHD1, and shMAP3K7/CHD1 cells were infected with M51R-VSV that expresses green fluorescent protein (M51R-VSV-GFP) at varying multiplicities of infection (MOIs) for 5 h, and GFP expression was analyzed by flow cytometry. Negative controls were mock-infected PC3 cells or cells infected with M51R-VSV that does not express GFP. Positive controls were M51R-VSV-GFP-infected EL4 cells, which are highly permissive for VSV. Representative histograms of cells infected at an MOI of 5 are shown in Figures 1A–1F, and data from multiple experiments at different multiplicities are shown in Figures 1G–1J. At an MOI of 5, the percent of GFP-positive cells in shControl cells was around 15%, around 50% in shMAP3K7 and shMAP3K7/CHD1 cells, and around 30% in shCHD1 cells (Figures 1B–1E). The relative order shMAP3K7/CHD1 ≅ shMAP3K7 > shCHD1 > shControl was observed at each multiplicity tested (Figures 1G–1J). Despite the increased percentage of infection in shMAP3K7, shCHD1, and shMAP3K7/CHD1 cells, these cell lines were still more resistant than EL4 cells (Figure 1F).
Figure 1.

Silencing Expression of MAP3K7 and/or CHD1 Enhances Susceptibility of PC3 Cells to Infection with Oncolytic VSV
(A–E) shControl, shMAP3K7, shCHD1, and shMAP3K7/CHD1 PC3 cells were mock-infected or infected with M51R-VSV-GFP at a multiplicity of infection (MOI) of 5 PFU/cell for 5 h, and GFP expression was analyzed by flow cytometry. (A–E) shControl PC3 mock (A), shControl PC3 + M51R-VSV-GFP (B), shMAP3K7 PC3 + M51R-VSV-GFP (C), shCHD1 PC3 + M51R-VSV-GFP (D), and shMAP3K7/CHD1 PC3 + M51R-VSV-GFP (E). (F) EL4 cells were infected with M51R-VSV-GFP at an MOI of 5 as a positive control. (G–J) Cells were infected with M51R-VSV-GFP at the indicated MOIs (G, 5; H, 10; I, 25; J, 50) and analyzed by flow cytometry as in (A)–(F). Data are represented as mean ± SEM for five independent experiments analyzed by one-way ANOVA with Tukey’s correction for multiple comparisons. ∗p < 0.05, for differences between cell types.
The effect of silencing MAP3K7 and/or CHD1 on resistance to VSV in PC3 cells was further tested by immunoblot analysis of the viral M protein expression, RNA-seq analysis of viral RNA, and plaque assay of infectious progeny virus (Figure 2). shControl, shMAP3K7, shCHD1, and shMAP3K7/CHD1 PC3 cells were infected with M51R-VSV at an MOI of 10, and the expression of VSV M protein was analyzed by immunoblots (Figures 2A and 2B). The expression of M protein was increased in shMAP3K7, shCHD1, and shMAP3K7/CHD1 cells over that in shControl cells. The greatest change in M protein expression was in shMAP3K7/CHD1 cells, which was significantly higher than that in all three of the other cell lines. This result differs from the analysis of GFP expression, in which the singly silenced shMAP3K7 and doubly silenced shMAP3K7/CHD1 cells expressed similar levels of GFP fluorescence. This could reflect differences between these two cell lines in the synthesis or turnover of M protein versus GFP mRNA or protein or rates of inactivation of GFP fluorescence.
Figure 2.

Production of VSV M Protein, VSV RNA, and Infectious Virus by PC3 Cells Silenced for MAP3K7 and/or CHD1
(A) shControl, shMAP3K7, shCHD1, and shMAP3K7/CHD1 PC3 cells were mock-infected or infected with M51R-VSV at an MOI of 10 PFU/cell. Cell lysates were prepared 5 h post-infection. Representative immunoblots of VSV M protein and cellular actin as loading control are shown. Full-length M protein and the M2 product of alternative translation initiation73 are indicated. (B) M protein levels were quantified using ImageJ gel analysis software in six independent immunoblot experiments. Intensities were normalized to actin and then normalized to the M protein/actin ratio in shMAP3K7/shCHD1 cells. (C) RNA-seq data from three independent experiments are shown as reads mapped to the VSV genome expressed as percentage of total uniquely mapped reads. Data in (B) and (C) are mean ± SEM analyzed by one-way ANOVA with Tukey’s correction for multiple comparisons. ∗p < 0.05, for differences between cell types. (D) Cells were infected with M51R-VSV at an MOI of 50 PFU/cell for 1 h. Cells were washed and refed with new media. Supernatants were collected at the indicated times post-infection, and virus titers were determined by a plaque assay. Averages of two independent experiments are shown.
Levels of VSV RNA were determined from RNA-seq data and are shown in Figure 2C as the percent of total mapped reads. The expression of viral RNA was increased in shMAP3K7, shCHD1, and shMAP3K7/CHD1 cells over that in shControl cells. As in the case of M protein expression, the greatest change compared to shControl cells was in shMAP3K7/CHD1 cells, which was significantly higher than that in all three of the other cell lines.
Supernatant fluids from PC3 cells infected with M51R-VSV at an MOI of 50 were analyzed over a 24-h period by plaque assays to determine the titer of infectious VSV particles (Figure 2D). The time course of production of infectious viral particles varied among the three silenced cell lines but was increased in shMAP3K7, shCHD1, and shMAP3K7/CHD1 cells relative to shControl cells by approximately a log. Although the virus yield in these experiments was increased, this still represents a modest yield compared to cell lines that are fully susceptible to VSV, consistent with the residual level of resistance observed in the flow cytometry experiments (Figures 2A and 2B).
In Vivo Sensitivity of MAP3K7 and CHD1 Silenced PC3 Tumors to M51R-VSV
To determine whether MAP3K7 and CHD1 affect PC3 tumor sensitivity to oncolytic viral therapy in vivo, shControl and shMAP3K7/CHD1 xenografts were established in the flanks of BALB/c nude mice and injected intratumorally with a single dose of M51R-VSV. Figure 3 shows the time course of tumor development following treatment. The growth rate of mock-treated shMAP3K7/CHD1 PC3 tumors was generally greater than the growth rate of mock-treated shControl tumors, as described previously for LNCaP prostate cancer cells silenced for MAP3K7 and CHD1,40 although the difference was not statistically significant at day 15 post-treatment. Treatment with M51R-VSV decreased the growth of shMAP3K7/CHD1 tumors relative to their mock-treated controls, whereas virus-treated shControl tumors were not significantly different from their mock-treated controls. Overall, the data in Figures 1, 2, and 3 indicate that silencing MAP3K7 and/or CHD1 decreased the resistance of PC3 cells to M51R-VSV.
Figure 3.

Response of shControl and shMAP3K7/CHD1 Tumors to Treatment with M51R-VSV
shControl and shMAP3K7/CHD1 xenografts were established in the flanks of BALB/c nude mice and injected intratumorally with 50 μL of media (mock) or media with 108 PFU of M51R-VSV. Tumor length and width were measured daily by calipers, and tumor volume (V) was determined using the formula V = length × width2. Tumor volumes were normalized to tumor volumes on days 1 and 2. Sample sizes were as follows: shControl-mock, n = 11; shControl-virus, n = 12; shMAP3K7/CHD1-mock, n = 10; shMAP3K7/CHD1-virus, n = 9. Data are represented as mean ± SEM analyzed by one-way ANOVA with Tukey’s correction for multiple comparisons on day 15. ∗p < 0.05, for differences between cell types.
ISG Protein Levels Are Decreased in MAP3K7 and/or CHD1 Silenced Cells
Previous results have indicated that resistance of PC3 cells to oncolytic VSV is due to high levels of constitutive expression of ISGs relative to prostate cancer cells that are sensitive to VSV.9 To determine whether MAP3K7 and CHD1 regulate ISG expression in PC3 cells, the expression of ISG proteins in PC3 cell lysates was analyzed by mass spectrometry and by immunoblots. Broad proteomic analysis identified 13 ISG proteins with sufficient abundance for targeted analysis by liquid chromatography-mass spectrometry. Targeted proteomics analysis indicated that levels of proteins encoded by MX1, OAS3, EIF2AK2, IFIT1, IFIT5, IFITM3, IRF3, ISG15, and STAT1 genes were significantly decreased in shMAP3K7, shCHD1, and/or shMAP3K7/CHD1 cells relative to shControl cells (Figures 4A–4I). Four of the 13 ISG proteins, encoded by IFIT2, IFIT3, OAS2, and PRKRA, were not significantly affected by MAP3K7 and/or CHD1 silencing (Figures 4J–4M).
Figure 4.

Targeted Proteomics Analysis of ISG Protein Levels in PC3 Cells Silenced for MAP3K7 and/or CHD1.
(A–M) Cell lysates were prepared from shControl, shMAP3K7, shCHD1, and shMAP3K7/CHD1 cells: (A) MX1, (B) OAS3, (C) IFIT1, (D) IFIT5, (E) IFITM3, (F) IRF3, (G) ISG15, (H) EIF2AK2, (I) STAT1, (J) OAS2, (K) IFIT2, (L) IFIT3, and (M) PRKRA. Broad proteomics analysis was used to identify the most abundant ISGs in shControl cells, and the 13 most abundant ISGs were analyzed by targeted proteomic analysis. Skyline software was used to calculate the normalized peak area of peptides specific to each ISG. Data are represented as mean ± SD on a log scale. Statistical significance was determined for each ISG protein from log-transformed data using one-way ANOVA with Holm’s correction for multiple comparisons. ∗p < 0.05, for differences between cells.
MxA, the protein product of the MX1 gene, is a potent inhibitor of VSV replication.42,43 MxA was decreased by 85%–90% in shMAP3K7, shCHD1, and shMAP3K7/CHD1 cells relative to shControl cells as determined by immunoblots (Figures 5A and 5C). Immunoblots of OAS3 showed that OAS3 was also decreased in shMAP3K7, shCHD1, and shMAP3K7/CHD1 cells relative to shControl cells (Figures 5B and 5D). Collectively, the data in Figures 4 and 5 indicate that MAP3K7 and CHD1 likely affect the viral susceptibility of PC3 cells through regulation of ISG expression.
Figure 5.
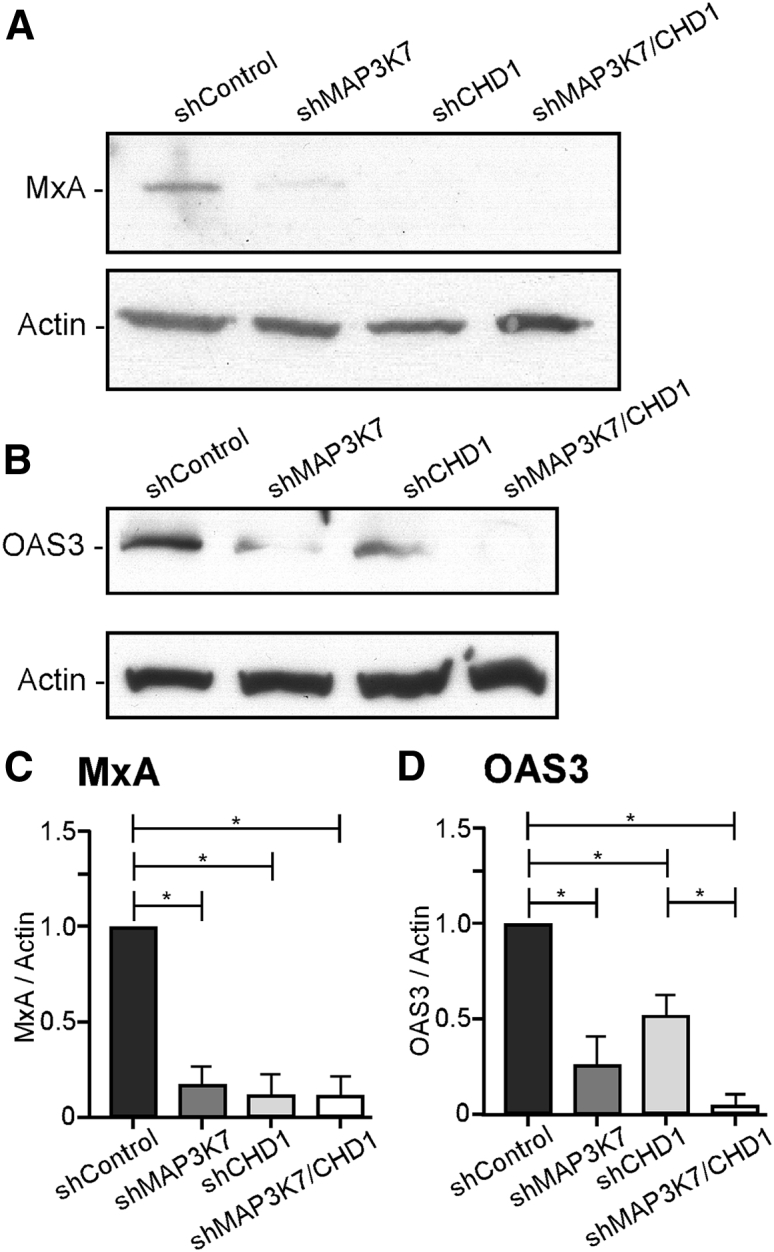
Immunoblot Analysis of MxA and OAS3 in PC3 Cells Silenced for MAP3K7 and/or CHD1
Cell lysates were prepared from shControl, shMAP3K7, shCHD1, and shMAP3K7/CHD1 cells and analyzed for expression of MxA or OAS3 by immunoblots. (A and B) Representative immunoblots of MxA (A), OAS3 (B), and cellular actin as loading control are shown. (C and D) MxA (C) and OAS3 (D) levels were quantified using ImageJ gel analysis software in three independent experiments. Intensities were normalized to actin and then normalized to the ratios in shControl cells. Data are represented as mean ± SEM analyzed by one-way ANOVA with Tukey’s correction for multiple comparisons. ∗p < 0.05, for differences between cell types.
ISG mRNA Expression Is Differentially Modulated in MAP3K7 and/or CHD1 Silenced Cells
To determine whether MAP3K7 and CHD1 affect expression of ISG mRNAs, RNA-seq analysis was performed on uninfected or M51R-VSV-infected shControl, shMAP3K7, shCHD1, and shMAP3K7/CHD1 cells at 6 h post-infection. Figure 6 shows the mRNA levels in uninfected cells for the 13 ISGs whose proteins were analyzed in Figure 4. In doubly silenced shMAP3K7/CHD1 cells, changes in ISG mRNAs were generally consistent with changes in ISG protein levels with significant decreases in mRNAs for MX1, OAS3, IFIT1, IFIT5, IFITM3, and ISG15 relative to shControl cells. Surprisingly, in singly silenced shMAP3K7 cells, there was a significant increase in ISG mRNA expression relative to shControl cells for MX1, OAS3, IFIT1, IFITM3, IRF3, ISG15, and STAT1, whose protein levels were decreased, as well as OAS2 and PRKRA, whose protein levels were not significantly changed. In shCHD1 cells, results were intermediate with reduction in mRNAs for MX1, OAS3, IFIT1, and IRF3, as well as IFIT2 and IFIT3.
Figure 6.

RNA-Seq Analysis of ISG mRNA Levels in PC3 Cells Silenced for MAP3K7 and/or CHD1
Total-cell RNA extracts were prepared from mock-infected shControl, shMAP3K7, shCHD1, and shMAP3K7/CHD1 cells. Samples were depleted of rRNA, reverse transcribed, sequenced, and aligned to the human genome. Gene counts were log2 transformed and centered about their means for each sample. (A–M) Data shown are mRNAs encoded by the same ISGs as in Figure 4: (A) MX1, (B) OAS3, (C) IFIT1, (D) IFIT5, (E) IFITM3, (F) IRF3, (G) ISG15, (H) EIF2AK2, (I) STAT1, (J) OAS2, (K) IFIT2, (L) IFIT3, and (M) PRKRA. Data are represented as mean ± SD on a log2 scale from three independent experiments. Statistical significance was determined for each ISG protein from log-transformed data using one-way ANOVA with Holm’s correction for multiple comparisons. ∗p < 0.05, for differences between cells.
The discrepancies between the effects on ISG proteins versus mRNAs of silencing MAP3K7 and/or CHD1 were quantified by determining the protein/RNA ratios from the data in Figures 4 and 6 and normalizing them relative to shControl cells (Figure S2). The ISGs were ordered according to their ratios in shMAP3K7 cells, where the discrepancies were greatest. With the exception of MX1, which was dramatically altered in all three silenced cells, most of the ISG ratios in shCHD1 and shMAP3K7/CHD1 were reduced by factors of approximately 2 (log2 [protein/RNA] = −1) or less, whereas in shMAP3K7 cells, ratios for six of the ISGs were reduced by factors of approximately 4 (log2 [protein/RNA] = −2) or greater.
In principle, the reduced protein/RNA ratios could be due either to inefficient translation of ISG mRNAs or enhanced turnover of ISG proteins. The turnover of OAS3 was determined in a “cycloheximide chase” experiment. shControl, shMAP3K7, shCHD1, and shMAP3K7/CHD1 cells were treated with cycloheximide for 0 or 6 h, and levels of OAS3 in cell lysates were determined by immunoblots. Cycloheximide inhibits translation, so that reduction in levels of OAS3 between cells treated for 0 versus 6 h reflects the rate of turnover. The level of OAS3 in the shMAP3K7/CHD1 cells was too low to quantify accurately, but in shMAP3K7 and shCHD1 cells, the rate of OAS3 turnover was equal to or less than the rate of OAS3 turnover in shControl cells (Figure 7). Therefore, differences in OAS3 turnover are likely not responsible for the different levels of OAS3 in shMAP3K7 and shCHD1 cells versus shControl cells. These results suggest that MAP3K7 and CHD1 affect ISG expression levels through regulation of translation of ISG mRNAs.
Figure 7.

Turnover of OAS3 in PC3 Cells Silenced for MAP3K7 and/or CHD1
shControl, shMAP3K7, shCHD1, and shMAP3K7/CHD1 cells were treated with cycloheximide. Cell lysates were prepared at 0 or 6 h after cycloheximide treatment and analyzed by immunoblots for OAS3. OAS3 levels were quantified using ImageJ gel analysis software in two independent experiments. Individual data points and their means are shown for ratios of OAS3 post-treatment/OAS3 pre-treatment. Levels of OAS3 in shMAP3K7/CHD1 cells were too low to quantify accurately and are not shown.
The patterns of mRNA expression observed in uninfected cells with the limited set of ISGs in Figure 6 were typical of a larger set of genes related to IFN pathways as shown by gene set enrichment analysis (GSEA). Pairwise comparison of mRNA levels in shControl cells with shMAP3K7, shCHD1, and shMAP3K7/CHD1 cells was used to generate an ordered dataset of genes for each pair based on signal-to-noise ratio of their differential expression. The results were analyzed for differential expression of curated gene sets from the Molecular Signatures Database v6.2 (Broad Institute). Figure 8 shows results for the Reactome_Interferon_Signaling gene set, which comprises 159 genes related to IFN signaling. The graphs are plots of running enrichment scores versus rank in the dataset, in which the running enrichment score increases for genes in the gene set and decreases for those that are not. The position of each gene in the gene set is marked by a black line on the x axis. The genes are ordered such that the genes enriched in shMAP3K7 (A), shCHD1 (B), or shMAP3K7/CHD1 (C) cells are farthest to the left, and those enriched in shControl cells are farthest to the right. Enrichment scores in shMAP3K7, shCHD1, or shMAP3K7/CHD1 cells have a positive value, and enrichment scores in shControl cells have a negative value. As in the case of the majority of ISGs in Figure 6, mRNAs in the gene set were significantly enriched in shMAP3K7 cells relative to shControl cells (Figure 8A), indicated by the positive normalized enrichment score (NES) of 1.35. In contrast, mRNAs in the gene set were significantly enriched in shControl cells relative to shMAP3K7/CHD1 cells (Figure 8C), indicated by the negative NES (NES = −1.41). There was a slight enrichment of mRNAs in the gene set in shControl versus shCHD1 cells (Figure 8B, NES = −0.87), but this did not reach the criteria for statistical significance.
Figure 8.

Gene Set Enrichment Analysis of mRNAs from Genes Involved in IFN signaling in PC3 Cells Silenced for MAP3K7 and/or CHD1
Total-cell RNA extracts were prepared from shControl (A–F), shMAP3K7 (A and D), shCHD1 (B and E), and shMAP3K7/CHD1 (C and F) cells either mock-infected (A–C) or infected with M51R-VSV at an MOI of 10 PFU/cell (D–F). Samples were depleted of rRNA, reverse transcribed, sequenced, and aligned to the human genome. Gene counts were log2 transformed and centered about their means for each sample from three independent experiments. Differential expression between the sets of samples from the indicated cells was analyzed by GSEA software using the canonical pathway: reactome collection of gene sets in the MSigDB (Molecular Signatures Database). Results for the Reactome_Interferon_Signaling gene set are shown.
In contrast to the results with uninfected cells, analysis of infected cells demonstrated a consistent enrichment of mRNAs of the Reactome_Interferon_Signaling gene set in shMAP3K7, shCHD1, and shMAP3K7/CHD1 cells compared to shControl cells (Figures 8D–8F), although only the comparison with shMAP3K7/CHD1 cells reached the criteria for statistical significance. The higher levels of expression of genes in this pathway in MAP3K7 and/or CHD1 silenced cells compared to shControl cells was likely due to the higher levels of viral gene expression (Figures 1 and 2), leading to greater activation of this pathway. Furthermore, these data demonstrated that silencing MAP3K7 and/or CHD1 did not interfere with the ability of PC3 cells to activate this pathway in response to virus infection. Comparison of mRNAs in virus-infected versus uninfected cells demonstrated that this pathway was activated by virus infection similarly in all four cell lines (Figure S3). This result is consistent with earlier data indicating that the resistance of PC3 cells affects early stages in virus infection and is primarily due to constitutive expression of antiviral genes.9
Discussion
An important principle in the field of oncolytic viruses is that cancers commonly develop defects in antiviral signaling. However, in cancers derived from most tissue types, there are examples of cancers that are resistant to oncolytic viruses, often due to their ability to mount antiviral responses or due to the constitutive expression of antiviral genes.6 This raises the question of the mechanisms that contribute to resistance. The data presented herein show that two tumor suppressor genes, MAP3K7 and CHD1, contribute to resistance of PC3 prostate cancer cells, so that inhibition of their expression enhances susceptibility to oncolytic VSV (Figures 1, 2, and 3). Suppressing expression of MAP3K7 and/or CHD1 inhibits the constitutive expression of antiviral genes (Figures 4, 5, 6, and 7), which appears to be responsible for the enhanced susceptibility to virus infection.
Singly silenced shMAP3K7 and doubly silenced shMAP3K7/CHD1 cells were similarly susceptible to virus infection (Figures 1 and 2), indicating that loss of MAP3K7 expression is the major driver of susceptibility in both the presence and absence of CHD1 expression. Similarly, loss of MAP3K7 is a major driver sensitizing prostate cancer cells to CDK1/2 inhibitors regardless of the status of CHD1.44 The major impact of these results is the potential to develop targeted therapies for these particularly aggressive prostate cancers that have deletions in MAP3K7. As in the case of CDK inhibitors, the status of MAP3K7 and CHD1 genes in cancers of mCRPC patients could be a consideration in the decision to treat with oncolytic VSV or other oncolytic viruses. The likelihood of their cancers being resistant would be reduced as a result of alterations in these genes.
The proposed model shows how the constitutive expression of ISGs in PC3 cells is affected by MAP3K7 and CHD1, based on the data presented in the present study and what is known about the activities of their respective protein products TAK1 and CHD1. Similar to many cancers, PC3 cells constitutively express cytokines such as TGF-β and IL-1β as autocrine factors important for proliferation and survival.45, 46, 47, 48, 49 Binding of these cytokines to their receptors activates TAK1, which in turn activates downstream kinases including ΙκΒ kinases (IKKs), c-Jun N-terminal kinases (JNKs), and p38 mitogen-activated protein kinase (p38 MAPKs).36 Constitutive activation of IKK in particular is important for survival, as shown by induction of apoptosis in PC3 cells expressing dominant-negative ΙκΒα.50 The dependence on signaling through IKKs might explain the inability to reduce TAK1 levels by more than about 50% in the singly silenced shMAP3K7 cells.
Transcription factors such as NF-κB and activator protein 1 (AP-1) activated by kinases downstream of TAK1 do not directly activate ISG expression in most cell types, but they are important for amplifying ISG expression in response to other signals, such as IFNs themselves.51 For this reason, the model includes a primary antiviral signal as well. This signal could come from low levels of constitutive IFN production, constitutive activation of transcription factors such as signal transducer and activator of transcription 1 (STAT1) and STAT2 that are normally activated by IFN, or constitutive activation of transcription factors such as IFN regulatory factor 3 (IRF3) or IRF7, which can induce ISG expression in the absence of IFNs.52
It is an open question whether there is an additional primary signal, such as IFN, for constitutive ISG expression in PC3 cells besides the cytokines that activate TAK1. Constitutive expression of IFN in the absence of virus infection was not detected by bioassay,11 and IFN mRNAs have not been detected in microarray9 or RNA-seq experiments (data from the experiments presented herein), with the exception of low levels of IFN-ε mRNA (<40 counts). Nonetheless, most type I IFNs are exceptionally potent cytokines, so that low levels of constitutive expression below the limits of detection by these approaches cannot be ruled out. Of course, the question of whether there is low-level constitutive expression of IFNs in PC3 cells also raises the question of potential upstream signals, such as alterations in DNA or RNA metabolism that activate IFN production. An alternative model is that the cytokines that have been shown to be constitutively produced by PC3 cells, such as IL-1, activate ISG expression through crosstalk with pathways involved in IFN responses without an additional primary signal. In support of this model, IL-1 treatment of LNCaP prostate cancer cells, which normally express very low levels of ISG mRNAs, results in increased expression of the ISG mRNAs that are expressed in PC3 cells.48
The role for CHD1 proposed in the model is to maintain the transcriptional consistency of ISG expression epigenetically. CHD1 promotes gene expression by maintaining an open chromatin structure at sites of H3K4me3 modification.37,53 This epigenetic modification is associated with enhanced transcriptional consistency among many genes in several cell types.54 In most of the data presented herein, silencing CHD1 expression alone had relatively modest effects on susceptibility to virus or ISG expression compared to silencing MAP3K7 expression, indicating that TAK1 was primarily responsible for promoting the antiviral signal. Thus, in the singly silenced shCHD1 cells, the antiviral signal was still present, and there was only a modest change in ISG expression. Strikingly, in the singly silenced shMAP3K7 cells, despite the reduced signaling through TAK1, the expression of ISG mRNAs was not only stably maintained, but actually increased. The expression of ISG mRNAs was maintained in shMAP3K7 cells by CHD1, as indicated by results in the doubly silenced shMAP3K7/CHD1 cells, in which the levels of ISG mRNAs were dramatically reduced. H3K4me3 and CHD1 are directly bound to the promoter regions of some ISGs in PC3 cells (e.g., IFIT5, IRF3, OAS2, OAS3) as indicated by ChIP-seq data,41 and stable expression of others may be maintained by CHD1 indirectly through other factors that promote their expression. H3K4me3 and CHD1 are not the only epigenetic factors maintaining the resistance of PC3 cells to oncolytic VSV. Treatment of PC3 cells with histone deacetylase inhibitors (HDIs) enhances their susceptibility to VSV by inhibiting their IFN responses.55,56 This appears to be due to increased expression of the microRNA miR34a and consequent decreased expression of the sirtuin SIRT1, a protein deacetylase that has antiviral activity against a number of viruses, including VSV.57
A growing body of literature has established that part of the antiviral response is regulation of translation of ISG proteins, although the mechanisms involved have been the subject of some debate.58, 59, 60 The data presented herein indicate that inhibition of MAP3K7 alone primarily reduces ISG expression at the protein level, not at the mRNA level, since the singly silenced shMAP3K7 cells have generally high levels of ISG mRNAs but generally low levels of ISG proteins compared to shControl cells. This could be due to differences in the rates of protein synthesis or rates of protein turnover. There may be examples of enhanced turnover among the multiple ISG proteins that were affected by silencing TAK1 expression. However, in the case of OAS3, there was no obvious difference in protein turnover between shMAP3K7 and shControl cells, suggesting that control is at the translational level. Several of the pathways downstream of TAK1 affect protein synthesis. For example, activation of p38 MAPKs by TAK1 would be expected to activate kinases involved in translational control, such as MNK1.61 Another potential mechanism of translational control could be differential expression of microRNAs that affect translation of ISG mRNAs. In this scenario, silencing expression of TAK1 would induce expression of microRNAs that inhibit translation of ISG mRNAs.62
A related question raised by results in the singly silenced shMAP3K7 cells is why the levels of ISG mRNAs are increased. One possibility, shown in the proposed model, is that this increase is due to lower levels of ISG proteins or microRNAs that are negative feedback regulators of ISG expression.63 Another possibility is that silencing TAK1 expression results in activation of alternative compensatory pathways that also enhance ISG mRNA expression. In either case, silencing CHD1 expression in the doubly silenced shMAP3K7/CHD1 cells eliminated this activity, resulting in low levels of ISG mRNAs.
Importantly, note that cancers with unaltered MAP3K7 and CHD1 genes are not necessarily resistant to viral oncolysis. For example, LNCaP9,11 and 22RV1 (unpublished data) prostate cancer cells, which have normal MAP3K7 and CHD1 genes, are both highly susceptible to oncolytic VSV. This brings us back to the question of why some prostate cancers are sensitive to oncolytic virus and others are resistant, even though the cancers are derived from the same tissue. A likely explanation is that resistance of cancers to oncolytic viruses develops through interactions with the tumor microenvironment that can differ among cancers.34 The data presented herein suggest that the antiviral signaling in PC3 cells is dependent on cytokine signaling through TAK1, which in this case is autocrine in nature. However, once the pattern of antiviral gene expression is established, it is maintained by epigenetic mechanisms, such as regulation by CHD1.
Materials and Methods
Cells and Viruses
PC3 cells were acquired from the American Type Culture Collection (ATCC) and cultured in RPMI 1640 medium with 10% fetal calf serum (FCS). EL4 cells were acquired from the ATCC and cultured in suspension flasks in DMEM medium with 7% FCS. M51R-VSV and M51R-VSV-GFP stocks were grown in BHK cells at 37°C in DMEM with 2% FCS. The M51R-VSV and M51R-VSV-GFP stocks were originally isolated from cDNA clones as previously described.64,65
shControl, shMAP3K7, shCHD1, and shMAP3K7/CHD1 cell lines were generated via transduction of PC3 cells with lentiviral vectors as previously described.40 The lentiviral plasmids used were pLKO.1- puro-shMAP3K7 (Sigma) and pLKO.1-neo-shCHD1 (Sigma). Plasmids with the targeting sequence replaced by a randomized sequence were used as controls. Cell lines were validated as being of PC3 origin by short tandem repeat profiling (ATCC).
Viral Susceptibility Assays
PC3 cells were infected at 60%–80% confluence. EL4 cells in suspension were used as a positive control. For infections of 6 h or less, M51R-VSV or M51R-VSV-GFP at the indicated MOI in the minimum volume required to cover the surface of the well were incubated for 1 h. After 1 h, RPMI 1640 medium with 10% FCS was added to the well. For overnight infections, the viral stock solution was added directly to the media in the wells. At the indicated times, cells were harvested and analyzed by flow cytometry, immunoblot, or viral plaque assay. Immunoblot and viral plaque assays were performed as previously described.11,66
Primary Antibodies for Immunoblots
Primary antibodies used were rabbit anti-OAS3 (ab154270, Abcam), rabbit monoclonal anti-Mx1 ab207414 (Abcam), rabbit monoclonal anti-TAK1 D94D7 (#5206, Cell Signaling Technology), rabbit monoclonal anti-CHD1 D8C2 (#4351, Cell Signaling Technology), and mouse monoclonal anti-VSV M protein 23H12.67
Flow Cytometry
PC3 cells were suspended in phosphate-buffered saline with 2% paraformaldehyde. GFP fluorescence was analyzed with a BD FACSCalibur flow cytometer (BD Biosciences). Forward scatter, side scatter, and GFP photomultiplier tube voltages were determined using the negative controls. Data were analyzed using FlowJo software.
Mass Spectrometric Analysis of ISG Protein Levels
PC3 cells were harvested and broad proteomic analysis was performed as previously described.68 For targeted protein analysis, parallel-reaction monitoring (PRM) was used for data acquisition by monitoring precursor ions of signature peptides. MS2 spectra were acquired from the following target ions: (1) 589.3235 m/z for ISG15, (2) 587.8144 m/z for STAT1, (3) 870.4468 m/z for OAS3, (4) 448.7454 m/z for OAS2, (5) 699.9012 m/z for MX1, (6) 790.9196 m/z for E2AK2, (7) 321.7311 m/z for IFIT3, (8) 441.7376 m/z for PRKRA, (9) 590.8379 m/z for I2BPL, (10) 1,027.0248 m/z for IRF3, (11) 891.1365 m/z for IFM3, (12) 379.2264 m/z for IFIT2, (13) 676.3010 m/z for IFIT1, (14) 551.2681 m/z for IF16, (15) 438.7505 m/z for IFIT5, (16) 619.2682 m/z for I27L2, (17) 579.8037 m/z for M3K7, (18) 1,061.9653 m/z for CHD1, and (19) 802.4021 m/z for I2BP2. Skyline software (MacCoss Lab Software, University of Washington, Seattle, WA, USA) was used for peak detection, extraction, and area calculation to obtain comparative and quantitative data. NIST mass spectral library (https://chemdata.nist.gov/) was utilized to confirm peak selection for the analysis.
Whole-Transcriptome Shotgun Sequencing (RNA-Seq)
shControl, shMAP3K7, shCHD1, and shMAP3K7/CHD1 cells were mock-infected or infected with M51R-VSV at an MOI of 10 for 6 h. Mock-infected and virus-infected cells were analyzed in separate experiments. RNA was extracted using the RNeasy kit (QIAGEN) from three independent samples of each cell line. Total RNA was used to prepare cDNA libraries using the Illumina TruSeq stranded total RNA with a Ribo-Zero Gold Preparation kit (Illumina). The libraries for each sample were pooled and sequenced to a target read depth of 30 million reads per library using single-end 76-cycle sequencing with the High Output 75-cycle kit (Illumina) on the Illumina NextSeq 500. Genome alignment was performed using in house R scripts and the STAR sequence aligner, and gene counts for mapped reads were extracted using FeatureCounts v1.6.1. RNA-seq data were deposited in the Gene Expression Omnibus database (GEO: GSE145937).
Gene counts in which at least one sample had >50 counts were log2 transformed and normalized by centering about their means for each sample. Data for individual ISGs in Figure 6 were analyzed by one-way ANOVA with Holm’s correction for multiple comparisons using R software69 or the limma R/Bioconductor software package70 with similar results. GSEA was performed using the javaGSEA desktop application (https://www.gsea-msigdb.org/gsea/index.jsp) according to Subramanian et al.71 and Mootha et al.72 using gene counts normalized by the total mapped reads in each sample. The criteria for statistical significance were normalized enrichment scores with nominal p values <0.05 and false discovery rate q values <0.25.
In Vivo Analysis of PC3 Tumor Response to M51R-VSV
Experiments with mice were approved by the Institutional Animal Care and Use Committee (IACUC) of Wake Forest School of Medicine. All experiments conformed to all relevant regulatory standards. shControl and shMAP3K7/CHD1 cells were harvested at 60%–80% confluency. Cells were suspended at 1 × 10⁷ cells/mL in ice-cold Matrigel (Fisher Scientific), and 0.2 mL of suspension was injected subcutaneously in the flanks of BALB/c nude mice. Tumors were assessed visually and by palpation for 3-4 weeks prior to treatment. Mice were randomly selected to receive either 50 μL of RPMI 1640 media without FCS or 1 × 10⁸ plaque forming units (PFU) of M51R-VSV in 50 μL of RPMI 1640 media without FCS. The weight of the mice was monitored daily, and any mice that displayed signs of illness were sacrificed according to IACUC guidelines at the Wake Forest School of Medicine. Tumor length and width were measured by calipers daily beginning on the day of treatment. Tumor volume was calculated using the following equation: volume = width2 × length.
Statistical Analysis
Differences between cell types were analyzed by one-way analysis of variance (ANOVA) with Tukey’s correction for multiple comparisons using Prism 8 software (GraphPad) or ANOVA with Holm’s correction for multiple comparisons using R software.69
Author Contributions
R.S.B. and S.P. performed experiments. L.U.R. and S.D.C. generated the silenced cell lines and originally suggested the role of MAP3K7 and CHD1 in viral resistance. J.L. and C.M.F. performed the proteomics analysis and analyzed data. J.W.C. and L.D.M. performed the RNA-seq analysis and analyzed data. D.A.O. and D.S.L. designed experiments and analyzed data. R.S.B. and D.S.L. wrote the first drafts of the manuscript, and all authors contributed to manuscript revisions.
Conflicts of Interest
The authors declare no competing interests.
Acknowledgments
This study was supported by National Institutes of Health (NIH) grant R01 AI105012 (to D.S.L.), pilot funds from the Department of Biochemistry, Wake Forest School of Medicine, and NIH fellowships F30 AI129321 and T32 AI007401 (to R.S.B.). We also acknowledge the support of the Bioinformatics, Cancer Genomics, Cell Engineering, Flow Cytometry, and Proteomics and Metabolomics Shared Resources of the Wake Forest Baptist Comprehensive Cancer Center supported by NIH grant P30 CA012197.
Footnotes
Supplemental Information can be found online at https://doi.org/10.1016/j.omto.2020.05.004.
Supplemental Information
References
- 1.Critchley-Thorne R.J., Simons D.L., Yan N., Miyahira A.K., Dirbas F.M., Johnson D.L., Swetter S.M., Carlson R.W., Fisher G.A., Koong A. Impaired interferon signaling is a common immune defect in human cancer. Proc. Natl. Acad. Sci. USA. 2009;106:9010–9015. doi: 10.1073/pnas.0901329106. [DOI] [PMC free article] [PubMed] [Google Scholar]
- 2.Lichty B.D., Breitbach C.J., Stojdl D.F., Bell J.C. Going viral with cancer immunotherapy. Nat. Rev. Cancer. 2014;14:559–567. doi: 10.1038/nrc3770. [DOI] [PubMed] [Google Scholar]
- 3.Wang B.X., Rahbar R., Fish E.N. Interferon: current status and future prospects in cancer therapy. J. Interferon Cytokine Res. 2011;31:545–552. doi: 10.1089/jir.2010.0158. [DOI] [PubMed] [Google Scholar]
- 4.Kotredes K.P., Gamero A.M. Interferons as inducers of apoptosis in malignant cells. J. Interferon Cytokine Res. 2013;33:162–170. doi: 10.1089/jir.2012.0110. [DOI] [PMC free article] [PubMed] [Google Scholar]
- 5.Ortiz A., Fuchs S.Y. Anti-metastatic functions of type 1 interferons: foundation for the adjuvant therapy of cancer. Cytokine. 2017;89:4–11. doi: 10.1016/j.cyto.2016.01.010. [DOI] [PMC free article] [PubMed] [Google Scholar]
- 6.Russell S.J., Peng K.-W., Bell J.C. Oncolytic virotherapy. Nat. Biotechnol. 2012;30:658–670. doi: 10.1038/nbt.2287. [DOI] [PMC free article] [PubMed] [Google Scholar]
- 7.Turnbull S., West E.J., Scott K.J., Appleton E., Melcher A., Ralph C. Evidence for oncolytic virotherapy: where have we got to and where are we going? Viruses. 2015;7:6291–6312. doi: 10.3390/v7122938. [DOI] [PMC free article] [PubMed] [Google Scholar]
- 8.Pol J., Kroemer G., Galluzzi L. First oncolytic virus approved for melanoma immunotherapy. OncoImmunology. 2015;5:e1115641. doi: 10.1080/2162402X.2015.1115641. [DOI] [PMC free article] [PubMed] [Google Scholar]
- 9.Carey B.L., Ahmed M., Puckett S., Lyles D.S. Early steps of the virus replication cycle are inhibited in prostate cancer cells resistant to oncolytic vesicular stomatitis virus. J. Virol. 2008;82:12104–12115. doi: 10.1128/JVI.01508-08. [DOI] [PMC free article] [PubMed] [Google Scholar]
- 10.Moerdyk-Schauwecker M., Shah N.R., Murphy A.M., Hastie E., Mukherjee P., Grdzelishvili V.Z. Resistance of pancreatic cancer cells to oncolytic vesicular stomatitis virus: role of type I interferon signaling. Virology. 2013;436:221–234. doi: 10.1016/j.virol.2012.11.014. [DOI] [PMC free article] [PubMed] [Google Scholar]
- 11.Ahmed M., Cramer S.D., Lyles D.S. Sensitivity of prostate tumors to wild type and M protein mutant vesicular stomatitis viruses. Virology. 2004;330:34–49. doi: 10.1016/j.virol.2004.08.039. [DOI] [PubMed] [Google Scholar]
- 12.Centers for Disease Control and Prevention . 2018. United States cancer statistics: data visualizations.https://gis.cdc.gov/Cancer/USCS/DataViz.html [Google Scholar]
- 13.Pashayan N., Duffy S.W., Pharoah P., Greenberg D., Donovan J., Martin R.M., Hamdy F., Neal D.E. Mean sojourn time, overdiagnosis, and reduction in advanced stage prostate cancer due to screening with PSA: implications of sojourn time on screening. Br. J. Cancer. 2009;100:1198–1204. doi: 10.1038/sj.bjc.6604973. [DOI] [PMC free article] [PubMed] [Google Scholar]
- 14.Potosky A.L., Miller B.A., Albertsen P.C., Kramer B.S. The role of increasing detection in the rising incidence of prostate cancer. JAMA. 1995;273:548–552. [PubMed] [Google Scholar]
- 15.Afshar M., Evison F., James N.D., Patel P. Shifting paradigms in the estimation of survival for castration-resistant prostate cancer: a tertiary academic center experience. Urol. Oncol. 2015;33:338.e1–338.e7. doi: 10.1016/j.urolonc.2015.05.003. [DOI] [PubMed] [Google Scholar]
- 16.Seidenfeld J., Samson D.J., Hasselblad V., Aronson N., Albertsen P.C., Bennett C.L., Wilt T.J. Single-therapy androgen suppression in men with advanced prostate cancer: a systematic review and meta-analysis. Ann. Intern. Med. 2000;132:566–577. doi: 10.7326/0003-4819-132-7-200004040-00009. [DOI] [PubMed] [Google Scholar]
- 17.Kirby M., Hirst C., Crawford E.D. Characterising the castration-resistant prostate cancer population: a systematic review. Int. J. Clin. Pract. 2011;65:1180–1192. doi: 10.1111/j.1742-1241.2011.02799.x. [DOI] [PubMed] [Google Scholar]
- 18.Stojdl D.F., Lichty B., Knowles S., Marius R., Atkins H., Sonenberg N., Bell J.C. Exploiting tumor-specific defects in the interferon pathway with a previously unknown oncolytic virus. Nat. Med. 2000;6:821–825. doi: 10.1038/77558. [DOI] [PubMed] [Google Scholar]
- 19.Balachandran S., Barber G.N. Vesicular stomatitis virus (VSV) therapy of tumors. IUBMB Life. 2000;50:135–138. doi: 10.1080/713803696. [DOI] [PubMed] [Google Scholar]
- 20.Forbes N.E., Bell J.C. Oncolytic rhabdoviruses. In: Pattnaik A.K., Whitt M.A., editors. Biology and Pathogenesis of Rhabdo- and Filoviruses. World Scientific; 2015. pp. 231–261. [Google Scholar]
- 21.Lyles D.S. Cytopathogenesis of rhabdoviruses. In: Pattaik A.K., Whitt M.A., editors. Biology and Pathogenesis of Rhabdo- and Filoviruses. World Scientific; 2015. pp. 141–169. [Google Scholar]
- 22.Obuchi M., Fernandez M., Barber G.N. Development of recombinant vesicular stomatitis viruses that exploit defects in host defense to augment specific oncolytic activity. J. Virol. 2003;77:8843–8856. doi: 10.1128/JVI.77.16.8843-8856.2003. [DOI] [PMC free article] [PubMed] [Google Scholar]
- 23.Naik S., Nace R., Federspiel M.J., Barber G.N., Peng K.W., Russell S.J. Curative one-shot systemic virotherapy in murine myeloma. Leukemia. 2012;26:1870–1878. doi: 10.1038/leu.2012.70. [DOI] [PMC free article] [PubMed] [Google Scholar]
- 24.Stojdl D.F., Lichty B.D., tenOever B.R., Paterson J.M., Power A.T., Knowles S., Marius R., Reynard J., Poliquin L., Atkins H. VSV strains with defects in their ability to shutdown innate immunity are potent systemic anti-cancer agents. Cancer Cell. 2003;4:263–275. doi: 10.1016/s1535-6108(03)00241-1. [DOI] [PubMed] [Google Scholar]
- 25.Ahmed M., McKenzie M.O., Puckett S., Hojnacki M., Poliquin L., Lyles D.S. Ability of the matrix protein of vesicular stomatitis virus to suppress beta interferon gene expression is genetically correlated with the inhibition of host RNA and protein synthesis. J. Virol. 2003;77:4646–4657. doi: 10.1128/JVI.77.8.4646-4657.2003. [DOI] [PMC free article] [PubMed] [Google Scholar]
- 26.Ahmed M., Lyles D.S. Effect of vesicular stomatitis virus matrix protein on transcription directed by host RNA polymerases I, II, and III. J. Virol. 1998;72:8413–8419. doi: 10.1128/jvi.72.10.8413-8419.1998. [DOI] [PMC free article] [PubMed] [Google Scholar]
- 27.Black B.L., Lyles D.S. Vesicular stomatitis virus matrix protein inhibits host cell-directed transcription of target genes in vivo. J. Virol. 1992;66:4058–4064. doi: 10.1128/jvi.66.7.4058-4064.1992. [DOI] [PMC free article] [PubMed] [Google Scholar]
- 28.Rajani K.R., Pettit Kneller E.L., McKenzie M.O., Horita D.A., Chou J.W., Lyles D.S. Complexes of vesicular stomatitis virus matrix protein with host Rae1 and Nup98 involved in inhibition of host transcription. PLoS Pathog. 2012;8:e1002929. doi: 10.1371/journal.ppat.1002929. [DOI] [PMC free article] [PubMed] [Google Scholar]
- 29.von Kobbe C., van Deursen J.M., Rodrigues J.P., Sitterlin D., Bachi A., Wu X., Wilm M., Carmo-Fonseca M., Izaurralde E. Vesicular stomatitis virus matrix protein inhibits host cell gene expression by targeting the nucleoporin Nup98. Mol. Cell. 2000;6:1243–1252. doi: 10.1016/s1097-2765(00)00120-9. [DOI] [PubMed] [Google Scholar]
- 30.Faria P.A., Chakraborty P., Levay A., Barber G.N., Ezelle H.J., Enninga J., Arana C., van Deursen J., Fontoura B.M. VSV disrupts the Rae1/mrnp41 mRNA nuclear export pathway. Mol. Cell. 2005;17:93–102. doi: 10.1016/j.molcel.2004.11.023. [DOI] [PubMed] [Google Scholar]
- 31.Ferran M.C., Lucas-Lenard J.M. The vesicular stomatitis virus matrix protein inhibits transcription from the human beta interferon promoter. J. Virol. 1997;71:371–377. doi: 10.1128/jvi.71.1.371-377.1997. [DOI] [PMC free article] [PubMed] [Google Scholar]
- 32.Kim G.N., Kang C.Y. Matrix protein of VSV New Jersey serotype containing methionine to arginine substitutions at positions 48 and 51 allows near-normal host cell gene expression. Virology. 2007;357:41–53. doi: 10.1016/j.virol.2006.07.022. [DOI] [PubMed] [Google Scholar]
- 33.Black B.L., Rhodes R.B., McKenzie M., Lyles D.S. The role of vesicular stomatitis virus matrix protein in inhibition of host-directed gene expression is genetically separable from its function in virus assembly. J. Virol. 1993;67:4814–4821. doi: 10.1128/jvi.67.8.4814-4821.1993. [DOI] [PMC free article] [PubMed] [Google Scholar]
- 34.Yu N., Puckett S., Antinozzi P.A., Cramer S.D., Lyles D.S. Changes in susceptibility to oncolytic vesicular stomatitis virus during progression of prostate cancer. J. Virol. 2015;89:5250–5263. doi: 10.1128/JVI.00257-15. [DOI] [PMC free article] [PubMed] [Google Scholar]
- 35.Moussavi M., Fazli L., Tearle H., Guo Y., Cox M., Bell J., Ong C., Jia W., Rennie P.S. Oncolysis of prostate cancers induced by vesicular stomatitis virus in PTEN knockout mice. Cancer Res. 2010;70:1367–1376. doi: 10.1158/0008-5472.CAN-09-2377. [DOI] [PubMed] [Google Scholar]
- 36.Ajibade A.A., Wang H.Y., Wang R.-F. Cell type-specific function of TAK1 in innate immune signaling. Trends Immunol. 2013;34:307–316. doi: 10.1016/j.it.2013.03.007. [DOI] [PubMed] [Google Scholar]
- 37.Petty E., Pillus L. Balancing chromatin remodeling and histone modifications in transcription. Trends Genet. 2013;29:621–629. doi: 10.1016/j.tig.2013.06.006. [DOI] [PMC free article] [PubMed] [Google Scholar]
- 38.Liu W., Chang B.-L., Cramer S., Koty P.P., Li T., Sun J., Turner A.R., Von Kap-Herr C., Bobby P., Rao J. Deletion of a small consensus region at 6q15, including the MAP3K7 gene, is significantly associated with high-grade prostate cancers. Clin. Cancer Res. 2007;13:5028–5033. doi: 10.1158/1078-0432.CCR-07-0300. [DOI] [PubMed] [Google Scholar]
- 39.Wu M., Shi L., Cimic A., Romero L., Sui G., Lees C.J., Cline J.M., Seals D.F., Sirintrapun J.S., McCoy T.P. Suppression of Tak1 promotes prostate tumorigenesis. Cancer Res. 2012;72:2833–2843. doi: 10.1158/0008-5472.CAN-11-2724. [DOI] [PMC free article] [PubMed] [Google Scholar]
- 40.Rodrigues L.U., Rider L., Nieto C., Romero L., Karimpour-Fard A., Loda M., Lucia M.S., Wu M., Shi L., Cimic A. Coordinate loss of MAP3K7 and CHD1 promotes aggressive prostate cancer. Cancer Res. 2015;75:1021–1034. doi: 10.1158/0008-5472.CAN-14-1596. [DOI] [PMC free article] [PubMed] [Google Scholar]
- 41.Zhao D., Lu X., Wang G., Lan Z., Liao W., Li J., Liang X., Chen J.R., Shah S., Shang X. Synthetic essentiality of chromatin remodelling factor CHD1 in PTEN-deficient cancer. Nature. 2017;542:484–488. doi: 10.1038/nature21357. [DOI] [PMC free article] [PubMed] [Google Scholar]
- 42.Staeheli P., Pavlovic J. Inhibition of vesicular stomatitis virus mRNA synthesis by human MxA protein. J. Virol. 1991;65:4498–4501. doi: 10.1128/jvi.65.8.4498-4501.1991. [DOI] [PMC free article] [PubMed] [Google Scholar]
- 43.Pavlovic J., Zürcher T., Haller O., Staeheli P. Resistance to influenza virus and vesicular stomatitis virus conferred by expression of human MxA protein. J. Virol. 1990;64:3370–3375. doi: 10.1128/jvi.64.7.3370-3375.1990. [DOI] [PMC free article] [PubMed] [Google Scholar]
- 44.Washino S., Rider L.C., Romero L., Jillson L.K., Affandi T., Ohm A.M., Lam E.T., Reyland M.E., Costello J.C., Cramer S.D. Loss of MAP3K7 sensitizes prostate cancer cells to CDK1/2 inhibition and DNA damage by disrupting homologous recombination. Mol. Cancer Res. 2019;17:1985–1998. doi: 10.1158/1541-7786.MCR-18-1335. [DOI] [PMC free article] [PubMed] [Google Scholar]
- 45.Lu T., Burdelya L.G., Swiatkowski S.M., Boiko A.D., Howe P.H., Stark G.R., Gudkov A.V. Secreted transforming growth factor β2 activates NF-κB, blocks apoptosis, and is essential for the survival of some tumor cells. Proc. Natl. Acad. Sci. USA. 2004;101:7112–7117. doi: 10.1073/pnas.0402048101. [DOI] [PMC free article] [PubMed] [Google Scholar]
- 46.Lu T., Stark G.R. Cytokine overexpression and constitutive NFκB in cancer. Cell Cycle. 2004;3:1114–1117. [PubMed] [Google Scholar]
- 47.Schulze J., Weber K., Baranowsky A., Streichert T., Lange T., Spiro A.S., Albers J., Seitz S., Zustin J., Amling M. p65-Dependent production of interleukin-1β by osteolytic prostate cancer cells causes an induction of chemokine expression in osteoblasts. Cancer Lett. 2012;317:106–113. doi: 10.1016/j.canlet.2011.11.016. [DOI] [PubMed] [Google Scholar]
- 48.Thomas-Jardin S.E., Kanchwala M.S., Jacob J., Merchant S., Meade R.K., Gahnim N.M., Nawas A.F., Xing C., Delk N.A. Identification of an IL-1-induced gene expression pattern in AR+ PCa cells that mimics the molecular phenotype of AR− PCa cells. Prostate. 2018;78:595–606. doi: 10.1002/pros.23504. [DOI] [PMC free article] [PubMed] [Google Scholar]
- 49.Wilding G., Zugmeier G., Knabbe C., Flanders K., Gelmann E. Differential effects of transforming growth factor beta on human prostate cancer cells in vitro. Mol. Cell. Endocrinol. 1989;62:79–87. doi: 10.1016/0303-7207(89)90115-9. [DOI] [PubMed] [Google Scholar]
- 50.Gasparian A.V., Yao Y.J., Kowalczyk D., Lyakh L.A., Karseladze A., Slaga T.J., Budunova I.V. The role of IKK in constitutive activation of NF-κB transcription factor in prostate carcinoma cells. J. Cell Sci. 2002;115:141–151. doi: 10.1242/jcs.115.1.141. [DOI] [PubMed] [Google Scholar]
- 51.Platanias L.C. Mechanisms of type-I- and type-II-interferon-mediated signalling. Nat. Rev. Immunol. 2005;5:375–386. doi: 10.1038/nri1604. [DOI] [PubMed] [Google Scholar]
- 52.Hiscott J., Grandvaux N., Sharma S., Tenoever B.R., Servant M.J., Lin R. Convergence of the NF-κB and interferon signaling pathways in the regulation of antiviral defense and apoptosis. Ann. N Y Acad. Sci. 2003;1010:237–248. doi: 10.1196/annals.1299.042. [DOI] [PubMed] [Google Scholar]
- 53.Sims R.J., 3rd, Reinberg D. Stem cells: escaping fates with open states. Nature. 2009;460:802–803. doi: 10.1038/460802a. [DOI] [PubMed] [Google Scholar]
- 54.Benayoun B.A., Pollina E.A., Ucar D., Mahmoudi S., Karra K., Wong E.D., Devarajan K., Daugherty A.C., Kundaje A.B., Mancini E. H3K4me3 breadth is linked to cell identity and transcriptional consistency. Cell. 2014;158:673–688. doi: 10.1016/j.cell.2014.06.027. [DOI] [PMC free article] [PubMed] [Google Scholar]
- 55.Nguyên T.L.-A., Abdelbary H., Arguello M., Breitbach C., Leveille S., Diallo J.-S., Yasmeen A., Bismar T.A., Kirn D., Falls T. Chemical targeting of the innate antiviral response by histone deacetylase inhibitors renders refractory cancers sensitive to viral oncolysis. Proc. Natl. Acad. Sci. USA. 2008;105:14981–14986. doi: 10.1073/pnas.0803988105. [DOI] [PMC free article] [PubMed] [Google Scholar]
- 56.Shulak L., Beljanski V., Chiang C., Dutta S.M., Van Grevenynghe J., Belgnaoui S.M., Nguyên T.L., Di Lenardo T., Semmes O.J., Lin R., Hiscott J. Histone deacetylase inhibitors potentiate vesicular stomatitis virus oncolysis in prostate cancer cells by modulating NF-κB-dependent autophagy. J. Virol. 2014;88:2927–2940. doi: 10.1128/JVI.03406-13. [DOI] [PMC free article] [PubMed] [Google Scholar]
- 57.Muscolini M., Castiello L., Palermo E., Zevini A., Ferrari M., Olagnier D., Hiscott J. SIRT1 modulates the sensitivity of prostate cancer cells to vesicular stomatitis virus oncolysis. J. Virol. 2019;93 doi: 10.1128/JVI.00626-19. e00626-e19. [DOI] [PMC free article] [PubMed] [Google Scholar]
- 58.Kroczynska B., Mehrotra S., Arslan A.D., Kaur S., Platanias L.C. Regulation of interferon-dependent mRNA translation of target genes. J. Interferon Cytokine Res. 2014;34:289–296. doi: 10.1089/jir.2013.0148. [DOI] [PMC free article] [PubMed] [Google Scholar]
- 59.Livingstone M., Sikström K., Robert P.A., Uzé G., Larsson O., Pellegrini S. Assessment of mTOR-dependent translational regulation of interferon stimulated genes. PLoS ONE. 2015;10:e0133482. doi: 10.1371/journal.pone.0133482. [DOI] [PMC free article] [PubMed] [Google Scholar]
- 60.Masvidal L., Hulea L., Furic L., Topisirovic I., Larsson O. mTOR-sensitive translation: cleared fog reveals more trees. RNA Biol. 2017;14:1299–1305. doi: 10.1080/15476286.2017.1290041. [DOI] [PMC free article] [PubMed] [Google Scholar]
- 61.Joshi S., Kaur S., Kroczynska B., Platanias L.C. Mechanisms of mRNA translation of interferon stimulated genes. Cytokine. 2010;52:123–127. doi: 10.1016/j.cyto.2010.03.019. [DOI] [PubMed] [Google Scholar]
- 62.Huntzinger E., Izaurralde E. Gene silencing by microRNAs: contributions of translational repression and mRNA decay. Nat. Rev. Genet. 2011;12:99–110. doi: 10.1038/nrg2936. [DOI] [PubMed] [Google Scholar]
- 63.Forster S.C., Tate M.D., Hertzog P.J. MicroRNA as type I interferon-regulated transcripts and modulators of the innate immune response. Front. Immunol. 2015;6:334. doi: 10.3389/fimmu.2015.00334. [DOI] [PMC free article] [PubMed] [Google Scholar]
- 64.Kopecky S.A., Willingham M.C., Lyles D.S. Matrix protein and another viral component contribute to induction of apoptosis in cells infected with vesicular stomatitis virus. J. Virol. 2001;75:12169–12181. doi: 10.1128/JVI.75.24.12169-12181.2001. [DOI] [PMC free article] [PubMed] [Google Scholar]
- 65.Whitlow Z.W., Connor J.H., Lyles D.S. New mRNAs are preferentially translated during vesicular stomatitis virus infection. J. Virol. 2008;82:2286–2294. doi: 10.1128/JVI.01761-07. [DOI] [PMC free article] [PubMed] [Google Scholar]
- 66.Gaddy D.F., Lyles D.S. Vesicular stomatitis viruses expressing wild-type or mutant M proteins activate apoptosis through distinct pathways. J. Virol. 2005;79:4170–4179. doi: 10.1128/JVI.79.7.4170-4179.2005. [DOI] [PMC free article] [PubMed] [Google Scholar]
- 67.Lyles D.S., Puddington L., McCreedy B.J., Jr. Vesicular stomatitis virus M protein in the nuclei of infected cells. J. Virol. 1988;62:4387–4392. doi: 10.1128/jvi.62.11.4387-4392.1988. [DOI] [PMC free article] [PubMed] [Google Scholar]
- 68.Kwok A.T., Moore J.E., Rosas S., Kerr B.A., Andrews R.N., Nguyen C.M., Lee J., Furdui C.M., Collins B.E., Munley M.T., Willey J.S. Knee and hip joint cartilage damage from combined spaceflight hazards of low-dose radiation less than 1 Gy and prolonged hindlimb unloading. Radiat. Res. 2019;191:497–506. doi: 10.1667/RR15216.1. [DOI] [PMC free article] [PubMed] [Google Scholar]
- 69.Dalgaard P. Springer; 2008. Introductory Statistics with R. [Google Scholar]
- 70.Ritchie M.E., Phipson B., Wu D., Hu Y., Law C.W., Shi W., Smyth G.K. limma powers differential expression analyses for RNA-sequencing and microarray studies. Nucleic Acids Res. 2015;43:e47. doi: 10.1093/nar/gkv007. [DOI] [PMC free article] [PubMed] [Google Scholar]
- 71.Subramanian A., Tamayo P., Mootha V.K., Mukherjee S., Ebert B.L., Gillette M.A., Paulovich A., Pomeroy S.L., Golub T.R., Lander E.S., Mesirov J.P. Gene set enrichment analysis: a knowledge-based approach for interpreting genome-wide expression profiles. Proc. Natl. Acad. Sci. USA. 2005;102:15545–15550. doi: 10.1073/pnas.0506580102. [DOI] [PMC free article] [PubMed] [Google Scholar]
- 72.Mootha V.K., Lindgren C.M., Eriksson K.F., Subramanian A., Sihag S., Lehar J., Puigserver P., Carlsson E., Ridderstråle M., Laurila E. PGC-1α-responsive genes involved in oxidative phosphorylation are coordinately downregulated in human diabetes. Nat. Genet. 2003;34:267–273. doi: 10.1038/ng1180. [DOI] [PubMed] [Google Scholar]
- 73.Jayakar H.R., Whitt M.A. Identification of two additional translation products from the matrix (M) gene that contribute to vesicular stomatitis virus cytopathology. J. Virol. 2002;76:8011–8018. doi: 10.1128/JVI.76.16.8011-8018.2002. [DOI] [PMC free article] [PubMed] [Google Scholar]
Associated Data
This section collects any data citations, data availability statements, or supplementary materials included in this article.