

Abstract
Background:
Although a number of previous studies have noted the association between body mass index (BMI) and upper gastrointestinal (UGI) cancer risk, little evidence exists in the Chinese esophageal squamous dysplasia population. This prospective study investigated the association between BMI and UGI cancer risk in the Linxian Dysplasia Nutrition Intervention Trial (NIT) cohort.
Methods:
A total of 3298 participants were included in the final analysis. Asian-specific BMI cut-offs were used to define BMI subgroups: underweight <18.5 kg/m2, normal ≥18.5 to <24 kg/m2 and overweight or obese ≥24 kg/m2. Hazard ratios (HRs) and 95 % confidence intervals (95 %CIs) were estimated using the Cox proportional hazard model.
Results:
During over 30 years of follow-up we identified 654 incident esophageal squamous-cell carcinoma (ESCC) cases and 434 gastric cancer cases which included 88 gastric non-cardia carcinoma (GNCC) and 346 gastric cardia carcinoma (GCC) cases. Relative to normal weight, overweight or obesity were associated with a significantly reduced risk of ESCC (HR 0.69, 95 %CI 0.48–0.98) after multivariate adjustment, including age at baseline, gender, smoking, drinking, family history of cancer, education and consumption of fresh fruit. Subgroup analyses found that clear effects were evident in women and subjects with a family history of cancer. No association with gastric cancer was observed in any subjects or subgroups.
Conclusion:
Overweight/obesity was associated with decreased risk of ESCC in this dysplasia population, particularly in women and persons who had a family history of cancer. Future studies are needed to confirm these findings.
Keywords: Body mass index, Upper gastrointestinal cancer, Linxian dysplasia population, Trial cohort, Prospective study
1. Introduction
Upper gastrointestinal (UGI) cancer encompasses a heterogenous group of cancers that carry the worst prognosis of solid-tumor malignancies of the entire gastrointestinal tract [1]. Esophageal cancer is considered as a serious malignancy with respect to prognosis, and the outcome is fatal in the great majority of cases [2]. In 2018 it ranked as the eighth cause of cancer, causing an estimated 572,000 new cases and 508,000 deaths [3]. Esophageal squamous-cell carcinoma (ESCC) is the most common histological type of esophageal cancer worldwide, with a higher incidence in developing countries [4]. Gastric cancer, including gastric non-cardia carcinoma (GNCC) and gastric cardia carcinoma (GCC), has long been one of the major causes of malignant disease morbidity and mortality [5]. This disease remains the fifth leading cause of cancer-related incidence, with approximately 1,033,000 new cases and 782,000 deaths recorded worldwide in 2018 [3]. Approximately 54 % of ESCC and 44 % of gastric cancer cases occur in China [6]. Linxian is a rural county located in north central China; both ESCC and gastric cancer are present at unusually high rates in the Linxian population, and the reasons for this are unclear [7].
Overweight and obesity, generally assessed by various anthropometric measures including BMI and waist circumference, are currently more prevalent than ever. In 2016, an estimated 1.97 billion adults and over 338 million children and adolescents globally were categorized as overweight or obese [8]. It has been identified as a risk factor for many adverse health outcomes, including liver cancer [9], pancreatic cancer [10] and colorectal cancer [11]. However, the relationship between BMI and UGI cancer is still unclear. Higher BMIs were associated with an increased risk of ESCC and gastric cancer in some studies [12,13], whereas other reports indicated protective effects [14] or no effects [15]. This discrepancy may be caused by the differences in the study populations, outcome identification, cancer sites, and study design (cohort or case–control). Moreover, most studies were performed in North American [16,17] and European [14,18] populations, and little direct evidence is available for the Chinese population where the mean BMI is relatively low. Our research team previously conducted two randomized, placebo-controlled nutrition intervention trials (NITs), including dysplasia-based (3318 participants) and general-population-based (29,584 participants) trials, and the purpose was to test the effects of vitamin and mineral supplements in lowering the rates of esophageal cancer and gastric cancer [19]. In a previous study [20], our colleagues reported a strong intrinsic association between higher BMI and lower risk of GNCC, but not with GCC in the NIT general population. However, we are still unaware whether the dysplasia-based trial cohort has the same pattern as the general-population-based cohort. Herein, we aimed to examine the associations between BMI and risk of ESCC and gastric cancer in the Linxian Dysplasia Trial cohort in China.
2. Methods
2.1. Study population
Detailed information on the Linxian dysplasia trial cohort has been reported in previous studies [19,21]. Briefly, 3318 adults with a cytological diagnosis of esophageal squamous dysplasia (ESD) received either daily supplementation with 26 vitamins and minerals in doses typically two to three times the United States recommended daily allowances, or placebos for 6 years, beginning in May 1985. Potential participants were eligible if they were aged between 40 and 69 years, lived in one of four northern Linxian communes (Yaocun, Rencun, Hengshui, and Donggang), signed informed consent, and had a diagnosis of ESD based on a balloon cytology examination. Individuals were excluded if they were taking any vitamins or minerals regularly, or had a history of malignancy or other chronic diseases. We excluded 16 subjects with missing BMI data at baseline and four subjects who were lost to follow-up. A total of 3298 individuals were included in the final analysis to explore the association between BMI and risk of UGI cancer during the period of over 30 years.
This study was approved by the institutional review boards of the Cancer Hospital, Chinese Academy of Medical Sciences (CHCAMS), and the United States National Cancer Institute (NCI), and written informed consent was obtained from all participants prior to their participation.
2.2. Baseline questionnaire and data collection
Study participants were interviewed by trained medical personnel using a standardized questionnaire, and detailed information was obtained on age, gender, BMI, smoking, drinking, education, family history of cancer, and dietary habits. Participants’ height and weight were measured during the physical examination (conducted by village doctors) using a standard protocol. BMI was calculated as weight in kilograms divided by the square of the height in meters (kg/m2). Ever users of tobacco were defined as individuals who had smoked cigarettes, or used a hookah or pipe at least weekly for at least 6 months, and use of alcohol was dichotomized into no alcohol or any alcohol consumed in the previous 12 months. Family history of cancer was considered positive if cancer was reported in at least one first-degree relative, including parents, siblings, or offspring. Family history of any cancer was confirmed by the Linxian Cancer Registry. Dietary variables collected from the baseline questionnaire included the intake frequency of persimmon bread, moldy bread, foods cooked in oil, meats, eggs, fresh fruit, and vegetables. To avoid the bias caused by seasonal effects, we calculated the frequency of fresh fruit and vegetable consumption in winter/spring and summer/autumn seasons.
2.3. Classification of BMI
As Asians in general have relatively low BMIs, the World Health Organization, the International Association for the Study of Obesity, and the International Obesity Task Force all recommended lower BMI cut-offs to define overweight and obesity in Asian populations. In 2013, BMI was divided into different groups according to the ‘Criteria of Weight for Adults’ released by the NHFPC of China, which defined four groups according to the following BMI cut-offs: underweight (BMI<18.5 kg/m2), normal (BMI ≥ 18.5 to <24 kg/m2), overweight (BMI ≥ 24 to <28 kg/m2), and obese (BMI ≤ 28 kg/m2). As this study was conducted in a relatively lean population, only ten subjects were obese based on these criteria. Therefore, all subjects were divided into three groups with the following cutoffs: normal (BMI ≥ 18.5 to <24 kg/m2), underweight (BMI<18.5 kg/m2) and overweight or obese (BMI ≥ 24 kg/m2).
2.4. Follow-up of cancer
During the 6-year trial period (May 1, 1985-April 30, 1991), village health workers visited participants monthly to ascertain vital and disease statuses. Diagnostic materials (case records, pathology slides, and x-rays) for 85 % of the cancer cases—such as ESCCs and gastric cancers—were available and were reviewed by a panel of American and Chinese experts. Compliance was assessed by counting unused pills monthly and assaying blood nutrient levels in a randomly selected subgroup every 3 months. In the subsequent 24.42 years (May 1, 1991-September 30, 2015), village health workers or study interviewers continued to contact participants monthly. For new cancer diagnoses, diagnostic materials were collected and cancer diagnoses were verified by the panel of American and Chinese experts (1991–1996) or senior Chinese diagnosticians from Beijing (1996 to now). Upon review of the diagnostic criteria for incident UGI cancer cases, not all the of them were histopathologically confirmed in our study which was set in a resource-poor population in rural China, and which until recently lacked access to CT and MRI scanners. Diagnosis was based on a variety of methods, including pathologic review (363, 33.4 %), x-rays (339, 31.2 %), endoscopy (208, 19.1 %), clinical examination (87, 8.0 %), cytology (79, 7.3 %) and biochemical assays (12, 1.1 %). Each commune was considered as a unit for record-keeping. Town hospitals and their affiliated village clinics participated in followup care, assisted by the Bureau of Health and the Cancer Prevention and Control Institute in Linxian. Data on cancer incidence were collected, entered into the registry, classified, and reported to CHCAMS. Throughout the trial and the post-trial follow-up, case ascertainment was considered complete and loss to follow-up was minimal (n = 4, or <1 %). All esophageal cancers were ESCC. Gastric cancer can be divided into GNCC and GCC; cancers in the proximal 3 cm of the stomach were defined as GCC, and those originating elsewhere in the stomach were defined as GNCC [22].
2.5. Statistical analysis
The primary outcomes of this study were incidence of ESCC and gastric cancer. Participants were censored from May 1, 1985 until an event (i.e., incident ESCC or gastric cancer) or right censoring (i.e., other cancer diagnosis, death, last date of follow-up or September 30, 2015), whichever occurred first.
Frequencies and percentages for demographic characteristics were calculated and compared by BMI category using non-parametric Kruskal-Wallis or chi-squared (χ2) tests. Cox proportional hazards regression models were used to calculate hazard ratios (HRs) and 95 % confidence intervals (95 %CIs) for the association between BMI and risk of ESCC and gastric cancer. Potential confounders included age at baseline (continuous variable), gender (men/women), smoking (former, current and never), drinking (yes/no), family history of cancer (yes/no), education (none or less than primary education, or primary education and beyond, or unknown), and consumption of fresh fruit (continuous variable). Stratification analyses were performed by age at baseline (< 55 and ≥55 years), gender (men/women), smoking (former, current and never), drinking (yes/no) and family history of cancer (yes/no). Subjects with normal BMI were considered as a reference group in both overall and subgroup analyses. Kaplan-Meier estimates were plotted to compare cumulative incidence rates of ESCC for each BMI category. All p values were two-sided, and p<0.05 was considered statistically significant. Analyses were conducted using SPSS version 22.0 (IBM Corp, Armonk, NY, USA; http://www.ibm.com).
3. Results
Baseline demographic characteristics of study participants are presented according to the three BMI categories (Table 1). Among the three groups, overweight or obese subjects (BMI ≥ 24 kg/m2) were younger (57.0 %), more often women (75.2 %), were more likely to have no education (50.0 %), had higher consumption of fresh fruit (0.23 times/ week), and were mostly non-smokers (85.1 %) and non-drinkers (84.3 %). Most of characteristics differed significantly across the three BMI categories (p<0.05) except for family history of cancer and consumption of fresh vegetables.
Table 1.
Baseline demographic characteristics by BMI in the Linxian dysplasia population trial cohort.
| Variable | BMI, kg/m2 |
P-value1 | ||
|---|---|---|---|---|
| Normal (≥18.5 to <24.0) | Underweight (< 18.5) | Overweight or obese (≥24.0) | ||
| Age at baseline (n, %)2 | <0.001 | |||
| <55 years | 1345(56.5 %) | 297(44.0 %) | 138(57.0 %) | |
| ≥55 years | 1036(43.5 %) | 378(56.0 %) | 104(43.0 %) | |
| Gender (n, %)2 | <0.001 | |||
| Men | 1138(47.8 %) | 249(36.9 %) | 60(24.8 %) | |
| Women | 1243(52.2 %) | 426(63.1 %) | 182(75.2 %) | |
| Education (n, %)2 | <0.001 | |||
| Non | 964(40.5 %) | 318(47.1 %) | 121(50.0 %) | |
| < Primary education | 742(31.2 %) | 180(26.7 %) | 59(24.4 %) | |
| ≥ Primary education | 351(14.7 %) | 52(7.7 %) | 26(10.7 %) | |
| Unknown | 324(13.6 %) | 125(18.5 %) | 36(14.9 %) | |
| Smoking (n, %)2 | <0.001 | |||
| Former | 203(8.5 %) | 76(11.3 %) | 15(6.2 %) | |
| Current | 541(22.7 %) | 102(15.1 %) | 21(8.7 %) | |
| Never | 1637(68.8 %) | 497(73.6 %) | 206(85.1 %) | |
| Drinking (n, %)2 | 0.035 | |||
| Yes | 470(19.7 %) | 107(15.9 %) | 38(15.7 %) | |
| No | 1911(80.3 %) | 568(84.1 %) | 204(84.3 %) | |
| Family history of cancer (n, %)2 | 0.876 | |||
| Yes | 1046(43.9 %) | 294(43.6 %) | 110(45.5 %) | 0.876 |
| No | 1355(56.1 %) | 381(56.4 %) | 132(54.5 %) | |
| Consumption of fresh fruit (Mean±SD, times/week) | 0.22±0.65 | 0.18±0.56 | 0.23±0.53 | 0.001 |
| Consumption of fresh vegetables (Mean±SD, times/week) | 11.65±4.46 | 11.74±4.50 | 12.02±4.49 | 0.397 |
P value derived from χ2 or nonparametric Kruskal–Wallis tests, as appropriate, for categorical and continuous variables.
Percent was calculated by the target variable divided by the number of participants in each BMI category. Bold text indicates statistical significance. BMI, body mass index. SD, standard deviation.
During over 30 years of follow-up, 1088 incident UGI cases were identified, including 654 incident ESCC cases and 434 incident gastric cancer cases (88 GNCC cases and 346 GCC cases), accounting for nearly 90 % of all new cancer cases. Crude, age- and gender-adjusted, and fully adjusted HRs and 95 %CIs for the associations between BMI and the risk of ESCC and gastric cancer are shown in Table 2. Overweight or obesity was associated with a significantly reduced risk of ESCC (HR 0.66, 95 %CI 0.47–0.93) compared with the normal BMI group. The HR remained statistically significant after additional adjustment for age at baseline and gender (HR 0.68, 95 %CI 0.48–0.97). Moreover, overweight or obese participants had a 31 % lower risk of ESCC (HR 0.69, 95 %CI 0.48–0.98) after multivariable adjustment for potential risk factors, including age at baseline, gender, smoking, drinking, family history of cancer, education and consumption of fresh fruit. However, no associations were observed for BMI and risk of gastric cancer. Furthermore, we did statistical sensitivity analysis by exclusion of subjects with <12 months of follow-up, and our results did not materially change, suggesting a satisfactory stability of our results (Supplementary Table S1).
Table 2.
Crude and adjusted HRs and 95 % CIs for the associations between BMI and risk of ESCC and GC in the Linxian dysplasia population trial cohort.
| BMI (kg/m2) Normal (≥18.5 to <24.0) | Underweight (< 18.5) | Overweight or obese (≥24.0) | |
|---|---|---|---|
| ESCC | |||
| No. of cases | 495 | 121 | 34 |
| Crude HR (95 % Cl) | 1.00 | 1.28(0.87–1.87) | 0.66(0.47–0.93) |
| P-value | 0.089 | 0.018 | |
| Age- and gender-adjusted HR (95 % Cl) | 1.00 | 1.26(0.86–1.85) | 0.68(0.48–0.97) |
| P-value | 0.133 | 0.031* | |
| Multivariate adjusted HR (95 % CI)a | 1.00 | 1.22(0.82–1.78) | 0.69(0.48–0.98) |
| P-value | 0.098 | 0.035 | |
| GC b | |||
| No. of cases | 316 | 88 | 30 |
| Crude HR (95 % CI) | 1.00 | 1.08(0.71–1.63) | 0.91(0.62–1.32) |
| P-value | 0.843 | 0.603 | |
| Age- and gender-adjusted HR (95 % CI) | 1.00 | 1.02(0.80–1.29) | 1.06(0.73–1.55) |
| P-value | 0.881 | 0.753 | |
| Multivariate adjusted HR (95 % CI)a | 1.00 | 0.99(0.78–1.26) | 1.06(0.73–1.55) |
| P-value | 0.943 | 0.716 | |
P value derived from Cox regression analysis. Bold text indicates statistical significance. HR, hazard ratio. CI, confidence interval. BMI, body mass index. ESCC, esophageal squamous cell carcinoma. GC, gastric cancer.
Adjusted for age at baseline, gender, smoking, drinking, family history of cancer, education and consumption of fresh fruit.
Including gastric non-cardia carcinoma (GNCC) and cardia carcinoma (GCC).
Table 3 shows the subgroup analyses for the associations between BMI and risk of ESCC and gastric cancer stratified by age at baseline, gender, smoking, drinking and family history of cancer. During over 30 years of follow-up, compared with normal BMI subjects, overweight or obese dysplasia patients had a 34 % reduced risk of ESCC in women (HR 0.66, 95 %CI 0.44–0.99) and 42 % reduced risk in those with a family history of cancer (HR 0.58, 95 %CI 0.35–0.99). We also found that gender and family history of cancer interacted with BMI for the risk of ESCC, respectively (Pgender*BMI = 0.020, Pfamily history of cancer*BMI = 0.003). No associations were observed between BMI and risk of gastric cancer in any subgroup analyses.
Table 3.
Stratification analyses for the associations between BMI and risk of ESCC and GC in the Linxian dysplasia population trial cohort.
| ESCC |
GC |
|||||
|---|---|---|---|---|---|---|
| Normal (≥18.5 to <24.0) | Underweight (< 18.5) | Overweight or obese (≥24.0) | Normal (≥18.5 to <24.0) | Underweight (< 18.5) | Overweight or obese (≥24.0) | |
| Age at baselinea | ||||||
| <55 years | 1.00 | 1.35(0.81–2.24) | 0.67(0.42–1.06) | 1.00 | 1.10(0.76–1.60) | 1.08(0.64–1.81) |
| ≥55 years | 1.00 | 1.09(0.59–1.86) | 0.72(0.42–1.25) | 1.00 | 0.95(0.69–1.30) | 1.04(0.60–1.81) |
| P for interaction | 0.243 | 0.930 | ||||
| Genderb | ||||||
| Men | 1.00 | 1.13(0.55–2.03) | 0.75(0.38–1.46) | 1.00 | 0.72(0.43–1.32) | 1.58(0.93–2.69) |
| Women | 1.00 | 1.30(0.84–2.04) | 0.66(0.44–0.99) | 1.00 | 1.12(0.62–2.01) | 0.75(0.44–1.28) |
| P for interaction | 0.020 | 0.047 | ||||
| Smokingc | ||||||
| Former | 1.00 | 1.05(0.58–2.08) | 0.57(0.14–2.40) | 1.00 | 0.66(0.15–1.79) | 1.35(0.77–2.39) |
| Current | 1.00 | 1.08(0.42–1.89) | 0.78(0.25–2.45) | 1.00 | 0.82(0.55–1.23) | 1.19(0.72–1.97) |
| Never | 1.00 | 1.27(0.85–1.94) | 0.69(0.47–1.01) | 1.00 | 0.83(0.61–1.15) | 0.96(0.61–1.49) |
| P for interaction | 0.545 | 0.235 | ||||
| Drinkingd | ||||||
| Yes | 1.00 | 1.04(0.42–2.60) | 0.83(0.36–1.91) | 1.00 | 0.81(0.46–1.40) | 0.88(0.35–2.19) |
| No | 1.00 | 1.28(0.83–1.94) | 0.65(0.34–1.05) | 1.00 | 0.93(0.58–1.51) | 1.12(0.74–1.69) |
| P for interaction | 0.810 | 0.668 | ||||
| Family history of cancere | ||||||
| Yes | 1.00 | 1.09(0.83–1.44) | 0.58(0.35–0.99) | 1.00 | 0.98(0.68–1.43) | 1.10(0.63–1.91) |
| No | 1.00 | 1.25(0.78–2.01) | 0.76(0.48–1.22) | 1.00 | 0.75(0.55–1.68) | 1.03(0.62–1.73) |
| P for interaction | 0.003 | 0.992 | ||||
Bold text indicates statistical significance. BMI, body mass index. ESCC, Esophageal squamous cell carcinoma. GC, Gastric cancer, including gastric non-cardia carcinoma (GNCC) and cardia carcinoma (GCC).
Adjusted for gender, smoking, drinking, family history of cancer, education and consumption of fresh fruit.
Adjusted for age at baseline, smoking, drinking, family history of cancer, education and consumption of fresh fruit.
Adjusted for age at baseline, gender, drinking, family history of cancer, education and consumption of fresh fruit.
Adjusted for age at baseline, gender, smoking, family history of cancer, education and consumption of fresh fruit.
Adjusted for age at baseline, gender, smoking, drinking, education and consumption of fresh fruit.
Fig. 1 shows the cumulative incidence curves of ESCC by BMI categories during over 30 years of follow-up in all subjects (A) and subgroups (B: men, C: women). Compared with the normal BMI group, a higher cumulative incidence rate of ESCC was observed in the underweight group (all participants: 22.9 % versus 19.5 %, p 0.088; men: 24.1 % versus 19.6 %, p 0.300; women: 21.9 % versus 19.2 %, p 0.248), while lower cumulative incidence was observed in overweight or obese groups (all participants: 15.3 % versus 19.5 %, p 0.017; men: 18.3 % versus 19.6 %, p 0.352; women: 14.2 % versus 19.2 %, p 0.048).
Fig. 1.
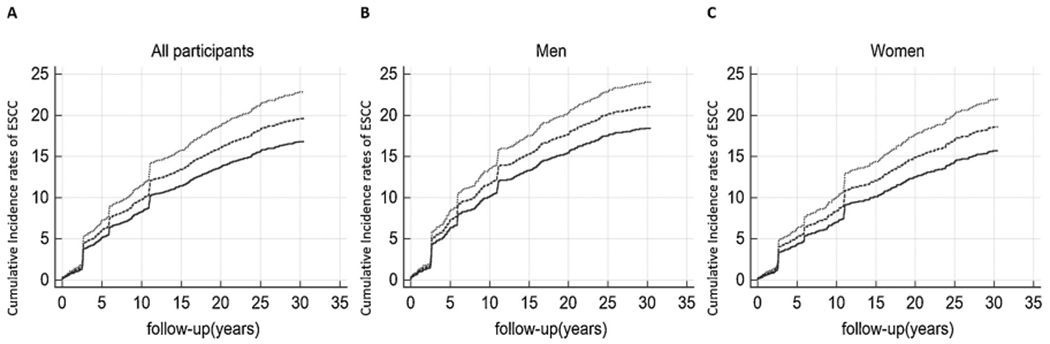
Effect of BMI on the cumulative incidence rates of ESCC for all participants (A), men (B) and women (C). Dotted lines represent underweight participants (BMI <18.5 kg/m2); dashed lines represent normal participants (BMI >18.5 to <24 kg/m2); solid lines represent overweight or obese participants (BMI >24 kg/ m2).(….) Underweight,(——) Normal, and (—) Overweight or obese.
4. Discussion
This study prospectively examined the association between BMI and risk of UGI cancer in the Linxian dysplasia population trial cohort followed up for over 30 years. Overall, we found that overweight or obese dysplasia patients had a 31 % reduced risk of ESCC compared with the normal-BMI group. Stratification analyses found that clear effects were evident in women and subjects with a family history of cancer. No associations with gastric cancer were observed in any subjects or subgroups. The present study is an extension of the etiological exploration of NIT in Linxian, based on the published results of a general-population-based cohort, aiming to comprehensively compare the difference in BMI-related cancer incidences and to improve health management and tumor monitoring in a high-risk population of esophageal cancer.
There have been some epidemiological studies which have explored the relationship between BMI and the risk of esophageal cancer, but many of these have been carried out in Western populations [14,23,24]. Esophageal cancer is dominated by esophageal adenocarcinoma (EAC) in Western countries and by ESCC in China; these are the two main histological types of the disease. There are some differences in the association between BMI and different types of esophageal cancer. A high BMI was associated positively with the risk of gastroesophageal reflux disease (GERD) and EAC, but inversely with the risk of ESCC. A 2008 meta-analysis by Smith et al. [25] that included ten studies on ESCC indicated that each 5 kg/m2 increase in BMI was associated with a 51% lower risk of ESCC in case-control studies [26,27] and prospective studies [14,28] respectively. Therefore, our estimate of the reduced risk of ESCC in dysplasia with higher BMI was supported by these studies. The observed inverse association between BMI and ESCC in China (as well as in other populations) is probably real, though not necessarily causal. For EAC, the increased risk with high BMI probably represents a causal effect. There is good evidence that increased body fatness is associated with increased gastroesophageal reflux, perhaps as a result of increased intra-abdominal pressure or hiatal hernia, and reflux in turn can lead to Barrett’s esophagus, a known potential precursor to adenocarcinoma [29].
The largest meta-analysis to date [30], with a population of more than 10 million subjects from 24 prospective studies, showed that neither overweight nor obesity was associated with risk of total gastric cancer; these analyses were restricted to an Asian population, and are consistent with our finding of the association between BMI and gastric cancer (including GNCC and GCC). Another population-based cohort study in Norway with 73,133 participants also showed no association between BMI and risk of gastric cancer [31]. However, the IARC Working Group concluded that there was sufficient evidence to link body fatness and risk of gastric cardia, while for gastric non-cardia and ESCC the evidence of the association was considered inadequate [32]. The World Cancer Research Fund CUP program came to a similar conclusion which is inconsistent with our study. One reason for this is that different cut-off values were used in different studies. In our cohort study, dysplasia patients were classified according to Asian-specific BMI cut-off values (overweight: BMI ≥ 24 to <28 kg/m2 and obese: BMI ≥ 28 kg/m2), while the IARC Working Group employed currently recognized international standards in which overweight was defined as a BMI of 25.0–29.9 kg/m2 and obesity as a BMI of ≥30 kg/m2. Another plausible reason for the observed discrepancies is that this study was conducted in a nutritionally deprived dysplasia population with extremely high incidence rates of ESCC. From the perspective of the particularity of the cohort population, and the differences in regions and living habits, we thought it was reasonable to obtain different results. Therefore, whether or not overweight or obesity is truly associated with the risk of gastric cancer needs further exploration.
Results of subgroup analyses extended prior observational studies by permitting additional evaluation of some factors—such as gender and family history and the ability to more precisely evaluate risk with overweight or obesity—by providing more stable estimates of the association between BMI and UGI cancer. Gender is a possible confounder of the association between BMI and UGI cancer, since it has been related to both UGI cancer and BMI. In our gender-specific analysis, an association between overweight or obesity and the risk of ESCC was observed in women, which was consistent with the findings from the Million Women Study (United Kingdom) [33] reporting that ESCC incidence was reduced by 68 % (range 37–83 %) per 10-unit increase in BMI (estimated reduction per 5-unit increase approximately 43 %; range 22–59 %). It is intriguing to consider that gender differences in body fat distribution may affect this association in gender-specific analysis. For example, overweight or obese women deposit more body fat in their subcutaneous tissues, while men tend to have more centralized, visceral fat, which is more active in the production of leptin and adiponectin [34]. This may partly explain why BMI itself may be more important for ESCC risk among women, while measures of fat distribution appeared more strongly associated with Barrett’s esophagus among predominantly male populations [35,36]. However, there are few reports presenting results from the stratified analyses by family history of cancer. More relevant studies are warranted to verify these findings.
Biological mechanisms of the association between BMI and risk of ESCC remain unknown. Among many plausible interpretations, longterm increasingly improving nutritional status, for which an increase in BMI can be considered a proxy, might be noteworthy. Unfortunately, data reflecting the changes in BMI in the follow-up period are scarce. Furthermore, metabolic changes associated with obesity—including impaired glucose tolerance, hyperlipidemia, insulin resistance and hyperinsulinemia, as well as altered levels of circulating hormones and insulin-like growth factor I and its binding proteins—may contribute to the obesity-related risks of certain cancers [37]. Alternatively, the pleiotropic capacities of genetic factors—namely, shared and multifunctional genes and pathways—may contribute to the observed association [38]. However, BMI must be a joint consequence of metabolic, genetic and environmental factors, and it is unlikely that these findings can be fully explained by any one of these components. Further studies with available metabolic, genetic and environmental data are needed.
The major strengths of our study are its large sample size, prospective study design, high response rate (3314/3318, 99.9 %), and a follow-up period of > 30 years. All analyses were based on actual measurements of height and weight at baseline, thus reducing the possibility for misclassification of BMI status. Analysis of incident cancer cases also minimized potential biases that may occur in mortality-based studies, such as competing risk bias. In addition, detailed information is available not only for a range of potential confounding factors but also about prior disease history and general health status, thus providing a good opportunity to minimize the potential effects of confounding and reverse causality on this association.
Several potential limitations of this study should not be ignored. First, information on long-term changes in BMI measurements was not available since the measurements were taken only at baseline. However, ESCC and gastric cancer risk observed with excess BMI remained relatively stable across years of follow-up, supporting the validity of our observations. Second, we were unable to examine the role of anthropometric indices such as waist-to-hip ratio, which may be a better indicator of adiposity as a cancer risk factor. Furthermore, although we adjusted for many potential confounders, we cannot exclude the possibility of residual confounding due to unknown and unmeasured factors. Alcohol drinking status, for example, is considered to be associated with ESCC, but we only collected dichotomous data about alcohol drinking as yes/no at baseline, rather than multicategory data (former, current or never drinking). Another unmeasured factor was socioeconomic status (SES). Earlier studies have suggested that SES may be associated with BMI [39] which has consistently been linked to ESCC risk [40,41], but we could not obtain information on SES in this study. However, education level is known to be an indispensable indicator of SES [42], thus we included education level as a confounder into the final model, and our results did not materially alter. Finally, we only included participants with a cytological diagnosis of ESD in our study, so the generalization of our results to other populations remains uncertain.
5. Conclusions
In summary, we confirmed that overweight or obesity in individuals was associated with a reduced risk of ESCC in the Linxian dysplasia-based NIT cohort, particularly in women and persons with a family history of cancer. Given the late presentation and poor survival of ESCC, there is an urgent need to understand the causal pathways and find modifiable factors such as BMI, offering the potential dual benefits of decreasing ESCC incidence and mortality. Additional studies are needed to confirm these findings in other Asian populations.
Supplementary Material
Acknowledgments
We thank the participants and staff of the Dysplasia Trial Cohort Study for their valuable contributions. Participants did not receive compensation and staff were not compensated outside of their salaries.
Funding
This study was supported by a US National Cancer Institute contract (HHSN261201700047C) to the Cancer Hospital, Chinese Academy of Medical Sciences, China.
Footnotes
Declaration of Competing Interest
No authors report any conflict of interest.
Appendix A. Supplementary data
Supplementary material related to this article can be found, in the online version, at doi:https://doi.org/10.1016/j.canep.2020.101683.
References
- [1].Shah MA, Kurtz RC, Upper gastrointestinal cancer predisposition syndromes, Hematol. Oncol. Clin. North Am 24 (2010) 815–835. [DOI] [PubMed] [Google Scholar]
- [2].Umar SB, Fleischer DE, Esophageal cancer: epidemiology, pathogenesis and prevention, Nat. Clin. Pract. Gastroenterol. Hepatol 5 (2008) 517–526. [DOI] [PubMed] [Google Scholar]
- [3].Bray F, Ferlay J, Soerjomataram I, Siegel RL, Torre LA, Jemal A, Global cancer statistics 2018: GLOBOCAN estimates of incidence and mortality worldwide for 36 cancers in 185 countries, CA Cancer J. Clin 68 (2018) 394–424. [DOI] [PubMed] [Google Scholar]
- [4].Liang H, Fan JH, Qiao YL, Epidemiology, etiology, and prevention of esophageal squamous cell carcinoma in China, Cancer Biol. Med 14 (2017) 33–41. [DOI] [PMC free article] [PubMed] [Google Scholar]
- [5].de Martel C, Forman D, Plummer M, Gastric cancer: epidemiology and risk factors, Gastroenterol. Clin. North Am 42 (2013) 219–240. [DOI] [PubMed] [Google Scholar]
- [6].Globocan Estimated Cancer Incidence, Mortality and Prevalence Worldwide in 2018, (2018) http://globocan.iarc.fr/Pages/fact_sheets_population.aspx.
- [7].Ke L, Mortality and incidence trends from esophagus cancer in selected geographic areas of China circa 1970–90, Int. J. Cancer 102 (2002) 271–274. [DOI] [PubMed] [Google Scholar]
- [8].Abarca-Gómez L, Abdeen ZA, Hamid ZA, Ivkovic DZ,V, et al. , Worldwide trends in body-mass index, underweight, overweight, and obesity from 1975 to 2016: a pooled analysis of 2416 population-based measurement studies in 128·9 million children, adolescents, and adults, Lancet (2017) 2627–2642. [DOI] [PMC free article] [PubMed] [Google Scholar]
- [9].Guo L, Liu S, Zhang S, Chen Q, Zhang M, Quan P, Sun X, et ah A meta-analysis of body mass index and the risk of lung cancer in the Chinese population, Zhonghua Yu Fang Yi Xue Za Zhi 49 (2015) 649–653. [PubMed] [Google Scholar]
- [10].Aune D, Greenwood DC, Chan DS, Vieira R, Vieira AR, Navarro Rosenblatt DA, Norat T, et al. , Body mass index, abdominal fatness and pancreatic cancer risk: a systematic review and non-linear dose-response meta-analysis of prospective studies, Ann. Oncol 23 (2012) 843–852. [DOI] [PubMed] [Google Scholar]
- [11].Chen W, Liu Q, Tan SY, Jiang YH, Association between carcinoembryonic antigen, carbohydrate antigen 19-9 and body mass index in colorectal cancer patients, Mol. Clin. Oncol 1 (2013) 879–886. [DOI] [PMC free article] [PubMed] [Google Scholar]
- [12].Abnet CC, Freedman ND, Hollenbeck AR, Fraumeni JF Jr., Leitzmann M, Schatzkin A, A prospective study of BMI and risk of oesophageal and gastric adenocarcinoma, Eur. J. Cancer 44 (2008) 465–471. [DOI] [PMC free article] [PubMed] [Google Scholar]
- [13].Turati F, Tramacere I, La Vecchia C, Negri E, A meta-analysis of body mass index and esophageal and gastric cardia adenocarcinoma, Ann. Oncol 24 (2013) 609–617. [DOI] [PubMed] [Google Scholar]
- [14].Engeland A, Tretli S, Bjorge T, Height and body mass index in relation to esophageal cancer; 23-year follow-up of two million Norwegian men and women, Cancer Causes Control 15 (2004) 837–843. [DOI] [PubMed] [Google Scholar]
- [15].Kramer JR, Fischbach LA, Richardson P, Alsarraj A, Fitzgerald S, Shaib Y, El-Serag HB, et al. , Waist-to-hip ratio, but not body mass index, is associated with an increased risk of Barrett’s esophagus in white men, Clin. Gastroenterol. Hepatol 11 (2013) 373–381.e371. [DOI] [PMC free article] [PubMed] [Google Scholar]
- [16].Kort EJ, Sevensma E, Fitzgerald TL, Trends in esophageal cancer and body mass index by race and gender in the state of Michigan, BMC Gastroenterol. 9 (2009) 47. [DOI] [PMC free article] [PubMed] [Google Scholar]
- [17].Wong J, Rahman S, Saeed N, Lin HY, Almhanna K, Shridhar R, Meredith KL, et al. , Effect of body mass index in patients undergoing resection for gastric cancer: a single center US experience, J. Gastrointest. Surg 18 (2014) 505–511. [DOI] [PubMed] [Google Scholar]
- [18].Samanic C, Chow WH, Gridley G, Jarvholm B, Fraumeni JF Jr., Relation of body mass index to cancer risk in 362,552 Swedish men, Cancer Causes Control 17 (2006) 901–909. [DOI] [PubMed] [Google Scholar]
- [19].Taylor PR, Li B, Dawsey SM, Li JY, Yang CS, Guo W, Blot WJ, Prevention of esophageal cancer: the nutrition intervention trials in Linxian, China. Linxian Nutrition Intervention Trials Study Group, Cancer Res. 54 (1994) 2029s–2031s. [PubMed] [Google Scholar]
- [20].Fan JH, Wang JB, Body mass index and risk of gastric cancer: a 30-year follow-up study in the Linxian general population trial cohort, Cancer Sci. 108 (2017) 1667–1672. [DOI] [PMC free article] [PubMed] [Google Scholar]
- [21].Wang JB, Abnet CC, Fan JH, Qiao YL, Taylor PR, The randomized Linxian Dysplasia Nutrition Intervention Trial after 26 years of follow-up: no effect of multivitamin supplementation on mortality, JAMA Intern. Med 173 (2013) 1259–1261. [DOI] [PMC free article] [PubMed] [Google Scholar]
- [22].Murphy G, Fan JH, Mark SD, Dawsey SM, Selhub J, Wang J, Abnet CC, et al. , Prospective study of serum cysteine levels and oesophageal and gastric cancers in China, Gut 60 (2011) 618–623. [DOI] [PMC free article] [PubMed] [Google Scholar]
- [23].Wong JY, Shridhar R, Almhanna K, Hoffe SE, Karl RC, Meredith KL, The impact of body mass index on esophageal cancer, Cancer Control 20 (2013) 138–143. [DOI] [PubMed] [Google Scholar]
- [24].Kamachi K, Ozawa S, Hayashi T, Kazuno A, Ito E, Makuuchi H, Impact of body mass index on postoperative complications and long-term survival in patients with esophageal squamous cell cancer, Dis. Esophagus 29 (2016) 229–235. [DOI] [PubMed] [Google Scholar]
- [25].Smith M, Zhou M, Whitlock G, Yang G, Offer A, Hui G, Chen Z, et al. , Esophageal cancer and body mass index: results from a prospective study of 220,000 men in China and a meta-analysis of published studies, Int. J. Cancer 122 (2008) 1604–1610. [DOI] [PubMed] [Google Scholar]
- [26].Ryan AM, Rowley SP, Fitzgerald AP, Ravi N, Reynolds JV, Adenocarcinoma of the oesophagus and gastric cardia: male preponderance in association with obesity, Eur. J. Cancer 42 (2006) 1151–1158. [DOI] [PubMed] [Google Scholar]
- [27].Lindblad M, Rodriguez LA, Lagergren J, Body mass, tobacco and alcohol and risk of esophageal, gastric cardia, and gastric non-cardia adenocarcinoma among men and women in a nested case-control study, Cancer Causes Control 16 (2005) 285–294. [DOI] [PubMed] [Google Scholar]
- [28].Oh SW, Yoon YS, Shin SA, Effects of excess weight on cancer incidences depending on cancer sites and histologic findings among men: Korea National Health Insurance Corporation Study, J. Clin. Oncol 23 (2005) 4742–4754. [DOI] [PubMed] [Google Scholar]
- [29].Icitovic N, Onyebeke LC, Wallenstein S, Dasaro CR, Harrison D, Jiang J, Teitelbaum SL, et al. , The association between body mass index and gastroesophageal reflux disease in the World Trade Center Health Program General Responder Cohort, Am. J. Ind. Med 59 (2016) 761–766. [DOI] [PMC free article] [PubMed] [Google Scholar]
- [30].Chen Y, Liu L, Wang X, Wang J, Yan Z, Cheng J, Li G, et al. , Body mass index and risk of gastric cancer: a meta-analysis of a population with more than ten million from 24 prospective studies, Cancer Epidemiol. Biomarkers Prev 22 (2013) 1395–1408. [DOI] [PubMed] [Google Scholar]
- [31].Sjodahl K, Jia C, Vatten L, Nilsen T, Hveem K, Lagergren J, Body mass and physical activity and risk of gastric cancer in a population-based cohort study in Norway, Cancer Epidemiol. Biomarkers Prev 17 (2008) 135–140. [DOI] [PubMed] [Google Scholar]
- [32].Lauby-Secretan B, Scoccianti C, Loomis D, Grosse Y, Bianchini F, Straif K, Body fatness and cancer–viewpoint of the IARC working group, N. Engl. J. Med 375 (2016) 794–798. [DOI] [PMC free article] [PubMed] [Google Scholar]
- [33].Reeves GK, Pirie K, Reral V, Green J, Spencer E, Bull D, Cancer incidence and mortality in relation to body mass index in the Million Women Study: cohort study, BMJ (Clin. Res. Ed.) 335 (2007) 1134. [DOI] [PMC free article] [PubMed] [Google Scholar]
- [34].Thomas SJ, Aimers L, Schneider J, Graham JE, Havel PJ, Corley DA, Ghrelin and leptin have a complex relationship with risk of Barrett’s esophagus, Dig. Dis. Sci 61 (2016) 70–79. [DOI] [PMC free article] [PubMed] [Google Scholar]
- [35].Rodriguez-Granillo GA, Carrascosa P, Abdominal obesity as a risk predictor: closer than body mass index but not close enough, J. Am. Coll. Cardiol 71 (2018) 1398–1399. [DOI] [PubMed] [Google Scholar]
- [36].Choi JB, Kim JH, Hong SH, Han KD, Ha US, Association of body mass index with bladder cancer risk in men depends on abdominal obesity, World J. Urol 37 (2019) 2393–2400. [DOI] [PubMed] [Google Scholar]
- [37].Parekh N, Lin Y, Vadiveloo M, Hayes RB, Luyao GL, Metabolic dysregulation of the insulin-glucose axis and risk of obesity-related cancers in the Framingham heart study-offspring cohort (1971-2008), Cancer Epidemiol. Biomarkers Prev 22 (2013) 1825–1836. [DOI] [PMC free article] [PubMed] [Google Scholar]
- [38].Hu JX, Thomas CE, Brunak S, Network biology concepts in complex disease comorbidities, Nat. Rev. Genet 17 (2016) 615–629. [DOI] [PubMed] [Google Scholar]
- [39].Pavela G, Is childhood socioeconomic status independently associated with adult BMI after accounting for adult and neighborhood socioeconomic status? PLoS One 12 (2017) eOl68481. [DOI] [PMC free article] [PubMed] [Google Scholar]
- [40].Kuwahara A, Takachi R, Tsubono Y, Sasazuki S, Inoue M, Tsugane S, Socioeconomic status and gastric cancer survival in Japan, Gastric Cancer 13 (2010) 222–230. [DOI] [PubMed] [Google Scholar]
- [41].Dar NA, Shah IA, Bhat GA, Makhdoomi MA, Iqbal B, Rafiq R, Masood A, et al. , Socioeconomic status and esophageal squamous cell carcinoma risk in Kashmir, India, Cancer Sci. 104 (2013) 1231–1236. [DOI] [PMC free article] [PubMed] [Google Scholar]
- [42].Cundiff JM, Uchino BN, Smith TW, Birmingham W, Socioeconomic status and health: education and income are independent and joint predictors of ambulatory blood pressure, J. Behav. Med 38 (2013) 1–8. [DOI] [PubMed] [Google Scholar]
Associated Data
This section collects any data citations, data availability statements, or supplementary materials included in this article.