Abstract
Continuous positive airway pressure (CPAP) therapy is the gold standard treatment for obstructive sleep apnoea, which affects millions of people worldwide. However, this therapy normally results in symptoms such as dryness, sneezing, rhinorrhoea, post-nasal drip, nasal congestion and epistaxis in the upper airways.
Using bronchial epithelial (Calu-3) and nasal epithelial (RPMI 2650) cells in an in vitro respiratory model, this study, for the first time, investigates the effect of CPAP positive pressure on the human respiratory epithelial mechanisms that regulate upper airways lubrication characteristics. To understand how the epithelium and mucus are affected by this therapy, several parameters were determined before and after positive pressure application.
This work demonstrates that the positive pressure not only compresses the cells, but also reduces their permeability and mucus secretion rate, thus drying the airway surface liquid layer and altering the mucus/water ratio. It is also observed that the respiratory epithelia is equally inflamed without or with external humidification during CPAP application.
These findings clearly identify the causes of the side-effects reported by patients under CPAP therapy.
Short abstract
This work demonstrates that CPAP compresses human respiratory epithelial cells, reduces their permeability and mucus secretion rate, dries the airway surface liquid layer, and produces an inflammatory response https://bit.ly/2J4YjOT
Introduction
Noninvasive positive pressure airway ventilation introduces a stream of compressed air into the respiratory system to help keep the airways open. It is administered by a nasal or a facial mask and is also the first choice for providing mechanical ventilation in the intensive care unit to avoid the need for endotracheal intubation [1]. The application of positive airway pressure (PAP) is also used to treat obstructive sleep apnoea (OSA) and chronic obstructive pulmonary disease [2]. Continuous PAP (CPAP) therapy is a mode of respiratory ventilation which uses a portable machine to blow pressurised room air into the upper airways continuously to prevent possible upper airways collapse during an apnoea episode [3]. In addition, the delivery of aerosolised medication, such as a bronchodilator, through ventilation devices is often used for treatment of acute chronic respiratory failure [4, 5]. However, CPAP therapy often results in dryness, sneezing, rhinorrhoea, post-nasal drip, nasal congestion and/or epistaxis in the upper airways [6]. These side-effects may be attributed to the fact that positive pressure may inhibit the natural air conditioning process in the respiratory tract and deform the respiratory epithelium. This could be elicited by an over-evaporation of the airway surface liquid (ASL) water content due to the increase in air volume used to keep the airways open or a blockage of goblet cells or mucus secretion glands due to the effect of the pressure on the airway epithelium. Ultimately, factors associated with CPAP use may disturb the natural mechanism in the respiratory system to restore the ASL layer properties, such as the mucus/water ratio. This study aimed to investigate 1) whether the use of CPAP in an in vitro respiratory epithelial model can cause dryness of ASL, and 2) the effect of CPAP on mucus secretion, permeability and inflammation.
Materials and methods
See material sources in supplementary table S1.
CPAP generation
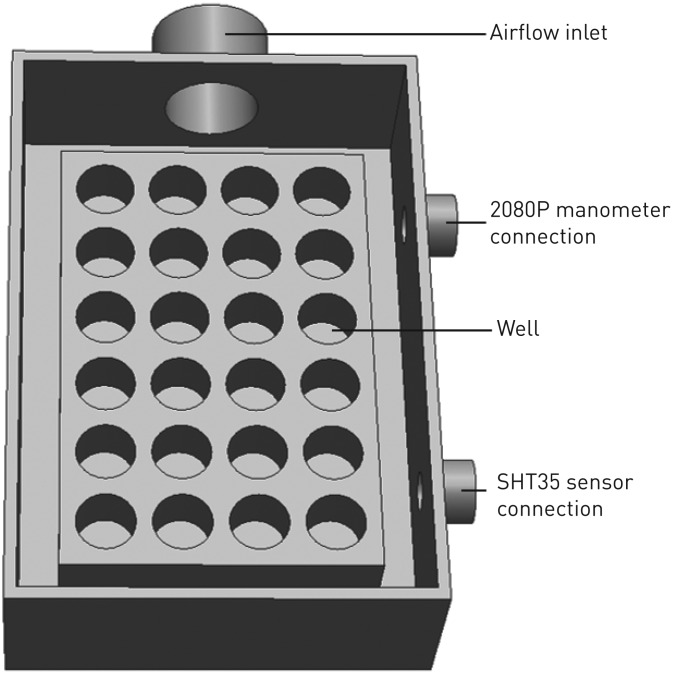
CPAP generation was achieved using the F&P ICON CPAP device (F&P Healthcare, Auckland, New Zealand) connected to an airtight custom-made 600 cm3 cell holder to maintain the desired pressure on the cells as outlined in figure 1. The normal gauge pressure required by OSA patients is in the range of 4–20 cmH2O; hence, 5, 10, 15 and 20 cmH2O pressures were selected for the experiments and were applied between 10 min and 8 h, depending on the experiments. During all experiments, the cell holder setting plus the CPAP device were kept in the incubator at 37°C and 5% CO2. Cells under the same experimental setting with ΔP=0 cmH2O pressure were used as a control. The CPAP humidifier was used to set the air temperature and humidity in each experiment: 30°C and 70% or 100% relative humidity (RH). The environmental conditions were monitored with a SHT35 temperature and humidity sensor (Sensirion, Stäfa, Switzerland) and a 2080P digital manometer (Digitron, Port Talbot, UK). All experiments were performed in triplicate and the CPAP exposure time was adjusted for each experiment.
FIGURE 1.
Sealed airtight custom-made 600 cm3 cell holder, cover not included (not to scale), with one inlet connection to generate positive pressure onto the transwell inserts.
Cell culture
Calu-3 and RPMI 2650 cells (ATCC, Manassas, VA, USA) were grown in Minimum Essential Medium and DMEM/F-12 for each cell line, respectively. Media contained 10% v/v fetal bovine serum, 1% v/v nonessential amino acid solution and 2 mM L-glutamine, according to the manufacturer's protocol. Cells were incubated in a humidified atmosphere of 95% air and 5% CO2 at 37°C. The medium was replaced three times a week and cells were passaged at a ratio of 1/3. To stablish an air–liquid interface (ALI) model, both Calu-3 and RPMI 2650 cells were seeded at a density of 1.65×10⁵ cells per insert on Transwell polyester inserts (Corning Costar, Lowell, MA, USA). For the RPMI 2650 cells, transwells were previously coated with 200 μL 1 μg·mL−1 rat tail collagen solution (Life Technologies, Sydney, Australia) in PBS. After 24 h of seeding cells, the ALI model was established by aspirating the apical medium and the cells were maintained with 0.5 mL culture medium in the basolateral chamber. The ALI conditions stimulated differentiation of the epithelial cells and these were ready for the experiments after 11 days [7, 8].
Cell viability assay
A cell viability assay was performed after CPAP application using Trypan blue exclusion analysis to confirm cells could tolerate the pressure within the experimental times. Cells grown on transwells were exposed to 5, 10, 15 and 20 cmH2O CPAP for 8 h. Subsequently, the cells were rinsed with PBS, detached from the inserts using trypsin (Sigma-Aldrich, Sydney, Australia), centrifuged and suspended in 1 mL medium. A 100 μL Trypan blue (0.4%) and 500 μL cell solution was then added to a centrifuge tube and mixed thoroughly. The solution was allowed to incubate at room temperature for 5 min. Viable and nonviable cells were counted using a haemocytometer. Cells exposed to 0 cmH2O PAP (no pressure applied) were used as a control.
Trans-epithelial electrical resistance
To assess cell layer integrity and permeability, trans-epithelial electrical resistance (TEER) measurements were performed in real-time using an electric cell-substrate impedance sensing (ECIS) system (Applied BioPhysics, Troy, NY, USA). TEER was measured on cells grown on transwells using an 8-well ECIS filter adaptor. The ECIS device was placed inside an incubator at 37°C with 95% RH and 5% CO2. Subsequently, 100 and 800 µL PBS were added to the apical and basolateral chamber, respectively, as electrolyte solution to allow the transmission between the electrodes. Resistance was measured for 1 h before applying the pressure to collect the baseline resistance. Then, apical PBS was aspirated from all inserts and CPAP was applied on the cells inside the incubator. This was followed by the addition of 100 µL PBS to the apical chamber and continual resistance measurement. Data were normalised by subtracting the resistance values from cell-free inserts and multiplied by the surface area of the inserts (0.34 cm2) [9]. Data were analysed using ECIS software. A multifrequency analysis was performed to determine the best frequency to measure the most representative TEER values in each experiment.
Apparent permeability
Fluorescein sodium (Flu-Na) transport across the epithelial layer was conducted in the apical to basolateral direction to assess the barrier integrity and permeability of epithelia cell layers after PAP application. Flu-Na is a paracellular marker, meaning that it only measures paracellular transport across the epithelial cell layer, and hence is a proxy for tight junction strength/integrity. Following CPAP application, 200 μL 2.5 mg·mL−1 Flu-Na solution was added to the apical chamber (donor), while the basal chamber (acceptor) was filled with 600 μL PBS. At pre-determined time-points up to 4 h, 200 μL samples were taken from the basal chamber and replaced with fresh buffer to maintain sink conditions. Fluorescence readings of samples and standards were measured using a black 96-well SpectroMax M2 plate reader (Molecular Devices, San Jose, CA, USA) with excitation/emission wavelengths of 485/520 nm. The calibration coefficient of determination was 0.999, with standards prepared between 1.25 and 0.0125 μg·mL−1. Cells exposed to 0 cmH2O PAP (no pressure applied) were used as a control. The apparent permeability coefficient (Papp) of Flu-Na across the epithelial cell layer was calculated according to a simplified diffusion equation: Papp=(VBasal/AMembrane×CApical)×(dC/dt), where VBasal is the basal volume, AMembrane is the area of the inserts membrane, CApical is the initial Flu-Na concentration and dC/dt is the flux of Flu-Na.
Cell layer thickness
The total cell layer thickness (ycell; epithelial cell layer plus ASL layer), before and after CPAP application, was measured using a Nikon Eclipse Ti time-lapse inverted microscope (Nikon Instruments, New York, NY, USA) in a humidified atmosphere of 95% air and 5% CO2 at 37°C to avoid cell and ASL dryness. Transwell inserts were placed in the microscope and the height (z-axis) from above the insert membrane to the top of the ASL layer was measured by choosing 14 points selected from the cross-sectional surface on the xy-plane.
Pro-inflammatory marker expressions
The expression of cytokine proteins interleukin (IL)-6, IL-8 and tumour necrosis factor (TNF)-α after PAP application was evaluated only in Calu-3 cells since RPMI 2650 cells do not express these pro-inflammatory cytokines [10]. After CPAP application, 200 μL medium was added into the apical part of the transwells and cells were incubated for 2 h at 37°C with 95% RH and 5% CO2. After incubation, 100 μL apical medium was collected and kept at −20°C until cytokine assays were conducted. Cells exposed to 0 cmH2O PAP (no pressure applied) were used as a control. Finally, IL-8, IL-6 and TNF-α markers were measured using ELISA enzyme immunoassay kits (BD Bioscience, Sydney, Australia) according to the manufacturer's protocol.
Mucus glycoproteins staining
Already secreted mucus on the cells was removed by washing three times with HEPES/PBS (50/50) [11, 12]. Then pressure was applied on both cell lines and the amount of secreted mucus was assessed by Alcian blue staining straight after pressure application. Cells were washed twice with 100 μL PBS and fixed using 2.5% w/v glutaraldehyde for 10 min. The cells were washed again with PBS and stained using 100 μL Alcian blue (1% w/v in acetic acid, 3% v/v, pH 2.5) for 1 h. Cells were rinsed multiple times with PBS and air-dried overnight. The filter membrane was cut with a sharp point scalpel, mounted and sealed on glass slides. Images were taken using an Olympus BX60 microscope equipped with an Olympus DP71 camera (Olympus, Tokyo, Japan) and analysed using Image J version 1.42q (https://imagej.nih.gov/ij). A three-dimensional colour space was produced representing the 8-bit red/green/blue (RGB) value of each image. The intensity of blue colour (RGBB ratio) was calculated according to: RGBB ratio=RGBB/(RGBR+RGBG+RGBB), where RGBR, RGBG and RGBB correspond to the intensity of red, green and blue colour, respectively [7]. The mean RGBB ratio of 10 images was used as a semiquantitative indication of the amount of mucus produced.
Statistical analysis
Statistical analysis was performed using Prism version 6.07 for Windows (GraphPad, San Diego, CA, USA) using one-way and two-way ANOVA, followed by Tukey's post hoc analysis for multiple comparisons. Data are presented as mean with standard deviation of three independent experiments.
Results
Cell viability
The cell viability assay showed that applying 5, 10, 15 and 20 cmH2O CPAP for both cell lines did not cause significant cell death. A period of 8 h was chosen as the maximum experimental time considered to avoid bacterial contamination risk and is based on previous literature [11]. The percentage of viable cells after CPAP application was 50.4±0.6% and 45.0±6.1% for Calu-3 and RPMI 2650, respectively. Results showed no significant difference compared with the control (no pressure applied) in both cell lines: 51.2±0.8% and 47.3±5.1% for Calu-3 and RPMI 2650, respectively (data shown in supplementary figure S1).
CPAP application time and cell layer characteristics
To investigate the effect of the CPAP on the cell layer integrity, permeability, thickness and inflammation, a minimum significant pressure application time is desired in order to avoid bacterial contamination risk and avoid mucus secretion which would interfere in the parameter reading. Calu-3 and RPMI 2650 transwells were exposed to 20 cmH2O CPAP (maximum pressure selected) for four different times: 0 min (before pressure application and considered as a control), 10 min, 1 h, 4 h and 8 h, according to previous literature results [11]. The effect of CPAP as a function of time on the cell lines was investigated by measuring TEER at 4000 Hz. The results showed that TEER values increased significantly after 10 min of pressure application compared with the control in both cell lines. However, no significant difference was found in TEER values from 10 min to 8 h of 20 cmH2O CPAP application in both cell lines. Hence, a CPAP application time of 10 min was chosen for the experiments (data shown in supplementary figure S2).
Epithelial cell layer permeability
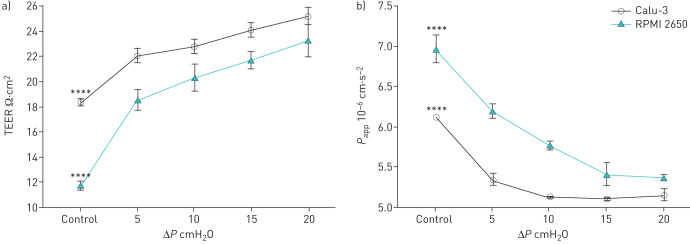
To evaluate cell layer tight junctions after CPAP, electrical permeability was measured using the ECIS apparatus at low frequency (1000 Hz) to allow the current pathway to pass only through the cell junctions [13]. Furthermore, the paracellular permeability was measured by Flu-Na transport. These experiments were performed on both cell lines after 5, 10, 15 and 20 cmH2O CPAP for 10 min and compared with the no pressure controls (figure 2). In both cell models, ECIS results showed a significant increase of TEER values after CPAP application, meaning the electrons have a higher resistance to pass through the cell layer after 10 min of pressure application compared with the control, where no pressure was applied. Also, Flu-Na transport across the cell layer demonstrated a significant decrease of apparent permeability after CPAP application, meaning that both cell layers are less permeable to paracellular markers after 10 min of pressure application compared with the control. These results showed that the pressure applied to the cell layer did not affect cell integrity. Otherwise, if the cell layer was damaged, lower TEER and higher Papp values would be expected compared with the control. This result might indicate that cells were compressed due to the applied pressure as evident by the TEER values being higher and Papp values lower compared with the control in both cell layers.
FIGURE 2.
Epithelial cell layer permeability at control (ΔP=0 cmH2O) and 5, 10, 15 and 20 cmH2O for Calu-3 and RPMI 2650 cells: a) trans-epithelial electrical resistance (TEER) measurements at 1000 Hz and b) apparent permeability coefficient (Papp). Data are presented as mean±sd, n=3. ****: p<0.0001.
Cell layer thickness
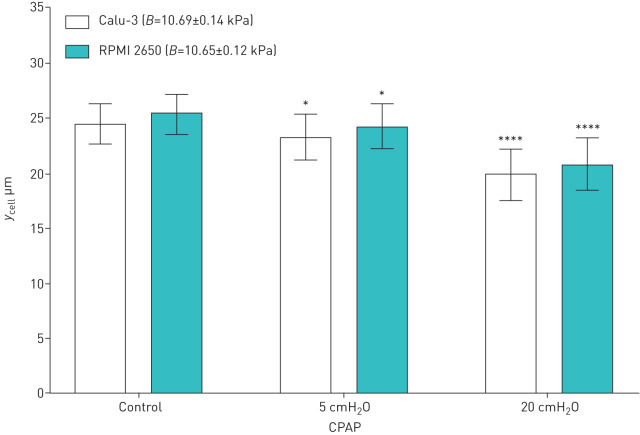
Total cell layer thickness (ycell) before and after 5 and 20 cmH2O CPAP application for 10 min was measured. Results show a significant thickness reduction after both pressure applications, which means that the CPAP is able to compress both cell lines without influencing viability. Both epithelial cell lines can be considered as a compressible elastic material. Hence, the bulk modulus (B), which is a measure of the ability to resist changes in volume under compression (equal to the quotient of the applied pressure divided by the cell thickness reduction), can be calculated for the first time in human epithelial cells. The Calu-3 and RPMI 2650 thickness results and bulk modulus values are shown in figure 3. These results agree with the tracheal respiratory tissue bulk modulus (10.6 kPa) determined in previous studies [14, 15].
FIGURE 3.
Bulk modulus (B) and total epithelial cell thickness (ycell) measured before (control) and after 5 and 20 cmH2O continuous positive airway pressure (CPAP) application for Calu-3 and RPMI 2650 cells. Data are presented as mean±sd, n=3. *: p<0.05; ****: p<0.0001.
ASL layer thickness measurements
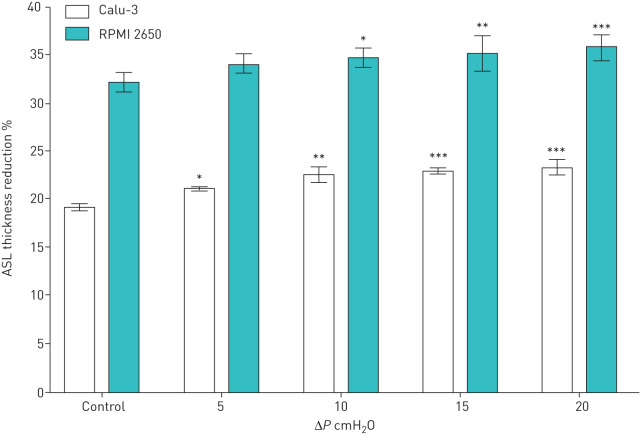
In this study, ASL thickness reduction, water content reduction or dryness after CPAP application was measured for the first time. Using the ECIS apparatus, a medium frequency of 4000 Hz allows the current pathway to pass through both the cell membrane and cell junctions [13]. By definition, the pure electrical resistance is proportional to the distance between the electrodes or the thickness of the conductor material. Hence, the TEER values measured with the ECIS apparatus are proportional to the cell layer thickness, since the cell temperature, the effective area of the transwell semipermeable membrane and the cell layer electrical resistivity are constant in all of the experiments. Two humidity scenarios were simulated to measure the thickness variation of the ASL with the ECIS apparatus after CPAP application at ΔP of 0 (control), 5, 10, 15 and 20 cmH2O for 10 min on both cell lines. The first scenario was a reference measurement where the CPAP humidifier was set to provide a pressurised water saturated airflow at 30°C and 100% RH, while the cells where incubated at 37°C (body temperature) in order to generate a liquid–vapour equilibrium and annul water transfer flow between the ASL and the water saturated CPAP airflow. In the second scenario, the CPAP device and humidifier were set to provide pressurised air at 30°C and 70% RH, while the cells where incubated at 37°C to simulate the natural conditions in the human upper airways [16]. In this case there is no liquid–vapour equilibrium and there will be a water transfer flow from the ASL to the CPAP airflow due to the water gradient concentration. Therefore, the difference between TEER values measured at each ΔP in both scenarios quantifies the water transfer flow from the ASL to the CPAP airflow and consequently ASL thickness reduction, and hence the ASL water content reduction or dryness. The results show a significant ASL thickness reduction that increases with ΔP as shown in figure 4, which proves the occurrence of an over-evaporation of ASL water content.
FIGURE 4.
Airway surface liquid (ASL) thickness reduction between 100% and 70% relative humidity scenarios at control (ΔP=0 cmH2O) and 5, 10, 15 and 20 cmH2O for Calu-3 and RPMI 2650 cells. Data are presented as mean±sd, n=3. *: p<0.05; **: p<0.01; ***: p<0.001.
Inflammation due to the pressure application
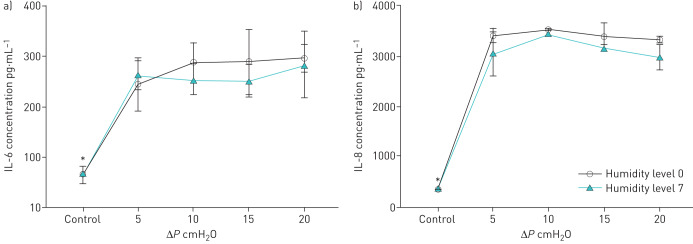
The inflammatory markers IL-6, IL-8 and TNF-α were measured on Calu-3 cells after 5, 10, 15 and 20 cmH2O CPAP application with and without external humidification (humidity level 0 for no humidification and level 7 to provide the maximum humidity) for 10 min and compared with the control at 0 cmH2O. The concentration of IL-6 and IL-8 increased (figure 5) significantly after CPAP application and remained constant independent of the applied pressure values. These results are in agreement with previous studies [17]. TNF-α concentration was not detectable in this experimental setting. However, there was not a significant difference in IL-6 or IL-8 concentrations between both humidity scenarios.
FIGURE 5.
Pro-inflammatory marker concentration on Calu-3 cells at control (ΔP=0 cmH2O) and after ΔP=5, 10, 15 and 20 cmH2O continuous positive airway pressure application for 10 min at humidity level 0 and 7: a) interleukin (IL)-6 and b) IL-8. Data are presented as mean±sd, n=3. *: p<0.05.
Mucus secretion rate
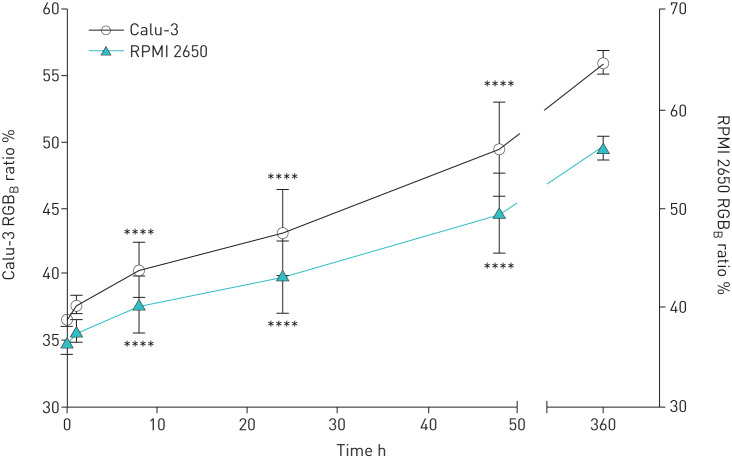
Cell mucus production is a relatively slow physiological process [18]; hence, to investigate the effect of CPAP on mucus production, the mucus secretion rate under normal conditions (0 cmH2O) was quantified. After this, the minimum time to obtain a significant amount of mucus produced was selected to quantify the mucus production under pressure. Calu-3 and RPMI 2650 transwells were washed three times with HEPES to remove the already secreted mucus at time-point 0. The cell surface was stained to quantify the remaining amount of mucus after the washing process. The RGBB value after washing was considered as the absolute minimum amount of mucus. Briefly, Calu-3 cells were incubated at 37°C with 95% RH and 5% CO2 for 1, 8, 24 and 48 h without pressure application and stained with Alcian blue. RGBB values of nonwashed Calu-3 cells were considered as the absolute maximum amount of mucus. The intensity of blue colour (RGBB ratio), which is relative to the amount of mucus at different time-points in both cell lines, is presented in figure 6. The results show that the RGBB ratio values increased linearly as a function of time. The first significant RGBB ratio value was found after 8 h of incubation compared with the control at 0 h in both cell lines. Therefore, 8 h was selected for the mucus production experiment under pressure.
FIGURE 6.
Mucus secretion rate measured with the ratio of blue (RGBB ratio) as a function of time cells at ΔP=0 cmH2O for Calu-3 and RPMI 2650 cells. Data are presented as mean±sd, n=3. ****: p<0.0001.
Mucus production under pressure
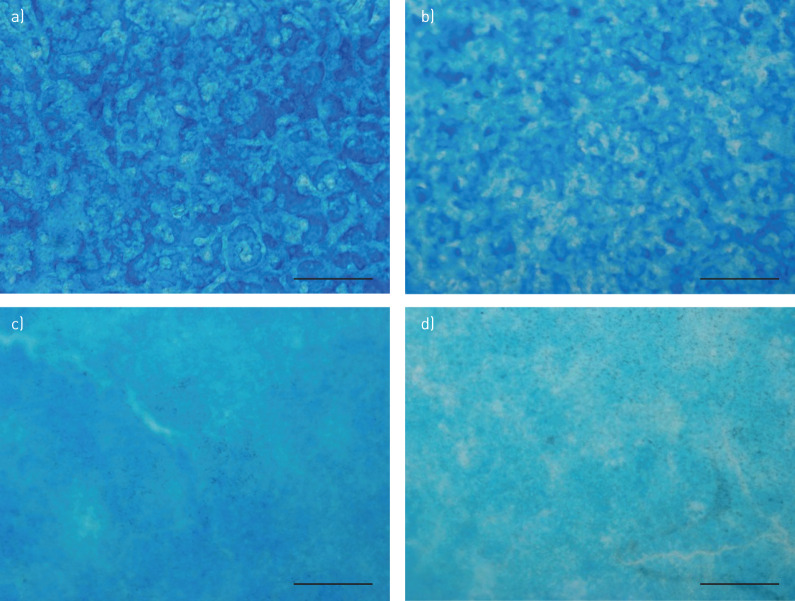
To evaluate the effect of pressure on the mucus production of both epithelial cells, Calu-3 and RPMI 2650 transwells were washed three times with HEPES to remove the already secreted mucus at time-point 0 and incubated at 37°C with 95% RH and 5% CO2. After the mucus was washed away, 0, 5, 10, 15 and 20 cmH2O pressure was applied for 8 h. Then, mucus glycoproteins were stained and the RGBB ratio was calculated to semiquantitatively measure the amount of mucus. Representative microscopic images of mucus stained with Alcian blue from both cell lines after 8 h under 0 cmH2O CPAP (control) and after 8 h under 10 cmH2O CPAP are shown in figure 7.
FIGURE 7.
Microscopic images of mucus stained with Alcian blue. CPAP: continuous positive airway pressure. a) Calu-3 cells stained after 8 h under 0 cmH2O CPAP (control). b) Calu-3 cells stained after 8 h under 10 cmH2O CPAP. c) RPMI 2650 cells stained after 8 h under 0 cmH2O CPAP (control). d) RPMI 2650 cells stained after 8 h under 10 cmH2O CPAP. Scale bar: 500 μm.
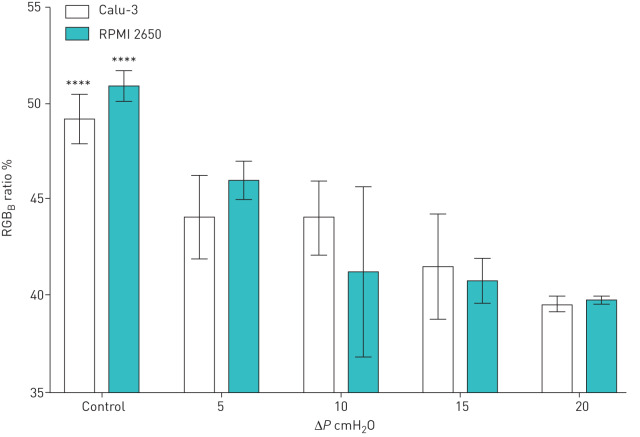
The RGBB ratio percentage as a function of CPAP pressure applied on both cell lines is shown in figure 8. The amount of mucus secreted under pressure was significantly less than the control and was lower as the pressure increased from 5 to 20 cmH2O CPAP in both cell lines.
FIGURE 8.
Mucus production measured with the ratio of blue (RGBB ratio) at control (ΔP=0 cmH2O) and ΔP=5, 10, 15 and 20 cmH2O continuous positive airway pressure for 8 h of Calu-3 and RPMI 2650 cells. Data are presented as mean±sd, n=3. ****: p<0.0001.
Discussion
This study hypothesises that the side-effects (such as dryness, sneezing, rhinorrhoea, post-nasal drip, nasal congestion and/or epistaxis in the upper airways) reported by OSA patients after CPAP therapy are attributed to the fact that the therapy may deform the respiratory epithelium and inhibit the upper airways natural air conditioning process. CPAP generates airflow and positive pressure to keep the airways open. While the former could provoke over-evaporation of ASL water content, the latter may compress the epithelium and block the goblet cells or mucus secretion glands. These will disturb the natural upper airways mechanisms to restore ASL layer properties, such as the mucus/water ratio. To validate the hypothesis, we used in vitro respiratory epithelium to investigate the effect of CPAP on ASL dryness, mucus secretion, cell junction permeability and inflammation response under humidified and nonhumidified CPAP flow.
The viability test demonstrated that both of the in vitro cells lines, i.e. Calu-3 and RPMI 2650, survived the 8 h of pressure application, which is the maximum time an OSA patient can normally use a CPAP device. TEER values, apparent permeability coefficient (Papp) and cell layer thickness have demonstrated that the cell layer was compressed and became less permeable after CPAP application, while cell barrier integrity was not damaged. Figures 2 and 3 confirm the cell compression with the significant reduction in the cell layer thickness after the experiments, which tightened the tight junctions and reduced the paracellular permeability. These results may not be aligned with previous studies where CPAP decreased TEER values and cell viability in Calu-3 cells after 24 and 72 h pressure application [19]. However, in our study, the longest CPAP application was for 8 h, which showed no significant differences in cell viability but higher TEER values compared with controls, indicating tighter tight junctions (compression effect) and no cell layer damage while cells were alive.
The aforementioned compression effect together with the reduction of the cell layer permeability, mucus secretion rate and mucus production under the applied pressure indicate a blockage of the goblet cells or/and the mucus secretion glands due to a possible deformation of the human epithelium. This study has also proven the occurrence of an over-evaporation of ASL water content (drying the in vitro cell layer and consequently the upper airways) due to increase in the CPAP airflow.
Ordinary CPAP therapy uses external humidification to alleviate dryness side-effects, improve the comfort of OSA patients and increase therapy compliance. However, the inflammatory data obtained in this study indicate that increasing the humidity does not affect inflammatory marker concentrations. This implies that Calu-3 cells are equally inflamed without humidification (humidity level 0) as at humidity level 7. Further studies using different humidity, pressure levels and inflammatory markers are required to complete the validation of these results. The obtained data can be used as an indication or an initial step to hypothetically confirm that humidification with CPAP is absolutely necessary to alleviate upper airways dryness, but might not prevent the inflammation induced in the epithelium due to the PAP.
Supplementary material
Please note: supplementary material is not edited by the Editorial Office, and is uploaded as it has been supplied by the author.
Supplementary material 00327-2019.SUPPLEMENT (229.7KB, pdf)
Acknowledgements
The authors acknowledge the Woolcock Institute of Medical Research (Sydney, Australia) for providing facilities.
Footnotes
This article has supplementary material available from openres.ersjournals.com
Conflict of interest: S. Grau-Bartual has nothing to disclose.
Conflict of interest: A.M. Al-Jumaily has nothing to disclose.
Conflict of interest: P.M. Young has nothing to disclose.
Conflict of interest: D. Traini has nothing to disclose.
Conflict of interest: M. Ghadiri has nothing to disclose.
Support statement: The authors acknowledge the Auckland University of Technology (AUT; Auckland, New Zealand) for the Vice Chancellor's Doctoral Scholarship and AUT Institute of Biomedical Technologies for the financial support.
References
- 1.Yu F, Garpestad E, Hill NS. What is the role of noninvasive ventilation in the intensive care unit? In: Deutschman CS, Neligan PJ, eds. Evidence-based Practice of Critical Care. Philadelphia, Elsevier, 2016; pp. 36–42. [Google Scholar]
- 2.Lightowler JV, Wedzicha JA, Elliott MW, et al. Non-invasive positive pressure ventilation to treat respiratory failure resulting from exacerbations of chronic obstructive pulmonary disease: Cochrane Systematic Review and Meta-analysis. BMJ 2003; 326: 185. doi: 10.1136/bmj.326.7382.185 [DOI] [PMC free article] [PubMed] [Google Scholar]
- 3.Chai-Coetzer CL, Pathinathan A, Smith BJ. Continuous positive airway pressure delivery interfaces for obstructive sleep apnoea. Cochrane Database Syst Rev 2005; 2: CD005308. doi: 10.1002/14651858.CD005308 [DOI] [PMC free article] [PubMed] [Google Scholar]
- 4.Dhand R. Aerosol therapy in patients receiving noninvasive positive pressure ventilation. J Aerosol Med Pulm Drug Del 2012; 25: 63–78. doi: 10.1089/jamp.2011.0929 [DOI] [PubMed] [Google Scholar]
- 5.Reychler G, Leal T, Roeseler J, et al. Effect of continuous positive airway pressure combined to nebulization on lung deposition measured by urinary excretion of amikacin. Respir Med 2007; 101: 2051–2055. doi: 10.1016/j.rmed.2007.06.003 [DOI] [PubMed] [Google Scholar]
- 6.Malik NW, Kenyon GS. Changes in the nasal airway mucosa and in nasal symptoms following continuous positive airway pressure (N-CPAP) for obstructive sleep apnea. Aust J Otolaryngol 2004; 7: 17–20. [Google Scholar]
- 7.Haghi M, Young PM, Traini D, et al. Time- and passage-dependent characteristics of a Calu-3 respiratory epithelial cell model. Drug Dev Ind Pharm 2010; 36: 1207–1214. doi: 10.3109/03639041003695113 [DOI] [PubMed] [Google Scholar]
- 8.Pozzoli M, Ong HX, Morgan L, et al. Application of RPMI 2650 nasal cell model to a 3D printed apparatus for the testing of drug deposition and permeation of nasal products. Eur J Pharm Biopharm 2016; 107: 223–233. doi: 10.1016/j.ejpb.2016.07.010 [DOI] [PubMed] [Google Scholar]
- 9.Wegener J, Hakvoort A, Galla H-J. Barrier function of porcine choroid plexus epithelial cells is modulated by cAMP-dependent pathways in vitro. Brain Res 2000; 853: 115–124. doi: 10.1016/S0006-8993(99)02317-3 [DOI] [PubMed] [Google Scholar]
- 10.Berger JT, Voynow JA, Peters KW, et al. Respiratory carcinoma cell lines. Am J Respir Cell Mol Biol 1999; 20: 500–510. 10.1165/ajrcmb.20.3.3383. [DOI] [PubMed] [Google Scholar]
- 11.Even-Tzur N, Kloog Y, Wolf M, et al. Mucus secretion and cytoskeletal modifications in cultured nasal epithelial cells exposed to wall shear stresses. Biophys J 2008; 95: 2998–3008. doi: 10.1529/biophysj.107.127142 [DOI] [PMC free article] [PubMed] [Google Scholar]
- 12.Lo C-M, Keese CR, Giaever I. Cell–substrate contact: another factor may influence transepithelial electrical resistance of cell layers cultured on permeable filters. Exp Cell Res 1999; 250: 576–580. doi: 10.1006/excr.1999.4538 [DOI] [PubMed] [Google Scholar]
- 13.Kreda SM, Okada SF, van Heusden CA, et al. Coordinated release of nucleotides and mucin from human airway epithelial Calu-3 cells. J Physiol 2007; 584: 245–259. doi: 10.1113/jphysiol.2007.139840 [DOI] [PMC free article] [PubMed] [Google Scholar]
- 14.Miller TL, Altman AR, Tsuda T, et al. An ultrasound imaging method for in vivo tracheal bulk and Young's moduli of elasticity. J Biomech 2007; 40: 1615–1621. doi: 10.1016/j.jbiomech.2006.07.022 [DOI] [PubMed] [Google Scholar]
- 15.Wang J-Y, Mesquida P, Pallai P, et al. Dynamic properties of human bronchial airway tissues. Arxiv 2011; preprint [https://arxiv.org/abs/1111.5645].
- 16.Hanna LM, Scherer PW. A theoretical model of localized heat and water vapor transport in the human respiratory tract. J Biomech Eng 1986; 108: 19–27. doi: 10.1115/1.3138574 [DOI] [PubMed] [Google Scholar]
- 17.Mohammed DA, Sapsford JR, Wedzicha AJ, et al. Dose response of continuous positive airway pressure on nasal symptoms, obstruction and inflammation in vivo and in vitro. Eur Respir J 2012; 40: 1180–1190. doi: 10.1183/09031936.00199911 [DOI] [PubMed] [Google Scholar]
- 18.Dong W, Matsuno Y-k, Kameyama A. A procedure for Alcian blue staining of mucins on polyvinylidene difluoride membranes. Anal Chem 2012; 84: 8461–8466. doi: 10.1021/ac301678z [DOI] [PubMed] [Google Scholar]
- 19.Zhu Y, Chidekel A, Shaffer TH. Cultured human airway epithelial cells (Calu-3): a model of human respiratory function, structure, and inflammatory responses. Crit Care Res Pract 2010; 10: 1155–1163. doi: 10.1155/2010/394578 [DOI] [PMC free article] [PubMed] [Google Scholar]
Associated Data
This section collects any data citations, data availability statements, or supplementary materials included in this article.
Supplementary Materials
Please note: supplementary material is not edited by the Editorial Office, and is uploaded as it has been supplied by the author.
Supplementary material 00327-2019.SUPPLEMENT (229.7KB, pdf)


