

Abstract
Passive interception of fog from the wind is an effective solution for accessing water in regions where fog is frequent and other sources scarce. A Namib Desert beetle is often cited as bioinspiration for further advancement, in a narrative which focuses on patterned wettability of its bumpy elytra as a means of transporting accumulated water from its back to its mouth. However, surface transport in fog collection is secondary to the role of the fluid dynamics of droplet deposition, in which inertial droplets migrate across diverging streamlines approaching an obstruction. 3D geometry of biological surface features inevitably affect this process, but its specific role in flow physics of fog collection has not previously been explored. Here, we report experimental measurements of deposition efficiency of targets with identical surface chemistry but varying surface morphology. We find a nearly threefold increase in collection upon addition of millimetric bumps to a spherical target, and provide insight into the micromechanics underlying the performance. Modifying surface morphology can be easier than overall geometry for both manufactured structures and evolved organisms and should therefore be both considered in the design of separation devices and expected in other biological systems for which extraction of particles from flow is important.
Keywords: water harvesting, bioinspiration, fluid dynamics
1. Introduction
Three years ago, it was reported that two thirds of the world’s population face severe water scarcity for at least one month of the year [1]. The threat is only expected to increase as effects of climate change are compounded by the growing population. Potential technological solutions to this global problem necessarily vary with specific conditions of different geographical regions, ranging from preserving and treating available sources to acquiring new ones. Where water supply has been exhausted and precipitation is inadequate, or when a population is displaced to an area lacking water infrastructure, the possibility of extracting water from the atmosphere becomes appealing.
In some regions, particularly mountain deserts of western coastal margins, rain might not fall for months or even years, yet foggy days occur frequently [2–4]. A human could still die of thirst on such a day, surrounded by a sea of potable water droplets, for want of a means of physically collecting and swallowing them—a variant of the frustrating dilemma of the ancient mariner: ‘Water, water, everywhere/Nor any [big enough] drop to drink’.
Plants and animals in such regions have evolved their own strategies to intercept fog droplets from the surrounding air, and direct it to their roots and mouths. Development of the first practical fog interceptors [5] was partly informed by contemporaneous studies of fog drip by vegetation [6–8], and successful designs use mesh geometries—filaments with regular spacing—not unlike the slender leaves and grasses cited by them.
The overall efficiency of a typical fog mesh can be expressed as the product of three terms, which serve to outline the basic considerations underlying passive, wind-driven fog collection [9]:
| 1.1 |
where ηA, ηD and ηDr are aerodynamic, deposition and drainage efficiencies, respectively .
Aerodynamic efficiency, ηA, represents the portion of the unperturbed flow that passes through the collector to find a collision course with collector elements. It is maximized by balancing competing interests of increasing target area for interception and increasing resistance of the whole structure, thus diverting more flow around it. Deposition efficiency, ηD, is defined as the fraction of the droplets which migrate across the streamlines and collide with the mesh, of those initially headed toward any individual target element. ηD can be expressed in terms of the Stokes number St, which measures the relative importance of a droplet’s inertia compared to the viscous drag exerted on it by the surrounding fluid. St for a droplet of diameter ddroplet approaching a smooth target of diameter D can be expressed [10–12]:
| 1.2 |
where tdroplet and tflow are response time of the droplet and the flow and Re is the Reynolds number of flow around the target element (Re = (ρair UD)/(μair)). For realistic flow regimes and fog-mesh scales (millimetre-scale pore size, target fibre of radius ), the ηD can be approximated [11–13]:
| 1.3 |
These expressions confirm some basic intuitive points: that bigger droplets carried by faster wind are more susceptible to collision, and that a slender target is more effective (per unit area) in intercepting fog, as it disturbs upstream flow less. The above formulation has been used to optimize fog mesh geometry by fibre diameter and spacing [12]. Drainage efficiency, ηDr, plays a more convoluted role. If the collected water does not easily flow from the mesh to a reservoir, it can clog, reducing ηA, cause deposited and coalesced drops to re-entrain with the wind, or evaporate from its surface as the ambient conditions change. Importantly, ηA and ηD are determined by flow considerations, and can be tuned by shape and scale of the target. ηDr, on the other hand, depends on wettability in conjunction with more specific details of the application.
It has long been known that some beetles in the Namib Desert climb to the top of sand dunes and lean into the early morning sea breeze to intercept fog with their bodies [14,15]. Obvious physiological constraints unrelated to water capture prevent a beetle from adopting a mesh-like geometry. Put in terms above, as a non-porous, roughly spheroid shape, ηA = 1, and ηD is minimized for its volume. The beetle’s larger diameter increases Re of the flow while decreasing the effective St → ∼10−3 − 10−2 in realistic fog-basking conditions, driving down ηD.1 At first pass, the beetle body would appear ill-suited for fog interception, but the premise that some physical adaptation would accompany the evolved fog basking behaviour remains compelling.
A recent surge of interest in beetle-mimetic fog harvesting followed an interpretation of a certain species’ bumpy elytra as physical adaptation to promote collection [16]. The story portrays the bumps’ significance in terms of wettability: as hydrophilic patches2 upon a hydrophobic background. This situation was supposed to facilitate transport of water from elytra to mouth while inhibiting reintrainment into the wind—effectively an adaptation to increase ηDr. Subsequent literature in biomimetic fog collection is dominated by studies of performance of surfaces with variously patterned wettability [17–22], without reference to flow conditions or macroscopic geometry. The results have varied, and a clear trend associating wettability with performance is conspicuously absent [23], suggesting that the dominant physical mechanism was overlooked. The idea that beetles possess an adaptation to promote condensation of vapour has also been explored [24,25], but we will simply consider it a separate question.
We instead revisit the premise of elytra morphology as fog collecting adaptation, by asking how three-dimensional shape of millimetric features on the elytra surface encourage droplet collision by influencing air flow around the beetle. We directly measure ηD as a function of surface morphology with simplified analogues in controlled flow conditions, experimentally isolating the process of droplet impaction from those of transport in a table-top apparatus designed specifically for this purpose.
Our experimental design aims to: (i) isolate impaction efficiency from confounding effects of surface transport; (ii) isolate surface morphology as single varying parameter between measurements; (iii) maintain simple flow conditions; and (iv) obtain robust average values for unambiguous comparison. To these ends, a custom wind tunnel was constructed through which fog could be directed through the centre of the test section, as shown in figure 1a. Control of flow, actuation of fog generators, and data acquisition were simultaneously managed by a microcontroller (Arduino Uno).
Figure 1.

(a) Schematic diagram of the table-top wind tunnel used for controlled fog collection experiments. A fog chamber is equipped with an array of nebulizers for making fog and an adjustable cover to regulate fog stream resistance. A DC fan installed at the down-wind end pulls alternating dry and fog-laden air through the tunnel. A sensitive load cell connected to the target measures the accumulated mass on its surface due to fog interception. Measured weight of a target is plotted over time. Yellow-shaded regions indicate fog generators in operation. (b) Over-sampled data from load cell with vibrational noise over several fogging cycles. (c) Moving window average reveals clean signal with robust trend. (d) A linear fit of a single fogging period; the slope corresponds to the water accumulation rate.
3D printed targets with identical surface chemistry but various morphology were hung in the centre of the test section from a high-precision load cell to measure the added mass as droplets collided and stuck to the target surface. Basic motifs—bumps, dimples, ridges of 1 mm diameter with ∼(2π/3) mm centre-to-centre spacing were added to smooth spheres with 40 mm diameter. High-frequency noise from the wind and vibrations was eliminated by using a simple moving window average (figure 1b,c). To prevent conflating effects of transport of water on the surface, fog was delivered for brief durations (4 min, highlighted periods in figure 1b–d), before significant coalescence or dripping could occur. Wind remained continuous between the fogging intervals while the target dried and reset to initial surface conditions. Automated cycles of fogging and drying were repeated for approximately 40 times and a constant wind speed of approximately 2 m s−1 was used for all experiments.
Figure 1d shows the weight change during one interval of fog deposition. A linear fit gives the deposition rate , which is then used to calculate the deposition efficiency: where ρf is the mass density of fog (calculated from the rate of mass lost from the reservoir) and A is the cross-sectional area of the target.
2. Results
The resulting deposition efficiencies of spherical targets with various millimetric surface features are shown in figure 2a. Results for all spheres are predictably very poor compared to a fibre mesh ( for Raschell mesh [12] versus for a smooth sphere, for which St < 0.05). Significantly increasing the wettability of the surface by adding a commercial hydrophilic coating (‘uncoated’ : θE ∼ 66° → ‘coated’ : θE ∼ 13°; see electronic supplementary material) has no significant affect on the deposition efficiency, consistent with ref. [23]. By contrast, the introduction of geometric features significantly increases the deposition efficiency. In particular, addition of bumps of 1 mm diameter and with approximately 2 mm centre-to-centre spacing increased the deposition efficiency to 0.35%, or three times that of the initial smooth target. The enhancement is not simply due to the increase in surface area. For comparison, a smooth target with slightly increased radius to match the approximately 18% greater surface, as well as a similarly dimpled target were tested under identical conditions. The deposition efficiency for both smooth spheres was similar, which is consistent with the underlying fluid dynamic role of the geometries: the approximately 9% increase in the diameter makes little difference in efficiency, as neither Reynolds number nor Stokes number significantly changes. A dimpled sphere with the same surface area as the bumpy sphere gave an efficiency also close to that of the smooth target. Ridges were tested in parallel and perpendicular orientations with respect to the wind. Perpendicular ridges produced better fog capturing performance—more than doubling the efficiency comparing to the smooth target, while parallel orientation showed somewhat less performance.
Figure 2.

Deposition efficiencies of targets (40 mm diameter) with different surface features. (All features are 1 mm diameter with ∼(2π/3) mm centre-to-centre spacing.) Each data point represents deposition efficiency measured in a fogging cycle. The same wind speed (2 m s−1) and incident fog conditions were imposed during all tests. The bumpy target resembles features on the elytra of a (b) Stenocara gracilipes, while the target with parallel ridges is close to (c) Onymacris unguicularis, the fog basking beetle. (b,c) SEM images of the features on the fore-wings of beetles from ref. [26]. Scale bar, 1 mm.
These results unambiguously demonstrate that beetle-like surface morphologies affect collection via flow dynamics, rather than wettability, but do not speak to a specific mechanism to explain performance. A first guess might attribute the effect to a change in the nature of the boundary layer: at a critical flow speed (, depending on roughness), bumps or depressions on a sphere will cause the boundary layer to transition from laminar to turbulent [27] (such as in a golf ball in flight), delaying flow separation, suppressing wake size, ultimately reducing aerodynamic drag. Because the transition changes the flow field, it should, in principle, affect impaction. However, as our flow conditions are all below the transition (Re ∼ 5000), and because we see that separation point in bumpy and smooth cases appears unchanged (see electronic supplementary material, movie S1), we conclude that the observed change in performance is not related to boundary layer transition.
To see how feature distribution affects efficiency, we varied the packing density of bumps in two ways3: (a) keeping the bump diameter the same while increase the number, or (b) keeping the number the same while increase the diameter. The resulting effect on efficiency is shown in figure 3b. As a function of packing density—bump diameter divided by centre-to-centre spacing DBump/S, both display two distinct regimes: one in which efficiency roughly linearly increases with density, and then drops after a critical value DBump/S ∼ 0.6. The initial linear climb is consistent with a model in which bumps independently intercept droplets, while the drop suggests overcrowding causes the boundary layers to begin to communicate and inhibit flow close to the surface (effectively a drop in aerodynamic efficiency ηA).
Figure 3.
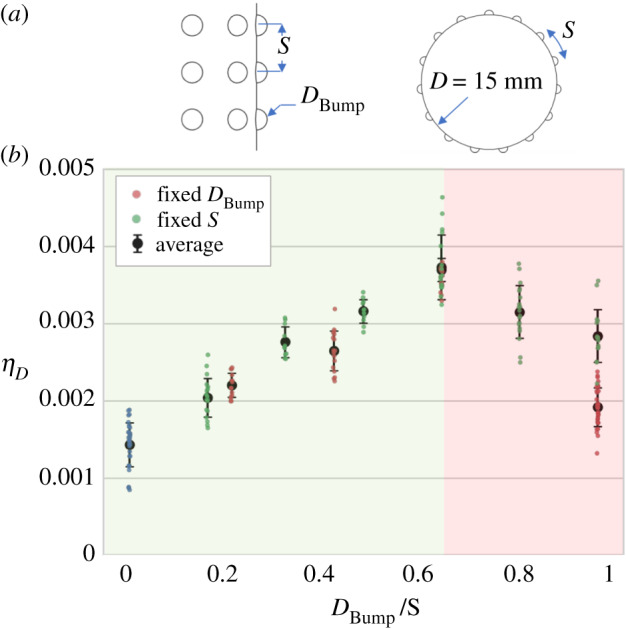
(a) Illustration of bumpy cylindrical targets (side view and cross-sectional view). S: spacing between bumps; DBump: diameter of bumps; D: diameter of cylinder. (b) Deposition efficiencies of targets as a function of packing density of bumps. Deposition efficiency of cylinders with fixed bump diameter (1 mm), while changing the spacing between them (red points) and targets with fixed spacing between bumps (centre-to-centre spacing of πmm) and varying bump diameters (green points). DBump/S = 1 corresponds to the point when bumps start touching. DBump/S = 0 represents smooth cylinder (blue points). The green area indicates the region where bumps intercept with the flow individually, whereas the red region corresponds to the high bump packing densities, where overlap in boundary layers occur. An optimum packing density can be found in both cases.
In all cases, most accumulation occurs near the stagnation point of the target, since streamline curvature is greatest near the centreline of the flow. Obviously, addition of surface features on the leeward side are not effective, but how the benefit decreases with angle from centre was measured to better understand the mechanism. Are gains made primarily by peripheral features intercepting faster droplets farther from the centreline, or by further increasing the collection near the stagnation point? Spherical targets with bumps localized at specific angles from the stagnation point (ϕ) were manufactured, keeping the distance between bumps at a constant ∼(2π/3) mm. Figure 4 shows a trend in which the ratio of deposition efficiency to that of the smooth target decreases with ϕ, from a maximum toward ϕ = 0. That the number of added bumps increases with ϕ further emphasizes the value of adding features to the region of highest impaction near the centre. A similar lesson seems to apply on the scale of individual bumps. While one could expect circulation generated behind an obstructing bump to cause an increase in impaction, we observe that accumulation occurs only on windward side (see electronic supplementary material, movies S2 and S3). Drastic reduction of the velocity and therefore St number of the droplets in the circulation zone can explain the lower probability of the collection behind the bumps, suggesting that direct impaction, rather than circulation, plays the dominant role.
Figure 4.

Deposition efficiency of targets with bumps at specific angles from the stagnation point (ϕ) are compared to the average deposition efficiency of a smooth sphere 〈ηD,S〉.
3. Discussion
It should not be surprising that wettability alone does not drive efficiency of fog collection. In condensing vapour on a cooled surface, drainage is essential to avoid thermal insulation from a liquid film. But in collection of wind-blown fog droplets, accumulation is primarily dependent on target geometry and the shape of the flow field. Our results show that, while beetle-like bluff body geometry does not make for an ideal fog collector, slight modification of its surface morphology can dramatically increase its performance by increasing direct interception. As an economical trade-off between shape and water security, the mechanism is a likely driver of physical adaptation in fog basking organisms, as well as an implementable principle in modifying existing structures for passive water harvesting function, where modifying surface wetting considered in other studies would involve higher expense and toxicity.
The Namib Desert has a large variety of Tenebrionidae, or darkling, beetles. Few of these beetles fog bask, and only eight species show specialized, behavioural adaptations to collecting fog [28]. Notably, of the two prominently bumpy beetles associated with the patterned wettability narrative, and most resembling the high performing synthetic analogues of figure 2: Stenocara gracilipes, and Physosterna cribripes,4 neither are known to fog bask [26,29]. One bonafide fog basker, Onymacris unguicularis [14], instead features subtle ridges parallel to the flow of wind when in basking pose [26], as shown in figure 2c. According to our results, this configuration should be far from ideal, but it is plausible that our artificial analogue oversimplifies its solution.
In individual droplet trajectories we see that hydrodynamic interactions between droplet and surface play an important role at distances close to the droplet diameter, as droplets ‘slide’ along contours of the target without making contact. At this stage, surface features could conceivably channel, concentrate, and direct droplets to targets for interception elsewhere along the surface (e.g. tiny, sharp protrusions toward the bottom of figure 2c) while providing a smooth, directed path for drainage with little contact line pinning. Closer examination of the near-field collision dynamics [30] at very low St and of the geometry of natural specimens would lead to better understanding of this possibility.
The efficacy of fog interception by surface modification apparently underlies behavioural adaptations in other species in the Namib Desert. Lepidochora, a flat, circular, short-legged beetle, does not fog bask, but rather builds a rudimentary fog collector from its surroundings. These beetles dig trenches centimetres wide, 2–4 mm deep, on the sand dunes (figure 5a), reliably perpendicular to the direction of the wind, before the morning fog. Droplets separated by the modified morphology of the dune surface collect in the trench, to which the beetle returns to drink afterward [31].
Figure 5.

(a) Species of Lepidochora modify the surface morphology of the dune itself, by carving trenches perpendicular to flow, inducing collection of wind-blown fog, and drink the accumulated water from the sand [31]. (b) Accumulation of pollen on female pine cones via direct impaction is similarly increased due to the geometry of structures on its surface [32].
Recent studies have looked at mechanical mechanisms by which plants and fungi propel their pollen or spores out of the boundary layer into the free stream for propagation. The inverse problem in wind-pollinating plants—how the female stigma captures the tens of micrometre pollen particles from the passing air has been explored less. Geometry of these structures varies, but its goal is the same. Where the fibrous corn styles, or tassels, maximize St by their slenderness in order to intercept wind-blown pollen, the female pine cone achieves the same with a round geometry and pronounced surface topography [32] (figure 5b). Corresponding morphological adaptations exist in other biological systems where particulate separation is necessary for survival, such as suspension feeding in aquatic life [33].
A fog mesh is a 2D structure to intercept flow—it is minimal in terms of material cost, and optimizable for efficiency. A surface is cheaper if you already have a surface. Then, subtle surface morphology manipulation can be effective, simpler and less toxic than manipulating wetting properties, as some bioinspired alternatives propose. It can be applied in the manufacture of specifically fog-collecting structures, but also in giving existing structures additional fog collecting function.
4. Methods
4.1. Apparatus
Aerosol droplets of average diameter approximately 3.3 μm were generated upstream in a chamber using ultrasonic nebulizers submersed in DI water (figure 1a). To ensure a consistent rate of droplet production and size distribution, constant water level above the nebulizers was regulated by closed-loop control between a pressure sensor and solenoid valve which replenishes water to a pressure set point. Fog generated in the chamber is then delivered to the target through a funnel and a straight tube. To create uniform flow and smooth fog column in the test section, without artefacts of fog generation or its introduction into the flow, it was necessary to match the flow speed between fog outlet and surrounding air. To this end, common suction from the DC fan pulled air from both sources, and total resistance along both paths was set equal. Resistance of the fog pathway was tuned by varying the opening of fog chamber to match that of the free stream, which was limited by a mesh installed at the opening of the wind tunnel. Additionally, the wall of the tube used to direct fog toward the target was of minimal thickness (approx. 0.7 mm) to reduce downstream disturbances. Area contraction ratio from the opening of the tunnel to test section is 4 : 1 (linear ratio 2 : 1). For all reported measurements, the flow speed was approximately 2 m s−1 (1.93 ± 0.09 m s−1). A characteristic velocity profile of the cross section is shown in electronic supplementary material, figure S1. The fog-collecting target is connected to the sensitive load cell (FUTEK LSB200, precision 0.01 g) via a stainless-steel rod and is positioned at the centre of the constant cross-section test section. The rod is also supported from the leeward side by a Teflon rod (electronic supplementary material, figure S2b) to cancel torque from drag. Occasional variations in the load cell output signal due to temperature fluctuations in the laboratory were eliminated by recording only data for which the monitored laboratory temperature was constant, between 20.5°C and 21.5°C.
4.2. Droplet size measurement
Diameter of droplets generated by the nebulizers (OT-SMG02, DC24V, 500 mA) were measured by intercepting them on microscopic, electrospun polymer fibres and conventionally imaging them. Cellulose acetate (CA) was chosen due to its high mechanical strength and low water absorption properties. A solution of CA (12 wt%) was prepared in a binary solvent mixture of DMAc/acetone (1 : 2; w/w). Fibres were then spun on a custom vertical set-up with a flow rate of 0.5 ml h−1 and 12 kV between the needle (21 G) and a fork-shaped collector 15 cm away. The collected fibres were positioned in front of a high-speed camera (Phantom VEO 410, lens InfiniProbe TS-160) at the outlet of the fog chamber with the same conditions as the experiments (figure 6a,b). The fibres used for measurements were then collected on a scanning electron microscopy stub and the sizes of the fibres were measured using SEM JEOL-7401 (0.87 ± 0.14 μm, figure 6c). The Stokes number for micro-droplets colliding with these fibres, for the given conditions, according to equation (1.2) would be greater than 100. In this case, ηD = (St/((π/2) + St)) ∼ 1 indicating that most of the drops headed toward the projected area of the fibres were collected, regardless of their size. Video was taken as droplets collided with the fibres. Diameters were measured in ImageJ immediately after impact (figure 6d), before evaporation or absorption could occur. The average diameter of the droplets was measured as approximately 3.3 μm.
Figure 6.

Drop size measurement. (a) Schematic of fog droplet diameter measurement. (b) Droplets immediately after impact with electrospun fibres. (c) SEM image of the fibres used for measurements. (d) Drop size distribution showing number averaged diameter ∼3 μm. (inset) Weight distribution of droplets is centred around .
4.3. Targets
Spherical and cylindrical targets (electronic supplementary material, figure S4), were printed using a stereolithography 3D printer (Formlabs Form2). One type of resin was used (Formlabs GREY V4FLGPGR04) to maintain identical chemistry and wetting properties of all targets (static contact angle θE ∼ 66°, measured on a flat surface). Bumps, dimples, ridges of 1 mm diameter with ∼(2π/3) mm centre-to-centre spacing were added to smooth spheres with 40 mm diameter. Bump packing density in cylindrical target of 15 mm diameter was varied in two different ways. First, the spacing between the bumps was fixed at πmm and the bump diameter was varied from 0.5 to 3 mm (electronic supplementary material, figure S3b). In a second scenario the bump diameter was kept constant at 1 mm and the spacing between the bumps was changed (electronic supplementary material, figure S3c). A commercial anti-fogging solution (Splaqua anti-fog formula) was used to coat the 3D-printed smooth sphere to alter the surface energy. The static contact angle was measured on a flat surface as θe ∼ 13° (see electronic supplementary material, figures S4 and S5).
4.4. Data analysis
Experiments were repeated in cycles of fogging and drying (4 and 20 min respectively) to obtain robust statistics. This frequency (6.9 × 10⁻⁴ Hz) is much longer than vibrational and flow fluctuation noise and much shorter than that of the drift of the load cell (for Fourier transform see electronic supplementary material, figure S6). To achieve a desirable level of noise reduction, the raw measured data (figure 1b) was averaged every 5 s (200 data points, sampling frequency = 40 Hz). As shown in figure 1c, a weight change representing fog deposition and drying can be identified. Data corresponding to the fogging period are then isolated and fit with a linear function (figure 1d). The slope of this fitted line is then used to describe the deposition rate of the collectors. The deposition efficiency is defined as the averaged deposition rates divided by the mass of the water droplets that initially were headed toward the projected area of the collector per second.
Supplementary Material
Supplementary Material
Supplementary Material
Supplementary Material
Acknowledgements
We thank A. Concha, F. Chan, M. Gazzola and S. Ocko for useful discussions; M. Salcedo for help with early testing.
Endnotes
In fact, analysis by ref. [11] predicts a critical Stc = 1/8 for cylinders and Stc = 1/12 for spheres, below which ηD = 0.
It is worth noting that hydrophilicity does not imply any long-range attraction on a water droplet such as to influence its trajectory, and therefore ηD.
Here, we switch to cylindrical geometry in order to maintain a consistent pattern of bumps.
Data accessibility
The data presented in this work are available upon request. Code for the analysis described in the data analysis section and other analyses presented in this paper are available upon request.
Authors' contributions
H.K. conceived of the study. J.F. and A.S. designed and built apparatus, performed experiments and analysed data. All authors contributed to writing and approving the final manuscript.
Competing interests
We declare we have no competing interest.
Funding
H.K. acknowledges the University of Akron for research start-up support.
References
- 1.Mekonnen MM, Hoekstra AY. 2016. Four billion people facing severe water scarcity. Sci. Adv. 2, e1500323 ( 10.1126/sciadv.1500323) [DOI] [PMC free article] [PubMed] [Google Scholar]
- 2.Pajares P, Eckert S, Berrahmouni N, Kohler T, Maselli D, Zelaya S. 2011 Highlands and drylands: mountains, a source of resilience in arid regions. Food and Agriculture Organization of the United Nations (FAO). See http://www.fao.org/3/i2248e/i2248e00.pdf .
- 3.Schemenauer RS, Fuenzalida H, Cereceda P. 1988. A neglected water resource: the camanchaca of South America. Bull. Am. Meteorol. Soc. 69, 138–147. ( 10.1175/1520-0477(1988)069<0138:ANWRTC>2.0.CO;2) [DOI] [Google Scholar]
- 4.Nef J. 2001 Assessment of the state of the fog-collecting project in Chungungo, Chile. University of Guelph, Guelph, ON, CA. See https://idl-bnc-idrc.dspacedirect.org/bitstream/handle/10625/25941/118215.pdf?sequence=1 .
- 5.Schemenauer RS, Cereceda P, Carvajal N. 1987. Measurements of fog water deposition and their relationships to terrain features. J. Clim. Appl. Meteorol. 26, 1285–1291. ( 10.1175/1520-0450(1987)026<1285:MOFWDA>2.0.CO;2) [DOI] [Google Scholar]
- 6.Ekern PC. 1964. Direct interception of cloud water on Lanaihale, Hawaii. Soil Sci. Soc. Am. J. 28, 419–421. ( 10.2136/sssaj1964.03615995002800030035x) [DOI] [Google Scholar]
- 7.Merriam RA. 1973. Fog drip from artificial leaves in a fog wind tunnel. Water Resour. Res. 9, 1591–1598. ( 10.1029/WR009i006p01591) [DOI] [Google Scholar]
- 8.Azevedo J, Morgan DL. 1974. Fog precipitation in coastal California forests. Ecology 55, 1135–1141. ( 10.2307/1940364) [DOI] [Google Scholar]
- 9.Rivera JD. 2011. Aerodynamic collection efficiency of fog water collectors. Atmos. Res. 102, 335–342. ( 10.1016/j.atmosres.2011.08.005) [DOI] [Google Scholar]
- 10.Strauss W. 1975. Industrial gas cleaning: the principles and practice of the control of gaseous and particulate emissions, vol. 8 Elmsford, NY: Pergamon. [Google Scholar]
- 11.Langmuir I, Blodgett K. 1946. A mathematical investigation of water droplet trajectories. Army Air Forces Headquarters, Air Technical Service Command; Distributed by Office of the Publication Board, Dept. of Commerce. See https://books.google.com/books?id=Gxukx5b1xcsC.
- 12.Park K-C, Chhatre SS, Srinivasan S, Cohen RE, McKinley GH. 2013. Optimal design of permeable fiber network structures for fog harvesting. Langmuir 29, 13 269–13 277. ( 10.1021/la402409f) [DOI] [PubMed] [Google Scholar]
- 13.Jiang Y, Savarirayan S, Yao Y, Park KC. 2019. Fog collection on a superhydrophilic wire. Appl. Phys. Lett. 114, 083701 ( 10.1063/1.5087144) [DOI] [Google Scholar]
- 14.Hamilton WJ III, Seely MK. 1976. Fog basking by the Namib Desert beetle, Onymacris unguicularis. Nature 262, 284–285. ( 10.1038/262284a0) [DOI] [Google Scholar]
- 15.Seely MK. 1979. Irregular fog as a water source for desert dune beetles. Oecologia 42, 213–227. ( 10.1007/BF00344858) [DOI] [PubMed] [Google Scholar]
- 16.Parker AR, Lawrence CR. 2001. Water capture by a desert beetle. Nature 414, 33–34. ( 10.1038/35102108) [DOI] [PubMed] [Google Scholar]
- 17.Zhai L, Berg MC, Cebeci FC, Kim Y, Milwid JM, Rubner MF, Cohen RE. 2006. Patterned superhydrophobic surfaces: toward a synthetic mimic of the Namib Desert beetle. Nano Lett. 6, 1213–1217. ( 10.1021/nl060644q) [DOI] [PubMed] [Google Scholar]
- 18.Chen D, Li J, Zhao J, Guo J, Zhang S, Sherazi TA, Li S. 2018. Bioinspired superhydrophilic–hydrophobic integrated surface with conical pattern-shape for self-driven fog collection. J. Colloid Interface Sci. 530, 274–281. ( 10.1016/j.jcis.2018.06.081) [DOI] [PubMed] [Google Scholar]
- 19.Zhu H, Guo Z. 2016. Hybrid engineered materials with high water-collecting efficiency inspired by Namib Desert beetles. Chem. Commun. 52, 6809–6812. ( 10.1039/C6CC01894G) [DOI] [PubMed] [Google Scholar]
- 20.Yin K, Du H, Dong X, Wang C, Duan J, He J. 2017. A simple way to achieve bioinspired hybrid wettability surface with micro/nanopatterns for efficient fog collection. Nanoscale 9, 14 620–14 626. ( 10.1039/C7NR05683D) [DOI] [PubMed] [Google Scholar]
- 21.Zhang X, Sun L, Wang Y, Bian F, Wang Y, Zhao Y. 2019. Multibioinspired slippery surfaces with wettable bump arrays for droplets pumping. Proc. Natl Acad. Sci. USA 116, 20 863–20 868. ( 10.1073/pnas.1912467116) [DOI] [PMC free article] [PubMed] [Google Scholar]
- 22.Wang Y, Wang X, Lai C, Hu H, Kong Y, Fei B, Xin JH. 2016. Biomimetic water-collecting fabric with light-induced superhydrophilic bumps. ACS Appl. Mater. Interfaces 8, 2950–2960. ( 10.1021/acsami.5b08941) [DOI] [PubMed] [Google Scholar]
- 23.White B, Sarkar A, Kietzig AM. 2013. Fog-harvesting inspired by the Stenocara beetle: an analysis of drop collection and removal from biomimetic samples with wetting contrast. Appl. Surf. Sci. 284, 826–836. ( 10.1016/j.apsusc.2013.08.017) [DOI] [Google Scholar]
- 24.Park KC, Kim P, Grinthal A, He N, Fox D, Weaver JC, Aizenberg J. 2016. Condensation on slippery asymmetric bumps. Nature 531, 78–82. ( 10.1038/nature16956) [DOI] [PubMed] [Google Scholar]
- 25.Guadarrama-Cetina J, Mongruel A, Medici MG, Baquero E, Parker AR, Milimouk-Melnytchuk I, González-Viñas W, Beysens D. 2014. Dew condensation on desert beetle skin. Eur. Phys. J. E 37, 109 ( 10.1140/epje/i2014-14109-y) [DOI] [PubMed] [Google Scholar]
- 26.Nørgaard T, Dacke M. 2010. Fog-basking behaviour and water collection efficiency in Namib Desert darkling beetles. Front. Zool. 7, 23 ( 10.1186/1742-9994-7-23) [DOI] [PMC free article] [PubMed] [Google Scholar]
- 27.Munson BR, Young DF, Okiishi TH. 1998. Fundamentals of fluid mechanics. New York, NY: John Wiley & Sons, Inc. [Google Scholar]
- 28.Seely M, Henschel JR, Hamilton WJ III. 2005. Long-term data show behavioural fog collection adaptations determine Namib Desert beetle abundance. South Afr. J. Sci. 101, 570–572. [Google Scholar]
- 29.Hamilton WJ III, Henschel Joh, Seely M. 2003. Fog collection by Namib Desert beetles. South Afr. J. Sci. 99, 181. [Google Scholar]
- 30.Mongruel A, Lamriben C, Yahiaoui S, Feuillebois F. 2010. The approach of a sphere to a wall at finite Reynolds number. J. Fluid Mech. 661, 229–238. ( 10.1017/S0022112010003459) [DOI] [Google Scholar]
- 31.Seely MK, Hamilton WJ. 1976. Fog catchment sand trenches constructed by tenebrionid beetles, Lepidochora, from the Namib Desert. Science 193, 484–486. ( 10.1126/science.193.4252.484) [DOI] [PubMed] [Google Scholar]
- 32.Cresswell J, Henning K, Pennel C, Lahoubi M, Patrick M, Young P, Tabor G. 2007. Conifer ovulate cones accumulate pollen principally by simple impaction. Proc. Natl Acad. Sci. USA 104, 18 141–18 144. ( 10.1073/pnas.0706434104) [DOI] [PMC free article] [PubMed] [Google Scholar]
- 33.Palmer MR, Nepf HM, Pettersson TJR, Ackerman JD. 2004. Observations of particle capture on a cylindrical collector: implications for particle accumulation and removal in aquatic systems. Limnol. Oceanogr. 49, 76–85. ( 10.4319/lo.2004.49.1.0076) [DOI] [Google Scholar]
Associated Data
This section collects any data citations, data availability statements, or supplementary materials included in this article.
Supplementary Materials
Data Availability Statement
The data presented in this work are available upon request. Code for the analysis described in the data analysis section and other analyses presented in this paper are available upon request.