Abstract
Tissue nonlinearity is conventionally measured in shear wave elastography by studying the change in wave speed caused by the tissue deformation, generally known as the acoustoelastic effect. However, these measurements have mainly focused on the excitation and detection of one specific shear mode, while it is theoretically known that the analysis of multiple wave modes offers more information about tissue material properties that can potentially be used to refine disease diagnosis. This work demonstrated proof of concept using experiments and finite element simulations in a uniaxially stretched phantom by tilting the acoustic radiation force excitation axis with respect to the material’s symmetry axis. Using this unique set-up, we were able to visualize two propagating shear wave modes across the stretch direction for stretches larger than 140%. Complementary simulations were performed using material parameters determined from mechanical testing, which enabled us to convert the observed shear wave behavior into a correct representative constitutive law for the phantom material, i.e. the Isihara model. This demonstrates the potential of measuring shear wave propagation in combination with shear wave modeling in complex materials as a non-invasive alternative for mechanical testing.
Keywords: shear wave elastography, shear vertical/horizontal mode, acoustoelasticity, tissue nonlinearity, finite element simulations, constitutive behavior
1. Introduction
The field of ultrasound based shear wave elastography (SWE) comprises techniques aiming for the non-invasive assessment of mechanical properties of biological soft tissue based on shear wave propagation characteristics (Ophir et al., 2002). The basic principle of SWE relies on the generation of shear waves in the tissue of interest through physiological motion (Kanai, 2005), an external mechanical excitation (Gao et al., 1995; Konofagou and Hynynen, 2003; Urban et al., 2012) or an acoustic radiation force (ARF) impulse (Bercoff et al., 2004; Nightingale et al., 2001; Sarvazyan et al., 1998); and subsequently the analysis of the shear wave propagation. As an end result, a SWE method typically displays the estimated shear wave propagation speed for the selected region of interest, which can be directly converted into the tissue’s shear modulus under the assumptions of homogeneity, isotropy and linear elasticity.
Even though SWE has proven its clinical added value in several domains (differentiating malignant (stiff) from benign (soft) breast lesions (Barr et al., 2015) and staging liver fibrosis (Ferraioli et al., 2014)), disease diagnosis could potentially be further refined by investigating other properties of soft tissue such as tissue anisotropy, viscoelasticity and nonlinearity. Initial steps have been taken in the SWE field towards more advanced mechanical material characterization. For example, tissue anisotropy can be assessed by analyzing shear wave speed measurements for various probe orientations with respect to fiber orientation, as has been described for skeletal muscle (Gennisson et al., 2010), arteries (Couade et al., 2010; Shcherbakova et al., 2014) and cardiac tissue (Couade et al., 2011; Villemain et al., 2018). Evaluation of tissue viscoelasticity has been reported through a frequency analysis of the recorded shear wave data (Gennisson et al., 2010; Nenadic et al., 2011) or estimation of the shear wave propagation speeds based on velocity and displacement data of the axial particle motion (Rouze et al., 2016). Efforts have also been made to quantify tissue nonlinearity in kidneys (Aristizabal et al., 2018) and breast tissue (Bernal et al., 2016) by performing multiple SWE measurements while varying the degree of tissue compression.
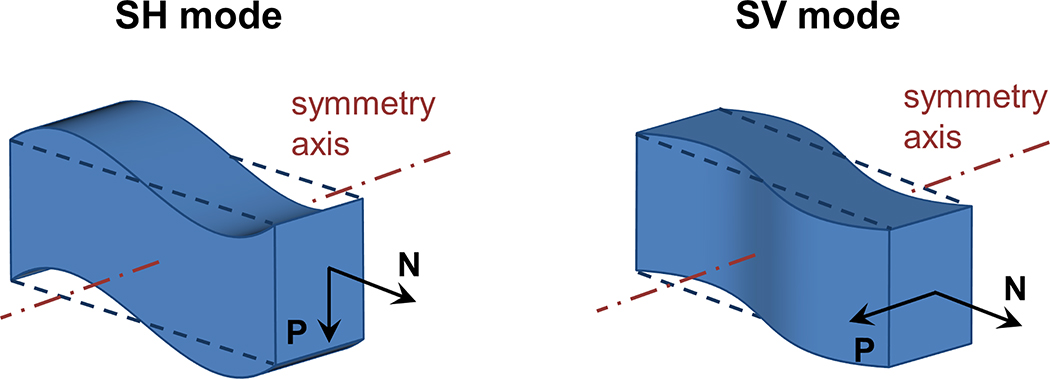
In this study, we focus on the assessment of tissue nonlinearity using ARF-based SWE. Tissue nonlinearity is conventionally evaluated in SWE based on the theory of acoustoelasticity, which assumes that a nonlinear elastic material exhibits a variation in measured shear wave speed when a uniaxial stress is applied (Catheline et al., 2003; Gennisson et al., 2007). Therefore, the shear wave will propagate faster along the stretch direction than across, resulting in apparent anisotropic behavior similar to that of transverse isotropic materials (Chatelin et al., 2014; Urban et al., 2015; Wang et al., 2013). Current ARF-based SWE measurements in this area have focused on the excitation and analysis of the shear horizontal (SH) mode, for which the wave polarization vector is perpendicular to the plane formed by the material symmetry axis and wave propagation direction (see also Fig. 1). Analysis of additional wave modes such as the shear vertical (SV) mode – defined by a wave polarization vector parallel to the plane formed by the material symmetry axis and wave propagation direction – can be used to advance material characterization techniques. Indeed, (Rouze et al., 2013) have shown that analysis of both SV and SH mode in an incompressible transverse isotropic material (such as skeletal muscle) resulted in estimation of all three elasticity constants instead of the conventional two parameters derived from examining only SH wave propagation. Excitation of both modes was realized in one SWE acquisition by tilting the ARF 45 degrees with respect to the material’s symmetry axis (fiber orientation), but the study lacked experimental demonstration of this principle.
Fig. 1 –
Illustration of a shear horizontal (SH) and a shear vertical (SV) mode in a material with a symmetry axis. P is the polarization vector and N is the propagation direction vector. In the SH example, the material is oscillating vertically; while in the SV example, the material is oscillating horizontally.
Therefore, the aim of this work is to demonstrate, in a physical experiment, the feasibility to generate and detect both SV and SH wave modes using ARF-based SWE in a tissue-mimicking medium with a symmetry axis induced by the acoustoelastic effect. SWE acquisitions were performed for various uniaxial stretch levels and ARF tilt angles. Complementary simulations using the finite element method (FEM) (Caenen et al., 2015; Palmeri et al., 2005) were performed to mimic our experimental SWE acquisitions, in which the phantom material parameters were derived from uniaxial mechanical testing. The aim of the FEM simulations was two-fold: (i) to compare the numerical and experimental shear wave speeds when the transducer is oriented perpendicular to the phantom’s stretch axis (no ARF tilt angle) to assess the effect of material nonlinearity on shear wave propagation speeds and (ii) to gain insights into the complex experimental shear wave propagation patterns when the transducer is tilted with respect to the phantom’s stretch axis by studying simulated shear wave propagation in various hyperelastic material models.
2. Materials and Methods
2.1. Phantom set-up: geometry and material
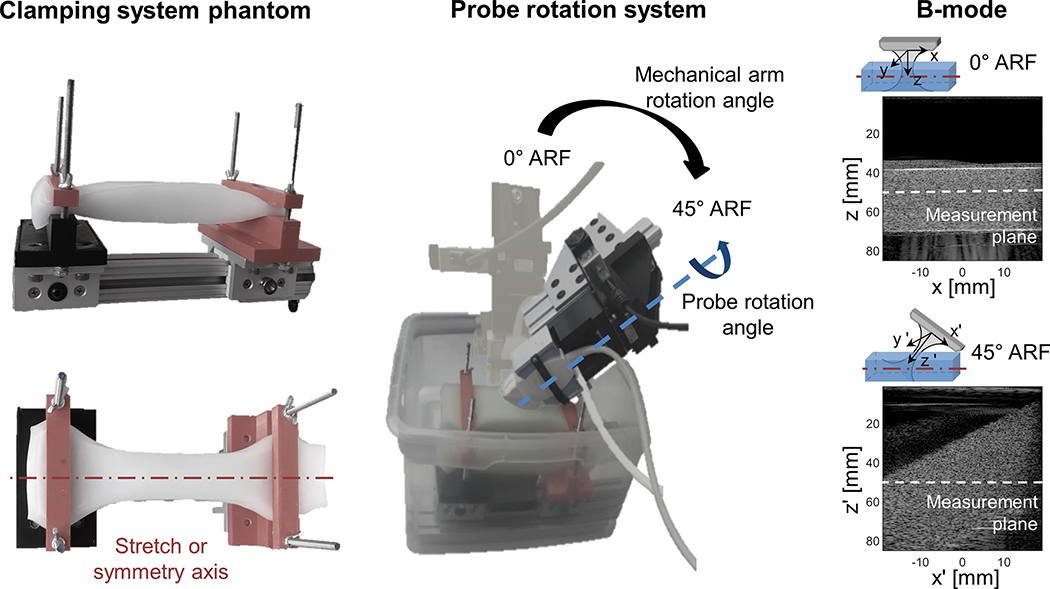
A rectangular prism shaped polyvinylalcohol (PVA) phantom with dimensions 50×50×200 mm was created by freeze-thawing a mixture of 8 wt% PVA (PVA 98–99% hydrolyzed, Alfa Aesar, Ward Hill, MA, USA), 1 wt% cellulose (Sigmacell Cellulose 20 μm, Sigma Life Science, Darmstadt, Germany), 50.4 wt% coolant (Concentrate Antifreeze, Prestone, Chicago, IL, USA) and 33.6 wt% deionized water one time, following the preparation method as reported in (Surry et al., 2004). The phantom was clamped at both sides as shown in Fig. 2 and subsequently subjected to an uniaxial stretch λ along its longest dimension (x-direction in Fig. 2), based on the measured length between the clamps. The stretch varied from 1.0 to 2.0 in steps of 0.2 and a maximal reachable uniaxial stretch of 2.14 was considered at last.
Fig. 2 –
Experimental set-up illustrating the clamping system in the left panel, the probe rotation system in the middle panel and the B-modes in the right panels. The B-modes also demonstrate the location of the measurement plane along which particle velocities are extracted.
A small sample at the edges of the fabricated PVA phantom was cut off for mechanical testing purposes. PVA’s material properties were characterized using a tensile testing machine (Instron 5944, Norwoord, USA) by uniaxially stretching the sample at a strain rate of 3.5 % per second up to an extension of 220% of its original length. During this stretching procedure, extension and load measurements were recorded every 10 ms.
2.2. Shear wave elastography experiment
3D SWE measurements were performed with a Verasonics Vantage research system (Verasonics Inc., Kirkland, WA, United States) by rotating a L7–4 probe (ATL, Philips Ultrasound Inc., Bothell, WA, United States) around its axis in steps of 2.5°, as shown in Fig. 2 (blue arrow). Shear waves were generated in the PVA phantom submerged in water using a 4 MHz push with F-number of 3 for 300 μs at 50 mm axial focal depth (= z or z’-direction in Fig. 2) and were subsequently imaged for 20 ms using plane wave imaging. To improve SNR without compromising the temporal resolution, this sequence was repeated while varying the steering angle of the plane wave (−3°, 0°, 3), resulting in an effective frame rate of 5 kHz for the compounded image (Montaldo et al., 2009). These 3D compounded SWE measurements were also performed for a probe tilt of 45° (rotation axis of mechanical arm is the y-axis (=y’-axis) located at the center of the phantom, see Fig. 2). While the induced displacements were mainly oriented in the z-direction and tracked in the x-direction for the 0° ARF tilt, the main displacement component was along the z’-direction and tracked in the x’-direction for the 45° ARF acquisition (see also Fig. 2). These SWE acquisitions for 0° and 45° ARF tilt were repeated for every considered strain level.
All SWE data were post-processed in Matlab R2018b (The MathWorks Inc., Natick, MA, USA). The beamformed in-phase and quadrature (IQ) data of the SWE acquisitions were used to estimate the axial particle velocity motion (z-component for 0° ARF and z’-component for 45° ARF) according to Kasai’s autocorrelation technique (Kasai et al., 1985). The particle velocity data was averaged over a depth of field of 1 mm at a depth of 47.5 mm, slightly lower than the focal depth due to acoustic attenuation. Subsequently, the data was temporally up-sampled by a factor 10 before shear wave propagation analysis (see section 2.5).
2.3. PVA material model
The uniaxial mechanical test data, described in section 2.1, served as input for the PVA material model fitting procedure to estimate the material parameters which can be subsequently used in our shear wave simulations (see section 2.4). PVA is an essentially isotropic and nonlinear rubberlike material (hyperelastic). Its material behavior can be described in terms of a strain energy potential, which defines the strain energy stored in the material per unit of reference volume as a function of the current strain (Simulia, 2017). The strain energy function ψ can be decomposed in a volumetric part ψvol and a deviatoric part ψdev, as follows:
| (1) |
As it is unknown which hyperelastic material model can accurately represent the experimentally observed shear wave physics, we considered three analytical forms for the strain energy function which are all commonly used when limited test data are available for material calibration (Arruda and Boyce, 1993; Isihara et al., 1951; Mooney, 1940; Rivlin, 1948):
| ψvol | ψdev | ||
| Arruda-Boyce | (2) | ||
| Mooney-Rivlin | (3) | ||
| Isihara | (4) | ||
For the volumetric part, J represents the total volume ratio and the material parameter D is linked to the bulk modulus K0 (D = 2/K0). For the deviatoric part, Cij, λm, μ are material constants, , are material invariants ( and ) and is the deviatoric stretch . Note that the deviatoric strain energy function of the Mooney-Rivlin and Isihara model can be generalized to a polynomial function, , with N = 1 for the Mooney-Rivlin model and N = 2 for the Isihara material law (with C11 = C02 = 0).
The material parameters, grouped in vector k, were found by performing a nonlinear least squares optimization procedure in Matlab based on the differences in modeled and experimentally measured uniaxial Cauchy stresses, and respectively. The objective function f(k) which should be minimized is defined as follows:
| (5) |
with m the number of measurement points during uniaxial testing.
2.4. Shear wave simulations
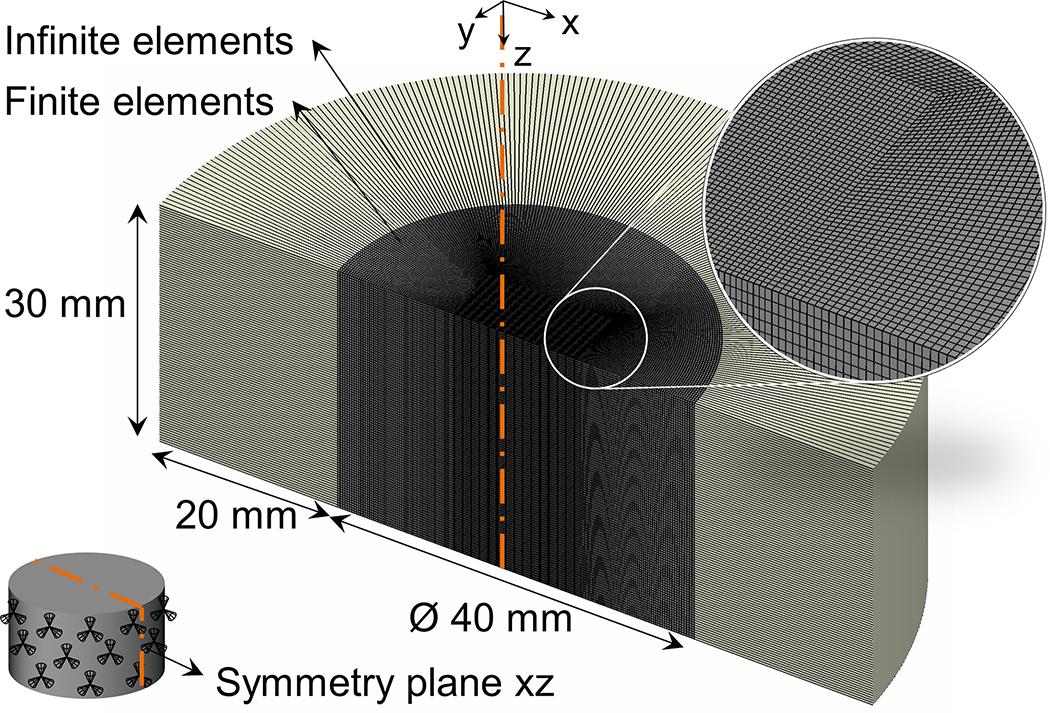
Shear waves were simulated in a numerical PVA phantom to mimic the experimental SWE acquisitions using an explicit integration scheme in the FEM software Abaqus (Abaqus Inc., Providence, RI, USA), as has been described before (Caenen et al., 2015; Palmeri et al., 2005). The geometry of the PVA phantom was modeled as a cylinder with a diameter of 40 mm and a height of 30 mm, smaller than the actual dimensions of the PVA phantom as described in section 2.1 in order to reduce the computational demands of the simulation, but still sufficiently large to ensure minimal effects of the boundaries on shear wave propagation after ARF application (see Fig. 3). Symmetry boundary conditions were applied to the xz-plane in Fig. 3. The mesh size of the model varied between 0.1 mm and 0.3 mm, resulting in a total of 1 851 200 hexahedral solid elements, taking into account the 10–15 elements per shear wavelength criterion (Kocbach, 2000) and the requirement of mesh refinement in the region of ARF application (Caenen et al., 2017). The circular edges of the modeled cylinder were assumed to be infinite by modeling structural infinite elements at these boundaries to avoid spurious reflections arising from the model boundaries, as shown in Fig. 3.
Fig. 3 –
Set-up of the finite element model demonstrating geometry, mesh and boundary conditions.
PVA’s mechanical behavior was described by an Arruda-Boyce (AB), Mooney-Rivlin (MR) or Isihara material model, of which its material parameters were determined from the uniaxial mechanical test data – as explained in section 2.3. As limited test data is available, the parameter D was chosen as 0.01 MPa−1 to ensure quasi-incompressibility of the PVA phantom (large enough bulk modulus) and computational efficiency (reasonably small time increment in explicit numerical integration scheme). The stretching of the PVA phantom itself was not simulated to reduce computational time as quasi-static simulations of the uniaxial stretching procedure require different spatial and temporal discretization than wave propagation simulations (Caenen et al., 2018). Instead, a uniform uniaxial pre-stress, derived from the mechanical test data, was applied to the model along the x-direction. The phantom was subsequently kept fixated at its borders in the x-direction to maintain the applied pre-stress, as visualized in Fig. 3.
The ARF was applied as a body force F(x, y, z) for a duration of 300 μs in the central region of the model (Caenen et al., 2015; Palmeri et al., 2005). The ARF orients dominantly downwards with respect to the probe orientation (Palmeri et al., 2005), which was modeled as a force vector pointing in the positive z-direction for 0° ARF tilt and in the positive z’-direction for 45⁰ ARF tilt (see Fig. 2). Further, the force F(x, y, z) was implemented as a 3D Gaussian function in the model in order to minimize computational time (Caenen et al., 2018; Palmeri et al., 2014):
| (6) |
with attenuation coefficient α, longitudinal wave speed CL, maximal acoustic intensity Imax, coordinates of the focus (x0, y0, z0), and 3D Gaussian width (σx, σy, σz). The coordinates of the focal point were the same as in the experiment, i.e. (0 mm, 0 mm, 50 mm). We assumed Gaussian widths of 0.4 mm, 0.4 mm and 7.5 mm for x-, y- and z-direction, respectively (Caenen et al., 2018; Palmeri et al., 2014). The maximal amplitude of the ARF was calculated by assuming an attenuation coefficient of 0.4 dB/MHz/cm at 4 MHz, a longitudinal wave speed of 1540 m/s and a maximal acoustic intensity of 1500 W/cm2 (typical for ARF excitations (Nightingale, 2011)).
Varying material model, stretch level and ARF tilt angle resulted in a total of 42 simulations, each run to simulate 5 ms physical time. Velocity data in the z-direction for 0° ARF tilt and in x- and z-direction for 45° ARF tilt were extracted at a sampling rate of 10 kHz. Subsequently, the extracted data was interpolated to an equidistant rectangular grid with 0.2 mm sampling in all directions and a polar grid with a sampling of 0.2 mm, 5° and 0.2 mm in radial, angular and z-direction, respectively.
2.5. Shear wave propagation analysis
Shear wave propagation was analyzed by studying normalized axial particle velocities (z-component for 0° ARF and z’-component for 45° ARF) for both experiments and simulations. Shear wave speeds were derived from the global (and local) maximum of the Radon sum transformation of a selected spatial temporal domain depicting the axial velocities (Rouze et al., 2010).
3. Results
3.1. Material model fitting to mechanical test data
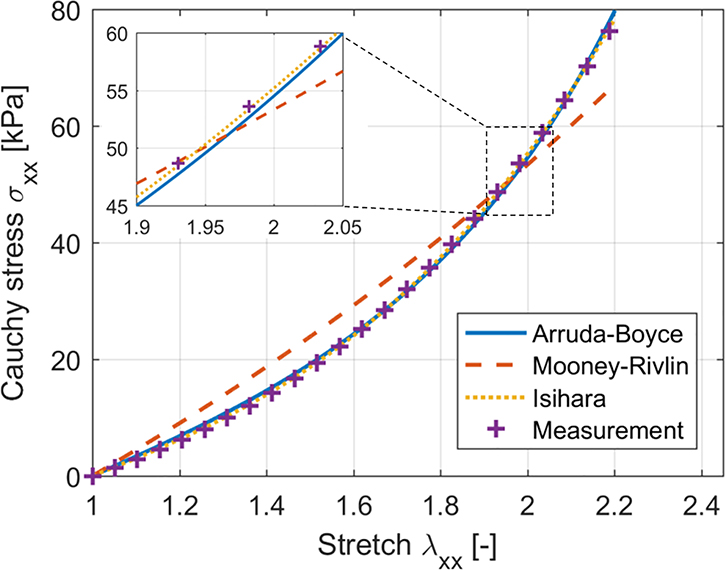
Three different material models were fitted to the measured uniaxial tensile data using a least-squares procedure, resulting in the material parameters listed in Table 1. The uniaxial tensile responses of the fitted Arruda-Boyce (AB) and Isihara material models are in excellent correspondence with the measured data, as shown in Fig. 4. However, the Mooney-Rivlin (MR) material model is not able to generate the same up-turn in axial stresses as is measured. Note that a negative C01 coefficient is obtained for the Isihara and MR model in Table 1, which sets – for the considered mechanical testing procedure – no stability limits on the Isihara model but does affect the performance of the MR model. Drucker’s stability criterion (Bergstrom, 2015) is taken into account during fitting of the MR model, which sets a lower limit on the C01 coefficient, to ensure stability for large compressive strains (across the uniaxial stretch direction). Additionally, the presented solution for the Isihara model is not unique due to the larger number in material parameters compared to the mechanical test data available, as is also reflected by the wider confidence interval of the fitted parameters.
Table 1 –
Results of material model fitting to measured uniaxial tensile test data (goodness of fit is expressed as the coefficient of determination R2 and 95% confidence interval for each fitted parameter is indicated in between the rectangular brackets).
| Arruda-Boyce (R2=0.9989) | Mooney-Rivlin (R2=0.9677) | Isihara (R2=0.9999) | |||
|---|---|---|---|---|---|
| μ | 8.01 [7.99, 8.04] kPa | C10 | 7.89 [7.66, 8.11] kPa | C10 | 5.44 [4.61, 6.26] kPa |
| λm | 1.58 [1.58, 1.59] | C01 | −0.538 [−0.959, −0.117] kPa | C01 | −0.523 [−1.44, 0.392] kPa |
| C20 | 0.677 [0.455,0.900] kPa |
Fig. 4 –
Uniaxial tensile test data of measurement together with response of fitted material models (Arruda-Boyce (AB), Mooney-Rivlin (MR) and Isihara material model). Note that not all measurement points are represented on the graph for clarity.
3.2. Shear wave propagation in the experiments
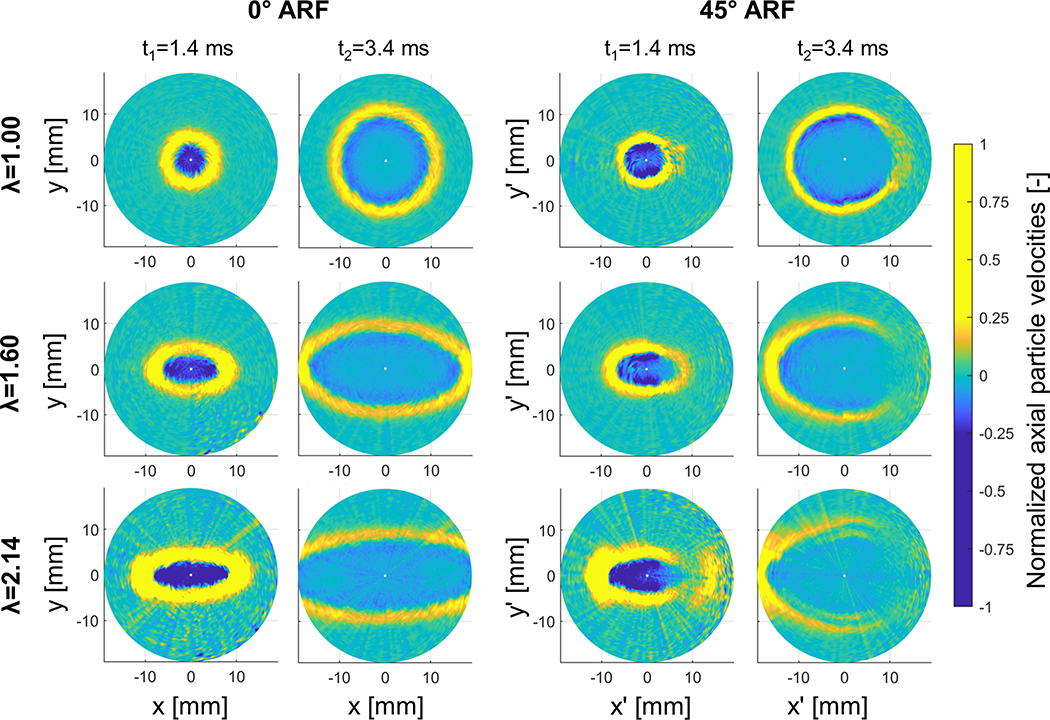
The measured shear wave propagation in the xy-plane is visualized in Fig. 5 for three stretches and the two considered ARF tilts at different time instances. The first row of panels depicts shear wave propagation for no stretch (λ=1.00) and shows clearly a circular shear wave propagation pattern for both 0° and 45° ARF tilt, as expected. For 45° ARF, the magnitude of the main shear wave front is significantly lower for positive x’-coordinates (lower signal-to-noise ratio (SNR)), due to the increased attenuation resulting from the unequal distribution of phantom material between probe and measurement plane along the x’-direction, as can be seen in the right bottom B-mode of Fig. 2. This is observed for all stretches. The second row in Fig. 5 visualizes an elliptical shear wave propagation pattern for a stretch λ of 1.60 for both 0° and 45° ARF tilt, with the major ellipse axis corresponding to the stretch direction. The third row of images demonstrates shear wave propagation in the maximally stretched phantom (λ=2.14). For 0° ARF, the wave propagation ellipse is more elongated than the one for a stretch λ of 1.60. For 45° ARF, two wave features become obvious: (i) an extra ridge appears in the main wave front pattern along the major ellipse axis (cusp-like pattern) and, (ii) shear wave splitting along the minor ellipse axis.
Fig. 5 –
Measured shear wave propagation in the xy-plane at axial focus at time points 1.4 ms and 3.4 ms for three stretches λ (1.00, 1.60 and 2.14) and ARF tilts of 0° and 45°.
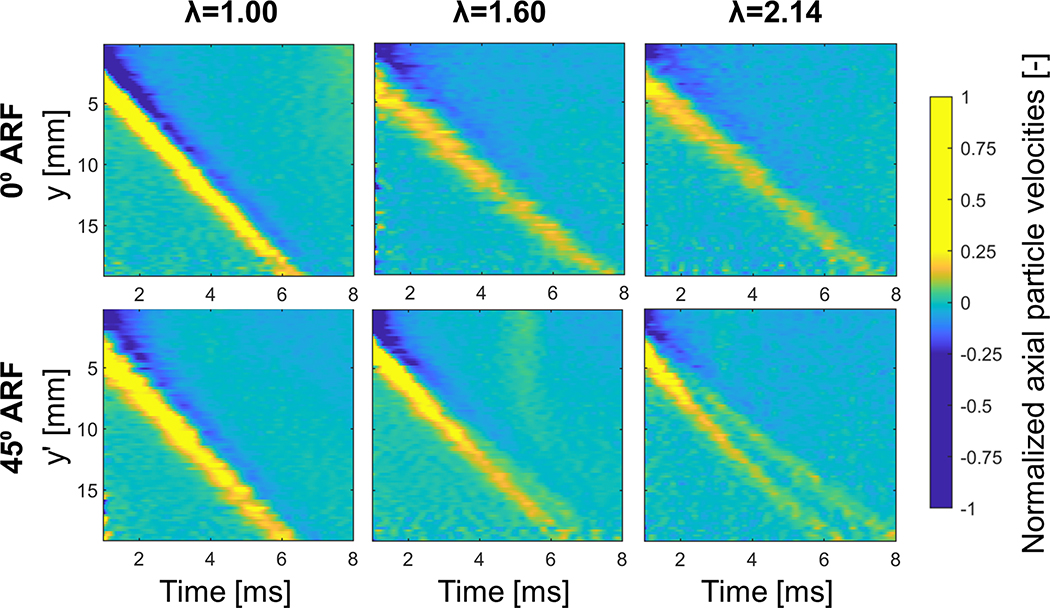
The phenomenon of shear wave splitting is better detectable when we look at the spatio-temporal plots along the minor ellipse axis (y-axis = y’-axis) of the three considered stretches in Fig. 6 for 0° and 45° ARF tilt. The right bottom two images demonstrates shear wave splitting for a stretch λ of 1.60 and 2.14 for 45° ARF tilt, whereas the other spatio-temporal plots depict the presence of one main wave front.
Fig. 6 –
Spatio-temporal plots depicting shear wave splitting along the y-direction (across the stretch axis) when stretch increases (λ=1.00–1.60–2.14) for 45° ARF.
3.3. Shear wave propagation in the simulations
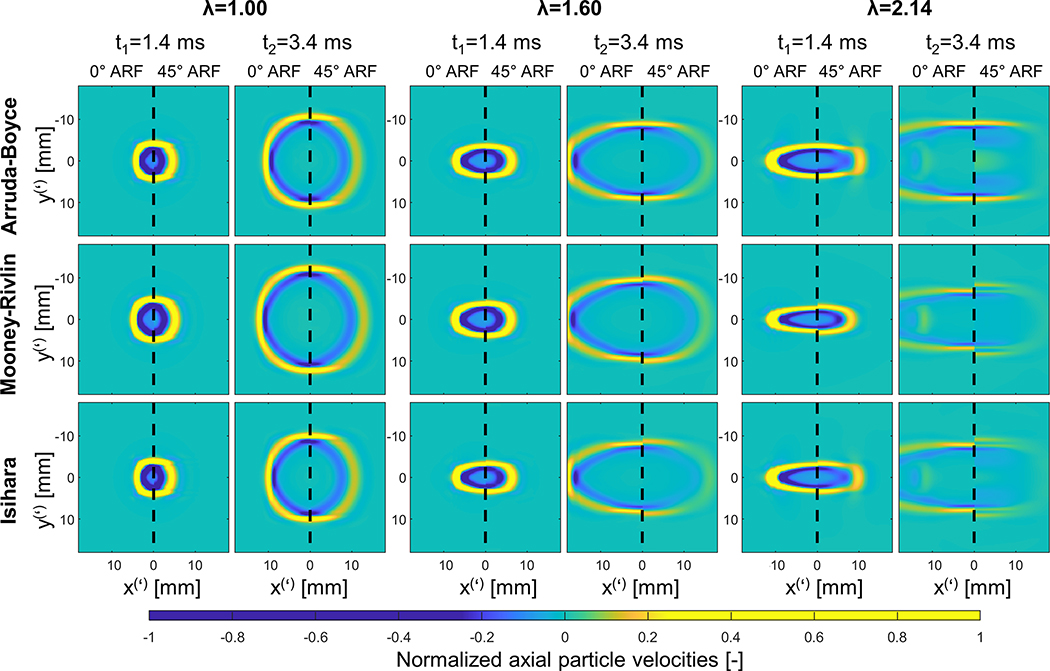
Fig. 7 illustrates the simulated shear wave propagation in the lateral-elevational plane for three stretch states and three material models at two time instances. Note that in these images the left half portrays results from the 0° ARF tilt in the xy-plane, and the right half represents the results from the 45° ARF tilt in the x’y’-plane. For a stretch λ of 1.00 (resting state), the shear wave acquisitions for 0° and 45° ARF depict similar circular shear wave propagation for all material models. The shear wave does propagate substantially faster for the MR material model compared to the other two (0° ARF speeds of 3.8 m/s vs. 3.2 m/s and 3.0 m/s for AB and Isihara model, respectively), which might be due to the higher instantaneous stiffness at λ=1.00 (larger slope of stress-strain curve at λ=1.00 in Fig. 4). For a stretch λ of 1.60, the shear wave propagation becomes elliptical for both 0° and 45° ARF acquisitions. Slight differences start to appear between the shear wave propagation along the minor ellipse axis between 0° and 45° ARF tilts for the MR and Isihara material model: the shear wave propagates faster in the 45° ARF tilt (shear wave speed of 3.1 m/s and 2.8 m/s for MR and Isihara model, respectively) compared to the 0° ARF tilt (shear wave speed of 2.9 m/s and 2.5 m/s for MR and Isihara model, respectively). For a stretch λ of 2.14, the 0° ARF shear wave simulations are very alike for all material models. Small wave reflections are noted along the major ellipse axis at t2, probably due to a mis-match in material definition between finite and infinite elements (infinite elements can only have an elastic material definition (Simulia, 2017)) or non-optimal wave impinging conditions for the infinite elements (ideal working conditions for the infinite elements are orthogonally impinging waves (Simulia, 2017)). However, for 45° ARF, clear differences are observed in the shear wave propagation patterns between the different material models. The AB model shows cusp-like patterns along the major ellipse axis, whereas the MR model displays shear wave splitting along the minor ellipse axis. The Isihara model shows a combination of both wave features.
Fig. 7 –
Simulated shear wave propagation in the xy-plane at time points 1.4 ms and 3.4 ms for stretches λ 1.00, 1.60 and 2.14 and three material models (Arruda-Boyce, Mooney-Rivlin, Isihara material law). The axes demonstrate x- and y-coordinates in case of 0° ARF and x’- and y’-coordinates in case of 45° ARF. Due to symmetry in our model about x(’)=0 mm, half of the shear wave propagation pattern in the x(’)y(’)-plane is shown, with left half of images depicting 0° ARF and right half of images showing 45° ARF.
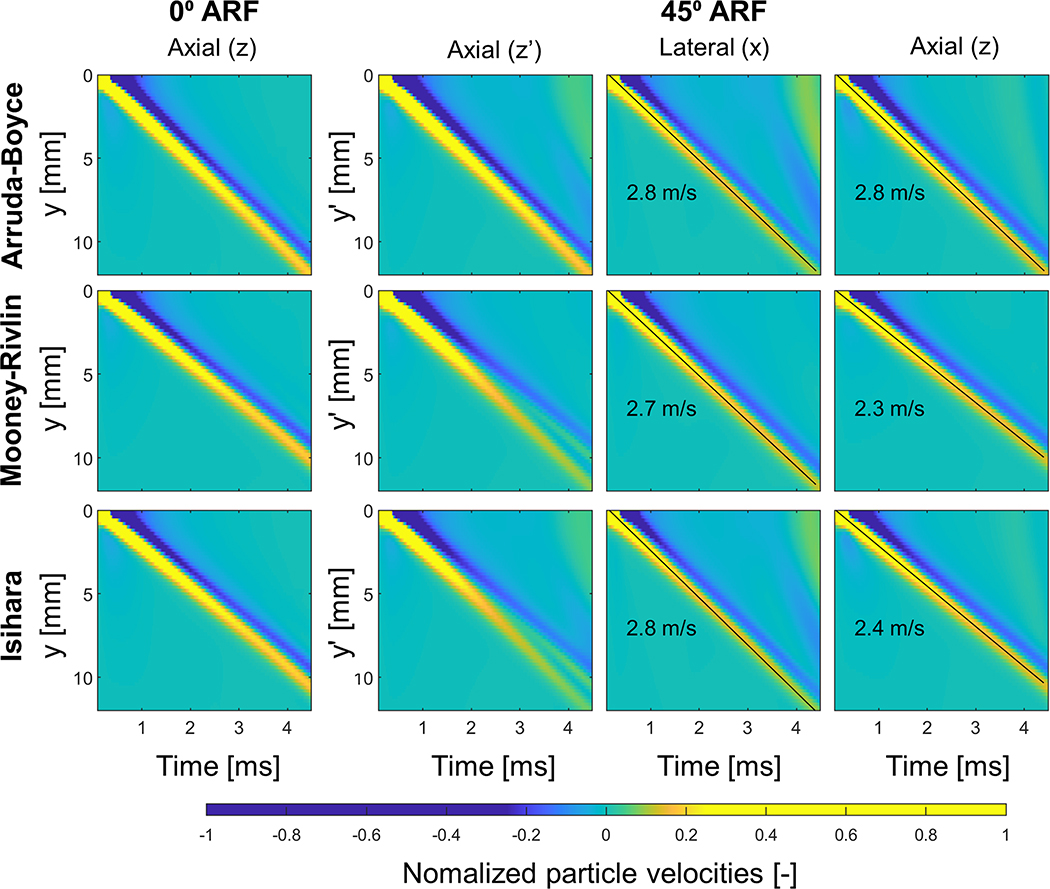
The shear wave splitting along the minor ellipse axis is also visualized in the spatio-temporal domain in Fig. 8 for all material models and both ARF tilts. The first two columns of images visualize the axial particle velocities of 0° and 45° ARF acquisition – as would be measured in actual experiments (see also Fig. 6). This figure again clearly demonstrates shear wave splitting for the MR and Isihara material model. When we analyze the velocities in the coordinate system representing the model’s geometry (i.e. the x- and z-direction as depicted in Fig. 2), the spatio-temporal plots depict one wave front for all material models (see last two columns of Fig. 8). For the second column of images from the right in Fig. 8, the polarization vector (x-direction) of the wave is thus parallel to the plane formed by the symmetry axis of the material (x-axis) and the wave propagation direction (y-direction = y’-direction), indicating that this is the SH mode. For the column of images on the farthest right in Fig. 8, the wave polarization vector (z-direction) is perpendicular to that same plane, making this the SV mode. The speeds of these modes are 2.8 m/s and 2.8 m/s (AB), 2.7 m/s and 2.3 m/s (MR), and 2.8 m/s and 2.4 m/s (Isihara) for the particle velocities in the x- and z-direction, respectively.
Fig. 8 –
Spatio-temporal plots demonstrating simulated shear wave propagation along the minor ellipse axis (across the stretch direction) at a stretch λ of 2.00 for both ARF tilts (0° and 45°) and three material models (Arruda-Boyce, Mooney-Rivlin, Isihara material law). The split wave front for 45° ARF can be broken down into individual wave fronts when decomposing the tissue velocity vector according to the non-tilted coordinate system of 0° ARF (xyz-system). The left two columns visualize axial particle velocities as would be measured in the experiments.
3.4. Shear wave speed analysis as a function of stretch in experiments and simulations
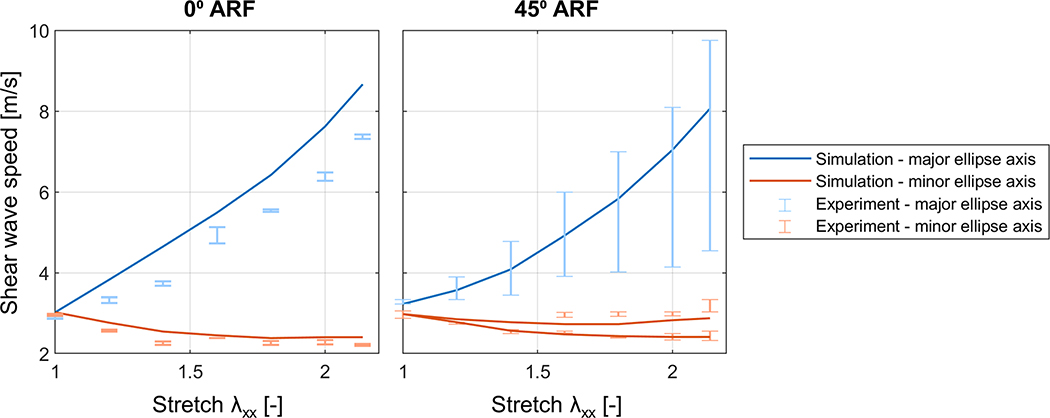
For the shear wave speed analysis as a function of stretch, we focused on the Isihara material model for the simulations, as its wave features corresponded best to the ones observed in the experiment. Shear wave speeds were estimated along the major and minor ellipse axis of the shear wave propagation surfaces for the 0° and 45° ARF acquisition, and are illustrated as a function of stretch in Fig. 9 for simulation and experiment. The experimental shear wave speeds are indicated as errorbars of which the caps correspond to the wave speeds determined for both shear waves in Fig. 5. The speeds of both waves correspond in general well except along the major ellipse axis in the 45° ARF acquisition (difference of 5.2 m/s at λ=2.14). This is probably due to the non-uniformity in uniaxial stress distribution linked to the geometry of the set-up (see Fig. 2): shear wave speed estimations are sensitive to local spatial stress variations, which vary especially in the proximity of one of the clamps, affecting mostly the tracking of the right shear wave in Fig. 2.
Fig. 9 –
Shear wave speeds as a function of stretch λxx for experiments and simulations (with Isihara material model). Errorbars indicate the range of shear wave speed estimations for left and right shear wave observed in the experiment.
For 0° ARF, we can observe an increasing trend in shear wave speed as a function of stretch for the major ellipse axis (+153% and +187% for experiments and simulations, respectively), whereas a decreasing trend in wave velocity is noticed for the minor ellipse axis (−20% and −25% for experiments and simulations, respectively). Similar trends are observed for the 45° ARF acquisition. A second wave front is visible starting from a stretch λ of 1.60 for the 45° ARF measurement, whereas this is yet observed from a stretch of 1.20 in the simulations using the decomposition illustrated in Fig. 8. Simulated shear wave speeds agree in general well with the measured shear wave speeds. Along the major ellipse axis, the simulations slightly overestimated the experimental shear wave speeds (e.g. +17% at λ=2.14 for 0° ARF acquisition).
4. Discussion
4.1. Tilted ARF configuration for SH and SV mode excitation
In this work, we studied the feasibility of a novel method in SWE – tilting the ARF with respect to the material’s symmetry axis – using experiments and FEM simulations to excite multiple wave modes at the same time. This method has been originally proposed by (Rouze et al., 2013) for transverse isotropic materials, but lacked experimental demonstration. This work translates the proposed method to other materials with a symmetry axis, i.e. a uniaxially stretched tissue-mimicking material, and demonstrated its experimental feasibility. The principle of exciting multiple wave modes for material characterization is also used in other fields, such as the field on non-destructive material testing where a technique called ultrasonic polar scan insonifies a composite plate from multiple angles to generate quasi-longitudinal, quasi-SH and quasi-SV modes for estimation of various material properties such as viscoelasticity or fiber volume fraction (Kersemans, 2016).
The 0° ARF acquisitions in Fig. 9 showed an increase in shear wave speeds along the stretch direction when stretch increased, and a speed decrease when measured across the stretch direction, as is expected from the acoustoelastic effect (Catheline et al., 2003; Chatelin et al., 2014; Gennisson et al., 2007; Urban et al., 2015). Additional FEM simulations allowed us to directly link the mechanically measured hyperelastic material behavior in Fig. 4 to the shear wave speed behavior measured for the 0° ARF acquisition at increasing stretch in Fig. 9. The 45° ARF acquisition showed clear differences in shear wave propagation patterns with the 0° ARF measurements: cusp-like patterns appeared along the stretch axis, whereas the phenomenon of shear wave splitting was observed across the stretch direction (see Fig. 5 and Fig. 6). FEM simulations with various material models (AB, MR and Isihara material law – all typically used for a rubber-like material such as PVA (Simulia, 2017)) provided insights into the complex shear wave physics of the 45° ARF measurement. Only the Isihara material model was able to represent the two previously mentioned wave features as observed in the experiment. Furthermore, when analyzing the shear wave propagation in the 45° ARF acquisition according to the geometry’s coordinate system (xyz in Fig. 2), it was clear that shear wave splitting arose due to a combination of the SH and the SV mode propagation, as demonstrated in Fig. 8. The shear wave speed analysis in Fig. 9 further demonstrates this effect: the speeds of the second mode along the minor ellipse axis of the 45° ARF acquisition corresponded to the ones observed for the 0° ARF acquisition, again confirming the presence of the SH mode. Furthermore, analysis of the simulated particle velocities in two directions allowed wave speed estimation of both SV and SH mode at each stretch state, whereas for the experiments shear wave splitting was only visible at high stretches λ≥1.60. This can be explained by the small difference in between SV and SH mode speed at low stretches (≤0.2 m/s) in combination with the selected set-up settings (spatial resolution, lateral tracking range and SNR). For the major ellipse axis, there is only one main wave front present, indicating that SV and SH mode have similar propagation characteristics. The experimental wave speeds for 0° and 45° ARF measurements along the major ellipse axis are in the same range, but cannot be more precisely quantified due to the large variety in speed estimations of the 45° ARF measurements. The simulations demonstrate here a small discrepancy between 0° ARF speed (e.g. 8.7 m/s at λ=2.14) and 45° ARF speed (e.g. 8.1 m/s at λ=2.14), probably due to the cusp-like wave patterns and wave front smearing caused by the cylindrical geometry of the push (Rouze et al., 2019), both resulting in speed estimation inaccuracies.
4.2. Shear wave behavior of the AB, MR and Isihara material model
Multiple material laws, i.e. AB, MR and Isihara model, were considered in this study to model the material response of the tissue-mimicking material PVA. Even though the mechanical response of all material models was very similar for uniaxial tensile testing (see Fig. 4), the observed shear wave behavior in Fig. 7 and Fig. 8 for the 45° ARF simulations at stretches λ≥1.20 was different. The AB law was able to model the cusp-like patterns along the major ellipse axis of the shear wave surface – as observed in the measurements (see Fig. 7), but the simulations did not show any shear wave splitting for the minor ellipse axis. The opposite is true for the MR material model: the simulations in Fig. 7 did not demonstrate cusp-like patterns along the ellipse major axis, but did show shear wave splitting along the minor ellipse axis. The simulations with the Isihara material model displayed a combination of both wave features, and thus mimicked best our experimental observations.
Even though a mix of phenomenological and physics-based material models were considered in this study, interpreting the shear wave behavior for the 45° ARF simulations of the different material models in terms of their strain energy potential equations reveals two important observations. First, based on equation (2) for the AB law and (4) for the Isihara law, we note that the appearance of cusp-like wave patterns along the major ellipse axis is linked to the higher order power-dependence of the first material invariant. Additionally, the absence of the higher order power-dependence of the first material invariant in the MR model (equation (3)) results in failure of reflecting the strain-stiffening effect that is experimentally observed when the stretch increases (see also Fig. 4 – even when the Drucker’s stability criterion (Bergstrom, 2015) is not set). Second, equation (3) of the MR law and (5) of the Isihara law show that the phenomenon of shear wave splitting is associated with the term involving the second material invariant (with a negative coefficient). Both observations are in correspondence with what has been reported before in the field of constitutive modeling of soft biomaterials: the power dependence of the first material invariant is important for strain-stiffening at high stretches and the dependence on the second material invariant results in more accurate stress responses and deformations (Horgan and Smayda, 2012; Wineman, 2005), but their importance for SWE modeling has not yet been described to the best of our knowledge.
Shear wave speed estimations for the Isihara material model corresponded in general well with the measured shear wave speeds. Part of the discrepancies between simulated and measured shear wave speeds can be explained by the clamping system visualized in Fig. 2. Indeed, when we mimic this clamping system in FEM simulations (data not shown), we obtain a smaller Cauchy stress along the stretch direction (σxx) in the central portion of the phantom than the stress derived from Fig. 4: the uniaxial stress is overestimated by 27.7% on average. This clarifies the overestimation of the simulated speeds for 0° ARF along the stretch direction in Fig. 9. This also results in an overestimation of the simulated shear wave speeds along the stretch direction for 45° ARF, but the exact experimental shear wave speeds are unsure due to local stress variations and measurement uncertainties (such as decreased SNR). Other relevant factors that may explain the discrepancy between simulated and measured shear wave speeds are viscoelasticity in the experiment and potential clamp slipping.
4.3. Clinical relevance: advancing material characterization
Excitation of the SV mode next to the traditionally analyzed SH mode in nonlinear solids such as soft tissue results in additional information about the material parameters and internal stress state, potentially improving disease diagnosis. Currently, (pre)clinical applications of the acoustoelasticity theory employ a combination of static and shear wave elastography to monitor the changes in strain and shear wave speed of only the SH mode during axial compression (Aristizabal et al., 2018; Bernal et al., 2016; Latorre-Ossa et al., 2012). Therefore, they utilized two different material laws to approximate the constitutive behavior of soft tissue: (i) Hooke’s law to determine the shear modulus μ and the uniaxial stress component σz, and (ii) the general weakly nonlinear third-order elasticity expansion to obtain an estimate of the nonlinear shear modulus A (the elasticity expansion coincides with the MR model in equation (3) as shown by (Rivlin and Saunders, 1951): μ = 2(C10 + C01 and A = −8(C10 + 2C01)). The MR model does not incorporate the strain-stiffening effect, as shown in Fig. 4 and Fig. 7, which is known to be relevant for soft tissues at much smaller values of stretch than in the case of rubber-like materials as PVA (Horgan and Smayda, 2012). It might thus be more appropriate for a quantitative material parameter analysis to use only one material law that includes an extra material parameter to describe this strain-stiffening effect – as described in the Isihara material model in this study.
Another option is to fit simulated or theoretical data to the measured observations for a more quantitative material parameter analysis – also known as solving an inverse elasticity problem. This has yet been demonstrated for compression elastography in breast tissue where linear and nonlinear elastic parameters were derived based on displacement data (Goenezen et al., 2012). For the SWE-technique, the group speed surfaces for both SV and SH mode can be used for this purpose. The forward problem for the predicted group speed surfaces can be solved using finite element simulations in the time domain as proposed in this work or in the frequency domain (Caenen et al., 2016) or theoretical analysis with Green’s tensor method (Boulanger and Hayes, 2001). A theoretical derivation for shear wave propagation in an uniaxially stretched Isihara material is the subject of ongoing and future work, and is feasible due to the recently published tractable calculation of Green’s tensor for shear wave propagation (Rouze et al., 2019).
Before the suggested inverse problem solution can be applied for advancing material characterization in clinical SWE, future work should first demonstrate the feasibility of SV and SH mode excitation in various ex vivo and in vivo tissue materials with different material characteristics. Indeed, current work only presents a proof-of-concept study for exciting two shear wave modes using a tilted ARF axis with respect to the symmetry axis of the material, and future work should investigate which sensitivity is necessary in terms of SNR, spatial and temporal resolution to excite and detect both the SH and SV mode ex vivo and in vivo. It is expected that application of high uniaxial stresses as reported in this work is not necessary to excite both SH and SV modes, but this should be further investigated. Furthermore, the residual stress state in in vivo soft tissues needs to be taken into account in new analyses. Ideally, future developments should also circumvent the requirements of uniaxial stress and a priori known material orientation, which is (partly) possible by the advent of 3D SWE (Wang et al., 2013). The current set-up for 45° rotation of the ARF with a mechanical arm is impractical to be integrated into daily clinical practice, however this limitation can be overcome by electronically steering the ARF.
4.4. Study limitations
Our study successfully demonstrated the potential of using a tilted ARF axis for advancing material characterization in SWE, though there are a few limitations. First, the chosen clamping system for the experimental set-up did not evoke a completely uniform uniaxial stress, especially closer to the edges of the phantom and the clamps. These local stress variations resulted in differences in shear wave speed estimations between the two shear waves in the experiment, as shown in Fig. 9. Second, the increasing acoustic attenuation for one of the shear waves in the 45° ARF experiment (see Fig. 5) reduced shear wave visibility, which resulted in less accurate shear wave speed estimations. Third, solely uniaxial testing is not sufficient to characterize the constitutive behavior of PVA completely. Multiple mechanical tests or advancing the chosen mechanical test (e.g. perform a biaxial test instead of an uniaxial test) can improve material characterization of hyperelastic materials. Indeed, the Isihara model better described the PVA’s mechanical behavior than the MR and AB material law, but the found parameter set had a fairly wide confidence interval because of the limited available test data. The parameter fitting procedure for the Isihara model used the found parameters for the MR law as input, which allowed the model to realistically represent the shear wave propagation as observed in the experiments.
5. Conclusion
Analyzing multiple shear wave modes using ultrasound-based SWE has potential to advance non-invasive material characterization, which can ultimately contribute to improving disease diagnosis. In this work, we demonstrate for the first time the experimental feasibility to excite and detect both the SH and the SV modes in an uniaxially stretched nonlinear soft solid by tilting the ARF with respect to the material’s symmetry axis. Tilted ARF measurements showed the propagation of a second shear wave mode across the stretch direction for larger stretches (≥160%). Complementary finite element simulations using the material parameters derived from uniaxial mechanical testing revealed the link between shear wave propagation properties and PVA’s mechanical behavior and allowed identification of the optimal constitutive law for PVA in these experiments, i.e. the Isihara model. This combination of SWE experiments and simulations is a promising approach for advanced mechanical material characterization and can be considered an attractive non-invasive alternative for mechanical testing.
6. Acknowledgements
This work was supported by the Flanders Innovation and Entrepreneurship Agency (VLAIO) grant 141010 and the Research Foundation Flanders (FWO) under grants V432118N and 1211620N to Annette Caenen and by the National Institute of Health (NIH) grants R01-EB022106 and R01-CA142824 and NIH Duke Medical Imaging Training Program grant T32 EB001040 to Anna E. Knight, Ned C. Rouze, Nick B. Bottenus and Kathryn R. Nightingale.
Footnotes
Declaration of interests
The authors declare the following financial interests/personal relationships which may be considered as potential competing interests: Some of the authors have intellectual property related to radiation force-based imaging technologies that has been licensed to Siemens, Samsung, and MicroElastic Ultrasound Systems.
Publisher's Disclaimer: This is a PDF file of an unedited manuscript that has been accepted for publication. As a service to our customers we are providing this early version of the manuscript. The manuscript will undergo copyediting, typesetting, and review of the resulting proof before it is published in its final form. Please note that during the production process errors may be discovered which could affect the content, and all legal disclaimers that apply to the journal pertain.
7. References
- Aristizabal S, Amador Carrascal C, Nenadic IZ, Greenleaf JF, Urban MW, 2018. Application of Acoustoelasticity to Evaluate Nonlinear Modulus in Ex Vivo Kidneys. IEEE Trans Ultrason Ferroelectr Freq Control 65, 188–200. [DOI] [PMC free article] [PubMed] [Google Scholar]
- Arruda EM, Boyce MC, 1993. A 3D constitutive model for the large stretch behavior of rubber elastic materials. Journal of the Mechanics and Physics of Solids 41, 389–412. [Google Scholar]
- Barr RG, Nakashima K, Amy D, Cosgrove D, Farrokh A, Schafer F, Bamber JC, Castera L, Choi BI, Chou YH, Dietrich CF, Ding H, Ferraioli G, Filice C, Friedrich-Rust M, Hall TJ, Nightingale KR, Palmeri ML, Shiina T, Suzuki S, Sporea I, Wilson S, Kudo M, 2015. WFUMB guidelines and recommendations for clinical use of ultrasound elastography: Part 2: breast. Ultrasound Med Biol 41, 1148–1160. [DOI] [PubMed] [Google Scholar]
- Bercoff J, Tanter M, Fink M, 2004. Supersonic Shear Imaging: A New Technique for Soft Tissue Elasticity Mapping. IEEE Trans Ultrason Ferroelectr Freq Control 51, 396–409. [DOI] [PubMed] [Google Scholar]
- Bergstrom J, 2015. Elasticity/Hyperelasticity, in: Inc E (Ed.), Mechanics of Solid Polymers. [Google Scholar]
- Bernal M, Chamming’s F, Couade M, Bercoff J, Tanter M, Gennisson JL, 2016. In Vivo Quantification of the Nonlinear Shear Modulus in Breast Lesions: Feasibility Study. IEEE Trans Ultrason Ferroelectr Freq Control 63, 101–109. [DOI] [PubMed] [Google Scholar]
- Boulanger P, Hayes M, 2001. Finite-Amplitude Waves in Mooney-Rivlin and Hadamard Materials. 131–167.
- Caenen A, Pernot M, Peirlinck M, Mertens L, Swillens A, Segers P, 2018. An in silico framework to analyze the anisotropic shear wave mechanics in cardiac shear wave elastography. Physics in medicine and biology. [DOI] [PubMed] [Google Scholar]
- Caenen A, Pernot M, Shcherbakova DA, Mertens L, Kersemans M, Segers P, Swillens A, 2017. Investigating Shear Wave Physics in a Generic Pediatric Left Ventricular Model via In Vitro Experiments and Finite Element Simulations. IEEE Trans Ultrason Ferroelectr Freq Control 64, 349–361. [DOI] [PubMed] [Google Scholar]
- Caenen A, Segers P, Swillens A, 2016. Finite element simulations to support the measurement and analysis of Shear Wave Dispersion, IEEE International Ultrasonics Symposium (IUS) 2016 IEEE, pp. 1–4. [Google Scholar]
- Caenen A, Shcherbakova D, Verhegghe B, Papadacci C, Pernot M, Segers P, Swillens A, 2015. A Versatile and Experimentally Validated Finite Element Model to Assess the Accuracy of Shear Wave Elastography in a Bounded Viscoelastic Medium. IEEE Trans Ultrason Ferroelectr Freq Control 62, 439–450. [DOI] [PubMed] [Google Scholar]
- Catheline S, Gennisson JL, Fink M, 2003. Measurement of elastic nonlinearity of soft solid with transient elastography. J Acoust Soc Am 114, 3087–3091. [DOI] [PubMed] [Google Scholar]
- Chatelin S, Bernal M, Deffieux T, Papadacci C, Flaud P, Nahas A, Boccara C, Gennisson JL, Tanter M, Pernot M, 2014. Anisotropic polyvinyl alcohol hydrogel phantom for shear wave elastography in fibrous biological soft tissue: a multimodality characterization. Phys Med Biol 59, 6923–6940. [DOI] [PubMed] [Google Scholar]
- Couade M, Pernot M, Messas E, Bel A, Ba M, Hagege A, Fink M, Tanter M, 2011. In vivo quantitative mapping of myocardial stiffening and transmural anisotropy during the cardiac cycle. IEEE Trans Med Imaging 30, 295–305. [DOI] [PubMed] [Google Scholar]
- Couade M, Pernot M, Prada C, Messas E, Emmerich J, Bruneval P, Criton A, Fink M, Tanter M, 2010. Quantitative assessment of arterial wall biomechanical properties using shear wave imaging. Ultrasound Med Biol 36, 1662–1676. [DOI] [PubMed] [Google Scholar]
- Ferraioli G, Parekh P, Levitov AB, Filice C, 2014. Shear wave elastography for evaluation of liver fibrosis. J Ultrasound Med 33, 197–203. [DOI] [PubMed] [Google Scholar]
- Gao L, Parker KJ, Alam SK, 1995. Sonoelasticity imaging: Theory and experimental verification. J Acoust Soc Am 97, 3875–3886. [DOI] [PubMed] [Google Scholar]
- Gennisson JL, Deffieux T, Mace E, Montaldo G, Fink M, Tanter M, 2010. Viscoelastic and anisotropic mechanical properties of in vivo muscle tissue assessed by supersonic shear imaging. Ultrasound Med Biol 36, 789–801. [DOI] [PubMed] [Google Scholar]
- Gennisson JL, Renier M, Catheline S, Barriere C, Bercoff J, Tanter M, Fink M, 2007. Acoustoelasticity in soft solids: assessment of the nonlinear shear modulus with the acoustic radiation force. J Acoust Soc Am 122, 3211–3219. [DOI] [PubMed] [Google Scholar]
- Goenezen S, Dord JF, Sink Z, Barbone PE, Jiang J, Hall TJ, Oberai AA, 2012. Linear and nonlinear elastic modulus imaging: an application to breast cancer diagnosis. IEEE Trans Med Imaging 31, 1628–1637. [DOI] [PMC free article] [PubMed] [Google Scholar]
- Horgan CO, Smayda MG, 2012. The importance of the second strain invariant in the constitutive modeling of elastomers and soft biomaterials. Mechanics of Materials 51, 43–52. [Google Scholar]
- Isihara A, Hashitsume N, Tatibana M, 1951. Statistical Theory of Rubber-Like Elasticity. IV. (Two-Dimensional Stretching). The Journal of Chemical Physics 19, 1508–1512. [Google Scholar]
- Kanai H, 2005. Propagation of spontaneously actuated pulsive vibration in human heart wall and in vivo viscoelasticity estimation. IEEE Trans Ultrason Ferroelectr Freq Control 52, 1931–1942. [DOI] [PubMed] [Google Scholar]
- Kasai C, Namekawa K, Koyano A, Omoto R, 1985. Real-Time Two-Dimensional Blood Flow Imaging Using an Autocorrelation Technique. IEEE Trans Sonics Ultrasonics SU-32, 458–464. [Google Scholar]
- Kersemans MM, A.; Degrieck J; Van Den Abeele K; Delrue S; Pyl L; Zastavnik F; Sol H; Van Paepegem W, 2016. The ultrasonic polar scan for composite characterization and damage assessment - Past, Present and Future. Applied Sciences 6, 1–15. [Google Scholar]
- Kocbach J, 2000. Finite element modeling of ultrasonic piezoelectric transducers, Departement of Physics. Uniersity of Bergen, Bergen, Norway. [Google Scholar]
- Konofagou EE, Hynynen K, 2003. Localized harmonic motion imaging: theory, simulations and experiments. Ultrasound in Medicine & Biology 29, 1405–1413. [DOI] [PubMed] [Google Scholar]
- Latorre-Ossa H, Gennisson JL, De Brosses E, Tanter M, 2012. Quantitative imaging of nonlinear shear modulus by combining static elastography and shear wave elastography. IEEE Trans Ultrason Ferroelectr Freq Control 59, 833–839. [DOI] [PubMed] [Google Scholar]
- Montaldo G, Tanter M, Bercoff J, Benech N, Fink M, 2009. Coherent Plane-Wave Compounding for Very High Frame Rate Ultrasonography and Transient Elastography IEEE Trans Ultrason Ferroelectr Freq Control 56, 489–506. [DOI] [PubMed] [Google Scholar]
- Mooney M, 1940. A Theory of Large Elastic Deformation. Journal of Applied Physics 11, 582–592. [Google Scholar]
- Nenadic IZ, Urban MW, Mitchell SA, Greenleaf JF, 2011. Lamb wave dispersion ultrasound vibrometry (LDUV) method for quantifying mechanical properties of viscoelastic solids. Phys Med Biol 56, 2245–2264. [DOI] [PMC free article] [PubMed] [Google Scholar]
- Nightingale K, 2011. Acoustic Radiation Force Impulse (ARFI) Imaging: a Review. Curr Med Imaging Rev 7, 328–339. [DOI] [PMC free article] [PubMed] [Google Scholar]
- Nightingale KR, Palmeri ML, Nightingale RW, Trahey GE, 2001. On the feasibility of remote palpation using acoustic radiation force. J Acoust Soc Am 110, 625–634. [DOI] [PubMed] [Google Scholar]
- Ophir J, Alam SK, Garra B, Kallel F, Konofagou E, Krouskop T, Merritt CRB, Righetti R, Souchon R, Srinivasan S, Varghese T, 2002. Elastography: Imaging the elastic properties of soft tissues with ultrasound. J Med Ultrasonics 29, 155–171. [DOI] [PubMed] [Google Scholar]
- Palmeri M, Deng Y, Rouze N, Nightingale K, 2014. Dependence of shear wave spectral content on acoustic radiation force excitation duration and spatial beamwidth. IEEE Trans Ultrason Ferroelectr Freq Control. [Google Scholar]
- Palmeri M, Sharma AC, Bouchard RR, Nightingale R, Nightingale K, 2005. A Finite-Element Method Model of Soft Tissue Response to Impulsive Acoustic Radiation Force. IEEE Trans Ultrason Ferroelectr Freq Control 52. [DOI] [PMC free article] [PubMed] [Google Scholar]
- Rivlin RS, 1948. Large elastic deformations of isotropic materials. IV. Furhter developments of the general theory. Philosophical Transactions of the Royal Society A: Mathematical, Physical and Engineering Sciences 241, 379–397. [Google Scholar]
- Rivlin RS, Saunders DW, 1951. Large Elastic Deformations of Isotropic Materials. VII. Experiments on the Deformation of Rubber. Philosophical Transactions of the Royal Society A: Mathematical, Physical and Engineering Sciences 243, 251–288. [Google Scholar]
- Rouze N, Wang HM, Palmeri M, Nightingale K, 2010. Robust estimation of time of flight shear wave speed using a radon sum transformation. IEEE Trans Ultrason Ferroelectr Freq Control 57, 2662–2670. [DOI] [PMC free article] [PubMed] [Google Scholar]
- Rouze NC, Deng Y, Palmeri ML, Nightingale KR, 2016. Robust characterization of viscoelastic materials from measurements of group shear wave speeds, IEEE International Ultrasonics Symposium (IUS) 2016 IEEE, pp. 1–4. [Google Scholar]
- Rouze NC, Palmeri ML, Nightingale KR, 2019. Tractable calculation of the Green’s tensor for shear wave propagation in an incompressible, transversely isotropic material. Phys Med Biol. [DOI] [PMC free article] [PubMed] [Google Scholar]
- Rouze NC, Wang MH, Palmeri ML, Nightingale KR, 2013. Finite element modeling of impulsive excitation and shear wave propagation in an incompressible, transversely isotropic medium. J Biomech 46, 2761–2768. [DOI] [PMC free article] [PubMed] [Google Scholar]
- Sarvazyan AP, Rudenko OV, Swanson SD, Fowlkes JB, Emelianov SY, 1998. Shear Wave Elasticity Imaging: a New Ultrasonics Technology of Medical Diagnostics. Ultrasound Med Biol 24, 1419–1435. [DOI] [PubMed] [Google Scholar]
- Shcherbakova DA, Papadacci C, Swillens A, Caenen A, De Bock S, Saey V, Chiers K, Tanter M, Greenwald SE, Pernot M, Segers P, 2014. Supersonic Shear Wave Imaging to Assess Arterial Nonlinear Behavior and Anisotropy: Proof of Principle via Ex Vivo Testing of the Horse Aorta. Advances in Mechanical Engineering 6, 1–12. [Google Scholar]
- Simulia DS, 2017. Abaqus 2017 documentation, Providence, RI. [Google Scholar]
- Surry KJM, Austin HJB, Fenster A, Peters TM, 2004. Poly(vinyl alcohol) cryogel phantoms for use in ultrasound and MR imaging. Phys Med Biol 49, 5529–5546. [DOI] [PubMed] [Google Scholar]
- Urban MW, Chen S, Fatemi M, 2012. A Review of Shearwave Dispersion Ultrasound Vibrometry (SDUV) and its applications. Curr Med Imaging Rev 8, 27–36. [DOI] [PMC free article] [PubMed] [Google Scholar]
- Urban MW, Lopera M, Aristizabal S, Amador C, Nenadic I, Kinnick RR, Weston AD, Qiang B, Zhang X, Greenleaf JF, 2015. Characterization of transverse isotropy in compressed tissue-mimicking phantoms. IEEE Trans Ultrason Ferroelectr Freq Control 62, 1036–1046. [DOI] [PMC free article] [PubMed] [Google Scholar]
- Villemain O, Correia M, Mousseaux E, Baranger J, Zarka S, Podetti I, Soulat G, Damy T, Hagège A, Tanter M, 2018. Myocardial Stiffness Evaluation Using Noninvasive Shear Wave Imaging in Healthy and Hypertrophic Cardiomyopathic Adults. JACC: Cardiovascular Imaging. [DOI] [PMC free article] [PubMed] [Google Scholar]
- Wang M, Byram B, Palmeri M, Rouze N, Nightingale K, 2013. Imaging transverse isotropic properties of muscle by monitoring acoustic radiation force induced shear waves using a 2-D matrix ultrasound array. IEEE Trans Med Imaging 32, 1671–1684. [DOI] [PMC free article] [PubMed] [Google Scholar]
- Wineman A, 2005. Some results for generalized neo-Hookean elastic materials. International Journal of Non-Linear Mechanics 40, 271–279. [Google Scholar]


