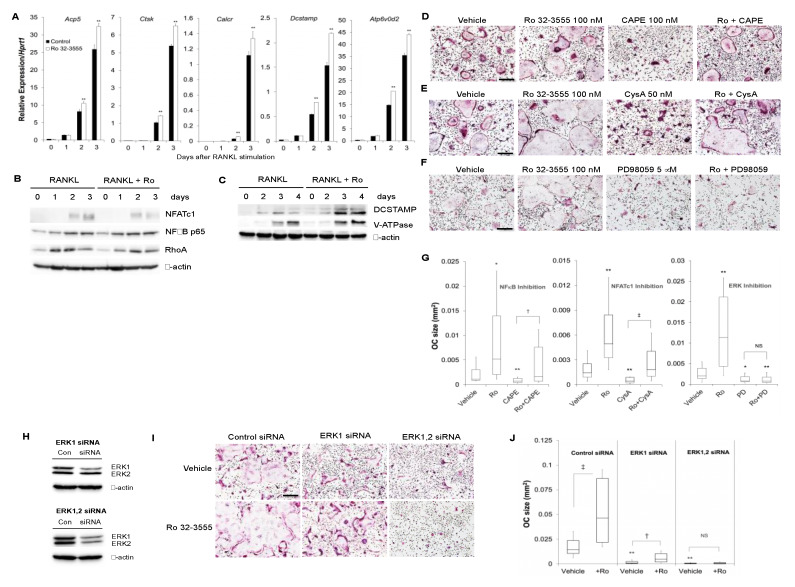
Figure 4.
Signaling pathways involved in the increased osteoclast size after collagenase inhibition. (A) Control or Ro 32-3555-treated (100 nM) cells were subjected to the real-time RT-PCR analyses for the expression of osteoclast marker genes, TRAP (Acp5), Cathepsin K (Ctsk), Calcitonin Receptor (Calcr), Dcstamp, and v-ATPase (Atp6v0d2). (B and C) BMMs were cultured with M-CSF and RANKL for indicated days in the absence or presence of 100 nM Ro 32-3555. Western blot analyses were performed using cell lysates to examine the expression of proteins involved in osteoclast differentiation and fusion. (D–F) BMMs were cultured for 5 days with M-CSF and RANKL. The effect of NFκB inhibitor caffeic acid phenetyl ester (CAPE) (D), nuclear factor of activated T-cells, cytoplasmic 1 (NFATc1) inhibitor cyclosporin A (E), and ERK inhibitor PD98059 (F) on osteoclast size in Ro 32-3555-stimulated cells was tested by TRAP staining. (G) The osteoclast size was measured from experiments in (D–F). (H) BMMs were transfected with ERK1 siRNA (upper panel) or ERK1 and ERK2 siRNA (lower panel). The expression of ERK1 and ERK2 was examined by Western blot after 48 h incubation in the presence of M-CSF. (I) Cells in (H) were incubated with M-CSF and RANKL for 4 days in the presence or absence of 100 nM Ro 32-3555 before TRAP staining. (J) The size of osteoclasts in (I) was measured. Data are mean ± SD representative of three independent experiments. *, p < 0.05. **, p < 0.01 versus control. †, p < 0.05. ††, p < 0.01 between inhibitor-treated groups. Scale bars indicate 100 μm.

