

Abstract
Several post-translational modifications figure prominently in ventricular remodeling. The beta-O-linkage of N-acetylglucosamine (O-GlcNAc) to proteins has emerged as an important signal in the cardiovascular system. Although there are limited insights about the regulation of the biosynthetic pathway that gives rise to the O-GlcNAc post-translational modification, much remains to be elucidated regarding the enzymes, such as O-GlcNAc transferase (OGT) and O-GlcNAcase (OGA), which regulate the presence/absence of O-GlcNAcylation. Recently, we showed that the transcription factor, E2F1, could negatively regulate OGT and OGA expression in vitro. The present study sought to determine whether E2f1 deletion would improve post-infarct ventricular function by de-repressing expression of OGT and OGA. Male and female mice were subjected to non-reperfused myocardial infarction (MI) and followed for 1 or 4 week. MI significantly increased E2F1 expression. Deletion of E2f1 alone was not sufficient to alter OGT or OGA expression in a naïve setting. Cardiac dysfunction was significantly attenuated at 1-week post-MI in E2f1-ablated mice. During chronic heart failure, E2f1 deletion also attenuated cardiac dysfunction. Despite the improvement in function, OGT and OGA expression was not normalized and protein O-GlcNAcyltion was not changed at 1-week post-MI. OGA expression was significantly upregulated at 4-week post-MI but overall protein O-GlcNAcylation was not changed. As an alternative explanation, we also performed guided transcriptional profiling of predicted targets of E2F1, which indicated potential differences in cardiac metabolism, angiogenesis, and apoptosis. E2f1 ablation increased heart size and preserved remote zone capillary density at 1-week post-MI. During chronic heart failure, cardiomyocytes in the remote zone of E2f1-deleted hearts were larger than wildtype. These data indicate that, overall, E2f1 exerts a deleterious effect on ventricular remodeling. Thus, E2f1 deletion improves ventricular remodeling with limited impact on enzymes regulating O-GlcNAcylation.
Keywords: Heart failure, Metabolism, Hexosamine biosynthetic pathway, Glycosylation
Introduction
The failing heart undergoes numerous metabolic changes [7, 10]. Although many studies have addressed how changes in substrate utilization may underlie the pathophysiology of heart failure, few have addressed the role of ancillary biosynthetic pathways. Of the several collateral pathways of glucose metabolism, the hexosamine biosynthetic pathway (HBP) has emerged as an important player in a variety of diseases [4, 8, 9, 15, 16, 24, 28, 34]. The HBP culminates in the formation of UDP-GlcNAc, some of which is used to generate the beta-O-linkage of N-acetylglucosamine (i.e., O-GlcNAc) modification on serine and threonine residues of proteins. This post-translational modification has been implicated as a protective signal in acute cardiomyocyte injury in vitro and in vivo [3, 11–13, 20]. Furthermore, we have shown that this modification has a role in the failing heart [28]. The role of O-GlcNAc in other diseases has also received significant attention [17]. Yet, the details regarding the regulation of O-GlcNAc are lacking.
Because of this gap in knowledge, we have been investigating the molecular regulation of the enzymes controlling O-GlcNAcylation [18, 19]. Two genes give rise to the enzymes that regulate protein O-GlcNAcylation. O-GlcNAc transferase (OGT) adds the GlcNAc modification to proteins, while O-GlcNAcase (OGA) removes the modification. Others have viewed protein O-GlcNAcylation as essentially a passive readout of extracellular glucose levels; however, this is not always true because we and others have shown that there is not a simple linear relationship between nutrient availability and O-GlcNAcylation [18, 19, 35]. Thus, other factors may regulate the relative activities of OGT and OGA. Furthermore, the expression of OGT and OGA changes during various pathologic conditions [21, 22, 28, 35]. Yet, the transcriptional regulation of OGT and OGA has received relatively limited attention. At present, little is known about the regulation of OGT and OGA expression in the heart—particularly in the failing heart. In addition, the findings from this line of inquiry could have important implications in other conditions where these enzymes are dysregulated such as diabetes, neurodegeneration, and cancer.
Recently, our group identified candidates (i.e., miRNA and transcription factor) that may regulate OGT and OGA expression [18]. Of the candidate transcription factors, we identified E2F1 as a potential negative regulator of OGT and OGA expression [19]. Although we provided evidence that E2F1 binds to the presumptive promoter regions of Ogt and Mgea5 (i.e., gene for OGA) and could negatively impact expression at the protein level in a cell line, it was not clear whether such observations extend to the intact heart. More importantly, it was also not known whether evidence of such regulation was present during heart failure. Thus, the goal of the present study was to test the hypothesis that deletion of E2F1 improves cardiac function by de-repressing expression of OGT and OGA. Our findings revealed that deletion of E2f1 improved ventricular function after MI, possibly through increased capillary density; however, with limited impact on OGT and OGA expression.
Methods
All animal procedures were performed in accordance with the National Institutes of Health Guide for the Care and Use of Laboratory Animals and were approved by the University of Louisville Institutional Animal Care and Use Committee.
Animal breeding
E2f1−/− mice (stock number: 002785, The Jackson Laboratory) were crossed with wildtype C57BLK6J mice to generate E2f1+/− mice. E2f1+/− mice were crossed to generate homozygous deficient and homozygous wild-type (E2f1+/+) littermates, which were used for this study.
Echocardiography
Transthoracic echocardiography of the left ventricle was performed as described previously [23, 28, 33]. The sonographer was blinded to mouse genotype.
Myocardial Infarction
E2f1−/− and E2f1+/+ littermates aged 10- to 16-week-old mice (both sexes) were subjected to non-reperfused myocardial infarction (MI) as previously described [23, 28, 33]. Mice were followed up to 4 weeks. Briefly, mice were anesthetized with intra-peritoneal injections of ketamine hydrochloride (50 mg/kg) and sodium pentobarbital (50 mg/kg). Mice were orally intubated and ventilated with oxygen. A 7-0 silk suture was passed under the left coronary artery and tied. The chest and skin were closed. Mice were extubated upon recovery of spontaneous breathing. Analgesia (ketoprofen, 5 mg/kg) was provided prior to recovery and by 24 and 48 h post-surgery. The surgeon was blinded to mouse genotype. Seven days after MI, all mice were subjected to an echocardiogram to confirm sufficient depression of cardiac function (LVEF < 60%). Any mouse with LVEF > 60% was excluded from the study.
Pathology
Following final echocardiography, hearts were excised and arrested in diastole with KCl. Hearts were then sectioned into 1 mm short-axis sections. A mid-ventricular section was fixed with formalin, deparaffinized, and rehydrated. The microscopist was blinded to group assignment.
Cardiomyocyte hypertrophy
Cardiac sections were stained with wheat germ agglutinin (WGA; AlexaFluor 555 conjugate; Invitrogen) to identify cell borders, and DAPI to detect nuclei. WGA-stained cells were visualized using a Nikon TE-2000E microscope interfaced with a Nikon A1 confocal system. Cell areas were measured using Nikon Elements software [64-bit version 3.22.00 (Build 710)]. Cardiomyocytes were chosen based on their circularity and whether they had centrally located nuclei. Circularity was calculated using the Shape Factor feature in NIS-Elements AR 4.0. Cardiomyocytes were chosen based on a Shape Factor between 1.0 and 0.895 (radius ratio of 1:1–1:1.4).
Cardiac apoptosis
A TUNEL assay kit (TB235, Promega Corporation) was used according to the manufacturer’s instructions on LV sections. Sections were also stained with DAPI to identify nuclei. Sections were imaged using a Nikon Eclipse Ti using a 20× objective. TUNEL positivity was calculated by dividing the total number of TUNEL-positive cells by the number of nuclei.
Capillary density
Cardiac sections were stained with isolectin B4 (Fluorescein labeled Griffonia Simplicifolia Lectin I, Vector Labs) as we have previously described [33]. Capillary density was determined by dividing the total number of isolectin B4-positive vessels by the area of the image (number of capillaries/mm2).
Cardiac fibrosis
Cardiac sections were stained with Fast Green (EMD) and Sirius Red (Roboz) using previously published protocols [6, 28]. Fibrosis was expressed as a percentage of scar tissue divided by the total area of tissue.
Reverse transcriptase PCR and real-time PCR
The total RNA from the LV was extracted and used to make cDNA as previously described [2, 5, 28, 29]. The relative levels of mRNA transcripts were quantified by real-time PCR using Power SYBR Green (Thermo Fisher Scientific) on a real-time PCR system (ABI 7900 HT, Applied Biosciences). Most primers were made using NCBI Primer Blast except HPRT primers (PPM03559E-200, QIAGEN) and those referenced (Supplementary Table 1). To verify ablation of E2f1, a primer was designed to target the deleted exon 4 in E2f1−/− mice. The data were normalized to mouse HPRT mRNA threshold cycle (CT) values using the ΔΔCT comparative method. Primer sequences are listed in Table S1.
Protein isolation
Protein was harvested from LV tissue as described previously. Protein concentrations were determined by Bradford assay with Bio-Rad protein assay dye reagent (Bio-Rad Laboratories) using different concentrations of bovine serum albumin as standards. Protein concentrations were measured with a Thermo Multiskan Spectrum spectrophotometer.
Immunoblotting
Protein samples were subjected to electrophoresis in SDS-PAGE gels (4–12%, Invitrogen) and transferred to PVDF membrane (Immobilon-P, EMD Millipore) at 4 °C. For O-GlcNAc immunoblotting, membranes were allowed to dry at room temperature for 1 h. The blot was then probed with primary antibody against O-GlcNAc (clone: RL2; 1:1000, Affinity Bioreagents) in PBS-casein (Bio-Rad Laboratories) overnight at 4 °C. Membranes were washed three times with 1× PBS. Membranes were incubated at room temperature with secondary antibody (goat anti-mouse IgG-HRP; 1:4000, sc-2005; Santa Cruz Biotechnology) in PBS-casein. Membranes were again washed three times with 1× PBS and then imaged. All other western blotting followed standard protocols. Briefly, membranes were blocked at room temperature using Tris-buffered saline pH 7.5 (TBS) containing nonfat milk (5%), washed with TBS containing Tween-20 (TBS-T, 0.1%), and probed with primary antibody. Antibodies for OGT (D1D8Q—1:2000, Cell Signaling), OGA (NCOAT—1:1000, Santa Cruz Biotechnology), E2F1 (SC-193—1:1000, Santa Cruz Biotechnology), and α-tubulin (T6074—1:2000, Sigma-Aldrich) were made in TBS containing nonfat milk (1%). After overnight incubation at 4 °C, blots were washed in TBS containing Tween-20 (TBS-T, 0.1%). The blots were blocked for 15 min in TBS-T containing 1% milk, washed, and then incubated with goat anti-rabbit IgG-HRP (sc-2004; Santa Cruz Biotechnology or 7074; Cell Signaling Technology) or goat anti-mouse IgG-HRP (Santa Cruz Biotechnology), in 1:2000 dilution (for OGT, OGA, and α-tubulin). After washing three times with TBS-T, the membrane was saturated with SuperSignal West Pico Chemiluminescent Substrate (Thermo Fisher Scientific) and imaged on a Fuji LAS-3000 bio-imaging analyzer. To confirm the linear range of the signal, multiple exposures from every experiment were performed. Each lane was normalized to a control protein (α-tubulin) or total protein content (via Ponceau stain) and expressed as relative to control (set as 100%).
Statistical analysis
Results are shown as mean ± SD. Statistical analysis (GraphPad 5.0d) was conducted using a two-tailed Student’s t test or by one-way ANOVA followed by Newman-Keuls multiple comparison test, when appropriate. A log-rank test was used to determine significance from Kaplan-Meier survival curves. To determine potential differences in cardiac function between sex and genotype, a two-way ANOVA with interaction followed by a Bonferroni post-test was used. Differences were considered statistically significant if p < 0.05.
Results
Myocardial infarction upregulated E2F1 expression
Cardiac tissue from acute (1 week) and chronic (4 week) sham and heart failure mice was harvested. E2F1 mRNA and protein were upregulated at 1-week post-MI (Fig. 1a, c) and at 4-week post-MI (Fig. 1c). To determine the spatial expression of E2F1 in heart failure, we separated sham and infarcted hearts at 1 and 4 weeks into separate regions: LV-infarcted, LV-remote, and RV. The greatest induction of E2F1 expression was found in the infarcted regions of the heart (Fig. 1b, e). E2F1 expression is upregulated acutely and chronically during heart failure. We next answered the question whether loss of E2F1 expression would improve cardiac function following MI.
Fig. 1.
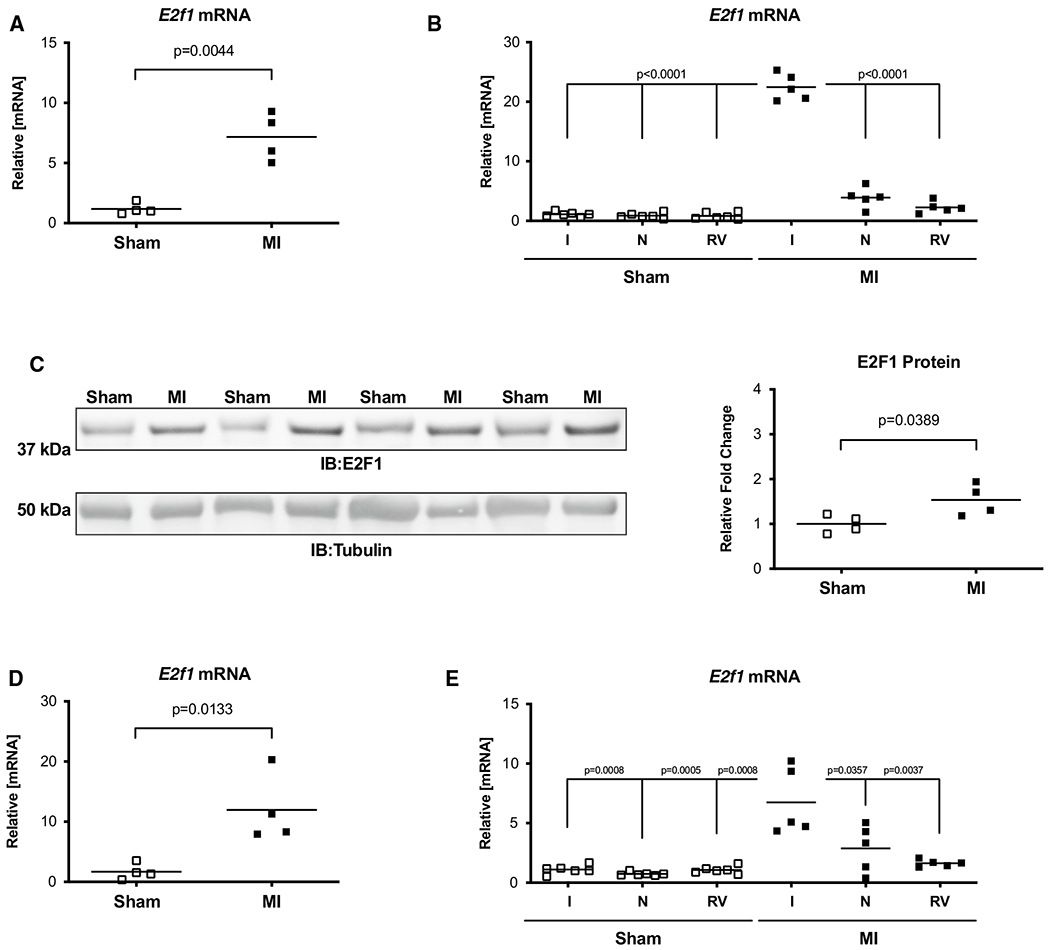
E2F1 is upregulated during heart failure. Male mice aged 10–16 weeks were subjected to sham or myocardial infarction surgery for 1 or 4 week. E2f1 mRNA expression was assessed in whole sham (n = 4) and MI (n = 4) hearts 1 week following MI (a; p = 0.0044 vs Sham). A separate cohort of sham (n = 6) and MI (n = 5) mice was used to spatially determine E2f1 mRNA expression in infarcted (I), non-infarcted (N), and right ventricle (RV) regions of sham and infarcted mice at 1-week post-MI (b). Western blot of E2F1 protein expression and densitometric analysis (c; p = 0.0389 vs Sham). E2f1 mRNA expression in whole Sham and MI hearts 4 weeks following MI (d; p = 0.0133 vs sham). Region-specific expression of E2f1 mRNA in sham (n = 6) and MI (n = 5) hearts 4 week after MI (e). E2F1 immunoblot and densitometric analysis of whole sham and MI hearts 4 weeks following MI (f). An unpaired Student’s t test was used to determine significance between Sham and MI groups. Oneway ANOVA followed by a Newman–Keuls multiple comparison test analysis was used to determine significance between region-specific expression of E2f1
E2f1−/− mice had normal cardiac function at baseline
Naïve E2f1−/− and E2f1+/+ littermates were subjected to echocardiography at 10–16 weeks of age to establish whether E2f1 deletion per se improves cardiac function. These data revealed slight reductions in fractional shortening (Table 1) and ejection fraction in E2f1−/− mice. As expected, E2F1 mRNA was markedly reduced in in E2f1−/− hearts (Fig. 2a). Loss of E2f1 did not affect the gene expression of selected metabolic markers under naïve conditions (Fig. 2b). Heart weight was similar between E2f1+/+ and E2f1−/− groups (Fig. 2c, d). Protein expression of OGT and OGA was determined (Fig. 2e, f); total protein O-GlcNAcylation was measured (Fig. 2g). There were no differences in expression of OGT, OGA, or overall protein O-GlcNAcylation. Thus, ablation of E2F1 does not produce a significant cardiac phenotype or alter O-GlcNAc signaling in surgically naïve mice. Given this observation, we next determined whether loss of E2f1 improves post-infarct ventricular function.
Table 1.
Loss of E2f1 does not promote cardiac dysfunction in naïve
| E2f1+/+ | E2f1−/− | |
|---|---|---|
| EDV (μL) | 43 ± 9 | 44 ± 9 |
| ESV (μL) | 11 ± 4 | 13 ± 4 |
| EF (%) | 74 ± 6 | 71 ± 6* |
| HR (bpm) | 495 ± 43 | 478 ± 36 |
| SV (μL) | 32 ± 6 | 31 ± 6 |
| CO (mL/min) | 16 ± 3 | 15 ± 3 |
| LVIDd (mm) | 3.7 ± 0.3 | 3.8 ± 0.3 |
| LVIDs (mm) | 2.0 ± 0.3 | 2.2 ± 0.3* |
| FS (%) | 46 ± 5 | 41 ± 6* |
| LVPWd (mm) | 0.8 ± 0.1 | 0.8 ± 0.1 |
| LVPWs (mm) | 1.5 ± 0.2 | 1.3 ± 0.2* |
| LVAWd (mm) | 1.0 ± 0.1 | 1.0 ± 0.1 |
| LVAWs (mm) | 1.5 ± 0.2 | 1.5 ± 0.2 |
Male and female E2f1−/− (n = 29) and their E2f1+/+ (n = 31) littermates were subjected to echocardiography at 10–16 weeks of age. Indices of cardiac function were assessed. Naïve E2f1−/− mice demonstrated higher left ventricular systolic inner diameter (LVIDs, p = 0.0095) and slightly lower fractional shortening (FS, p = 0.0032) and ejection fraction (EF, p = 0.0205) compared to E2f1+/+ mice. Left ventricular diastolic posterior wall diameter was slightly shorter (LVPWd, p = 0.0009). There were no changes in left ventricular diastolic inner diameter (LVIDd), end diastolic volume (EDV), end systolic volume (ESV), stroke volume (SV), heart rate (HR), or cardiac output (CO), diastolic or systolic left ventricular anterior wall diameter (LVAWd, LVAWs), and diastolic left ventricular posterior wall diameter (LVPWd). An unpaired Student’s t test was used to determine significance between E2f1+/+ and E2f1−/− groups
Fig. 2.
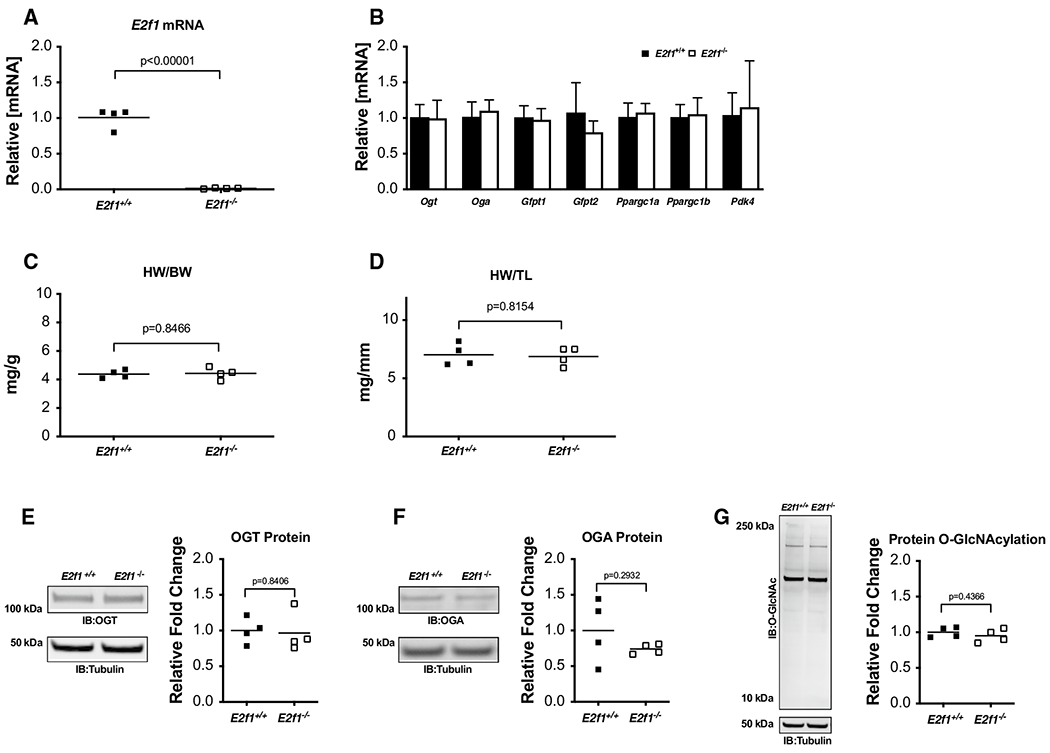
E2F1 deficiency in naïve mice does not affect O-GlcNAcylation or cardiac mass. Cardiac tissue from naïve, male E2f1+/+(n = 4) and E2f1−/−(n = 4) mice was harvested at 10–16 weeks of age. E2f1 mRNA expression in E2f1+/+ and E2f1−/− hearts (a; p < 0.00001). Expression of markers of HBP and metabolism (b). Gravimetric analysis of heart weight to body weight (c) and heart weight to tibia length (d). Cardiac expression of OGT (e), OGA (f), total protein O-GlcNAcylation (g). An unpaired Student’s t test was used to determine significance between E2f1+/+ and E2f1−/− groups
Deletion of E2f1 in male mice attenuated early cardiac dysfunction following myocardial infarction
To determine the role of E2f1 deficiency during HF, E2f1−/− and E2f1+/+ littermates were subjected to MI and followed for 1 or 4 week. We used echocardiography to assess cardiac function at each time point 1 week (Fig. 3 and Table 2) and 4-week post-MI (Fig. 6 and Table 3). Representative M-mode echocardiograms (Fig. 3a) indicated LV dilation in E2f1+/+ hearts 1 week following MI. Interestingly, E2f1−/− mice had a significant preservation of ventricular function at 1-week post-MI, though survival was unaffected (Supplemental Figure 1A). Both LV diastolic (Fig. 3b) and systolic volumes (Fig. 3c) were decreased compared to E2f1+/+ ejection fraction (Fig. 3d) was significantly elevated in E2f1−/− mice. E2f1−/− hearts had no differences in heart rate, stroke volume, or cardiac output (Table 2). Diastolic and systolic inner ventricular diameters were significantly increased in E2f1+/+ hearts (Table 2). Fractional shortening was significantly greater in E2f1−/− hearts (Table 2). To determine whether sex was a significant variable in this study, we examined potential sex differences within the E2f1+/+ and E2f1−/− mice. Interestingly, the significant improvement in cardiac function was limited to E2f1−/− male mice (Supplemental Table 1). Thus, E2f1−/− in male mice, but not female mice, attenuates ventricular dilation and dysfunction at 1 week following MI.
Fig. 3.
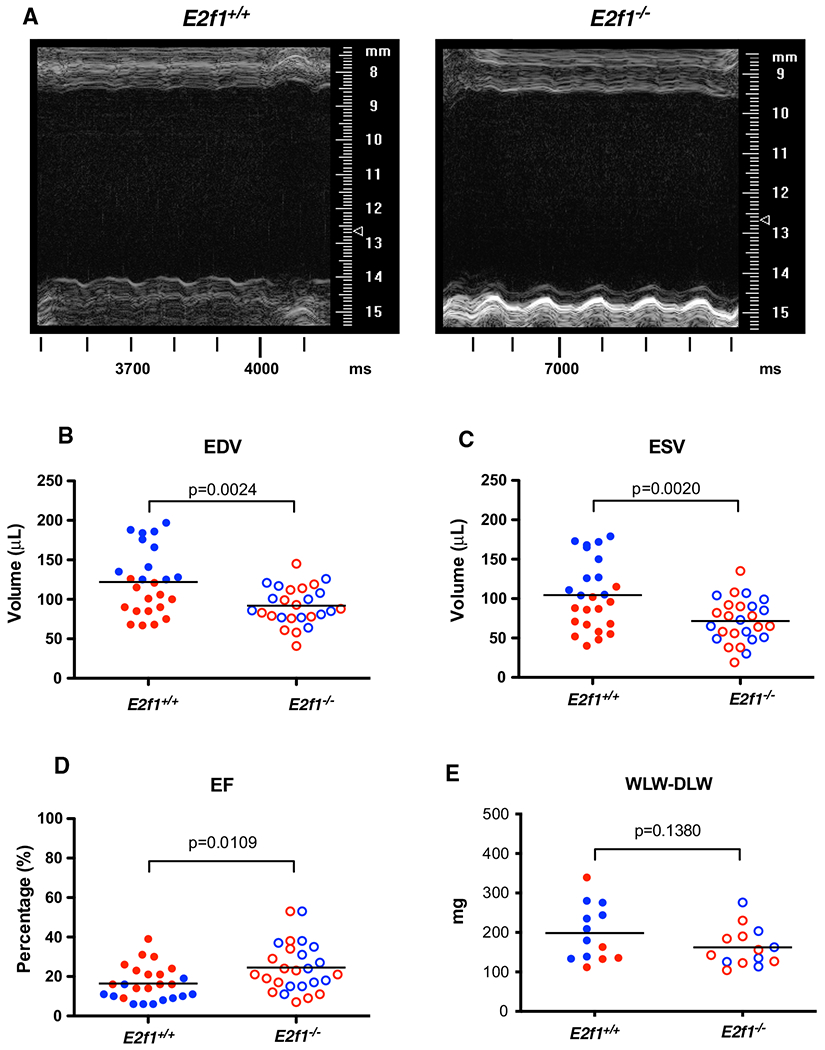
E2f1 deficiency attenuates cardiac dysfunction in male mice 1-week post-MI. Male (blue) and female (red) E2f1+/+(n = 25) and E2f1+/+(n = 26) were subjected to echocardiography after 1-week post-MI. Representative m-mode images of E2f1+/+ and E2f1−/− hearts (a). Ablation of E2f1 attenuated acute heart failure as indicated by reduction in ventricular end-diastolic (b; p = 0.0024) and end-systolic (c; p = 0.0020) volumes and a concomitant improvement of ejection fraction (d; p = 0.0109). Gravimetric analysis of wet versus dry lung weight indicated no differences in pulmonary edema between E2f1+/+ and E2f1−/− groups (e). An unpaired Student’s t test was used to determine significance between E2f1+/+ and E2f1−/− groups
Table 2.
E2f1 deficiency attenuates acute ventricular dilation and dysfunction
| E2f1+/+ | E2f1−/− | |
|---|---|---|
| HR (bpm) | 548 ± 45 | 523 ± 45 |
| SV (μL) | 17 ± 5 | 20 ± 7 |
| CO (mL/min) | 9 ± 2 | 10 ± 3 |
| LVIDd (mm) | 5.5 ± 1 | 5.0 ± 0.7* |
| LVIDs (mm) | 5.1 ± 1.2 | 4.3 ± 1.0* |
| FS (%) | 9 ± 7 | 14 ± 10* |
| LVPWd (mm) | 0.7 ± 0.3 | 0.7 ± 0.3 |
| LVPWs (mm) | 0.8 ± 0.4 | 0.9 ± 0.5 |
| LVAWd (mm) | 0.6 ± 0.3 | 0.8 ± 0.4* |
| LVAWs (mm) | 0.7 ± 0.4 | 0.9 ± 0.5* |
Male and female E2f1−/− (n = 25) and their E2f1+/+ (n = 26) littermates were subjected to echocardiography 1 week after MI. Indices of cardiac function were assessed. E2f1−/− mice demonstrated shorter left ventricular diastolic and systolic inner diameter (LVIDd; p = 0.0268 and LVIDs; p = 0.0202) and higher lower fractional shortening (FS, p = 0.0437) compared to E2f1+/+ mice. There were no changes in stroke volume (SV), heart rate (HR), or cardiac output (CO), diastolic or systolic left ventricular anterior wall diameter (LVAWd, LVAWs), diastolic or systolic left ventricular posterior wall diameter (LVPWd, LVPWs) between groups. An unpaired Student’s t test was used to determine significance between E2f1+/+ and E2f1−/− groups
Fig. 6.
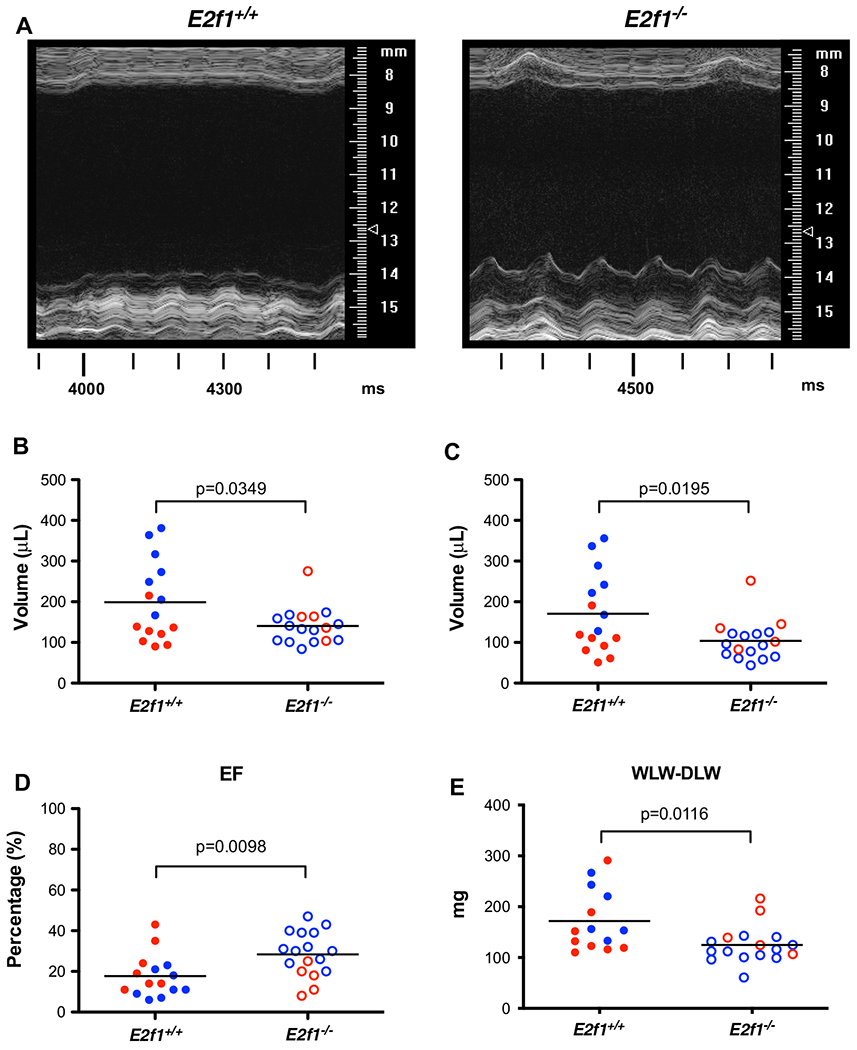
E2f1 deficiency promotes durable improvement in ventricular function in male mice. Male (blue) and female (red) E2f1+/+ (n = 15) and E2f1+/+ (n = 17) were subjected to echocardiography after 4 weeks of non-reperfused myocardial infarction. Representative m-mode images of E2f1+/+ and E2f1−/− hearts (a). Ablation of E2f1 attenuated chronic heart failure as evidenced by reduction in ventricular end-diastolic (b, p = 0.0349) and end-systolic (c, p = 0.0195) volumes and a concomitant attenuation of ejection fraction (d, p = 0.0098) compared to E2f1+/+. Gravimetric analysis of wet versus dry lung weight indicated increased water retention in the lungs between E2f1+/+ and E2f1−/− groups (e, p = 0.0116). An unpaired Student’s t test was used to determine significance between E2f1+/+ and E2f1−/− groups
Table 3.
E2f1 deficiency attenuates ventricular dysfunction in the failing heart
| E2f1+/+ | E2f1−/− | |
|---|---|---|
| HR (bpm) | 542 ± 54 | 497 ± 41* |
| SV (μL) | 28 ± 7 | 36 ± 10* |
| CO (mL/min) | 15 ± 3 | 18 ± 5 |
| LVIDd (mm) | 6.3 ± 1.2 | 5.6 ± 0.7 |
| LVIDs (mm) | 5.8 ± 1.5 | 5.0 ± 0.9 |
| FS (%) | 8 ± 6 | 12 ± 7 |
| LVPWd (mm) | 0.8 ± 0.4 | 0.8 ± 0.3 |
| LVPWs (mm) | 0.9 ± 0.5 | 1.0 ± 0.4 |
| LVAWd (mm) | 0.4 ± 0.4 | 0.4 ± 0.4 |
| LVAWs (mm) | 0.5 ± 0.5 | 0.5 ± 0.5 |
Male and female E2f1−/− (n = 15) and their E2f1+/+ (n = 17) littermates were subjected to echocardiography 4 weeks after MI. Indices of cardiac function were assessed. Heart rate (HR) was significantly reduced in E2f1−/− mice (p = 0.0107). Stroke volume (SV, p = 0.0097) was decreased in E2f1+/+ group. Cardiac output (CO, p = 0.0707) remained unchanged. Diastolic and systolic left ventricular inner diameters were not significantly different (LVIDd, p = 0.0678; LVIDs, p = 0.0563). Fractional shortening (FS, p = 0.0862) was also not changed. Diastolic or systolic left ventricular posterior wall diameter (LVPWd, LVPWs), and diastolic or systolic anterior wall diameter (LVAWd, LVAWs) also remained similar between groups. An unpaired Student’s t test was used to determine significance between E2f1+/+ and E2f1−/− groups
Deletion of E2f1 improved capillary density in the remote zone, but not cardiomyocyte hypertrophy, fibrosis, or apoptosis
To determine how E2F1 deficiency contributed to the preservation of post-MI cardiac function at 1-week post-MI, we measured cardiomyocyte hypertrophy, capillary density, apoptosis, and cardiac fibrosis. Despite significantly smaller heart weights in E2f1−/− mice, molecular markers of hypertrophy (Nppa and Nppb) were similar between E2f1+/+ and E2f1−/− hearts (Fig. 4a). To determine whether E2f1 deficiency acutely affects cardiomyocyte size following MI, we measured cardiomyocyte cross-sectional area (Fig. 4b, d–f). Cardiomyocyte cross-sectional area was not different in border (Fig. 4d), ischemic (Fig. 4e), or remote zones (Fig. 4f). The pro-angiogenic factor, Pdgfb, was significantly upregulated 1-week post-MI (Fig. 5a). Thus, we interrogated whether capillary density was different in mid-ventricular sections of the heart (Fig. 5b–e). E2f1−/− hearts had higher capillary densities only in the remote zone (Fig. 5e). To further characterize how E2f1−/− attenuates cardiac dysfunction, we examined whether cardiac apoptosis was altered in E2f1+/+ and E2f1−/− hearts. Bcl2, a regulator of apoptosis, was significantly increased in E2f1−/− hearts (Fig. 5f), which led us to query whether the extent of apoptosis differed between the two groups; however, TUNEL staining revealed no significant changes in apoptosis (Fig. 5g, h). Moreover, cardiac fibrosis was not significantly different (Fig. 5i, j). Thus, deletion of E2f1 preserves capillary density, but has limited impact on cardiomyocyte cross-sectional area, fibrosis, or apoptosis at early time points following MI.
Fig. 4.
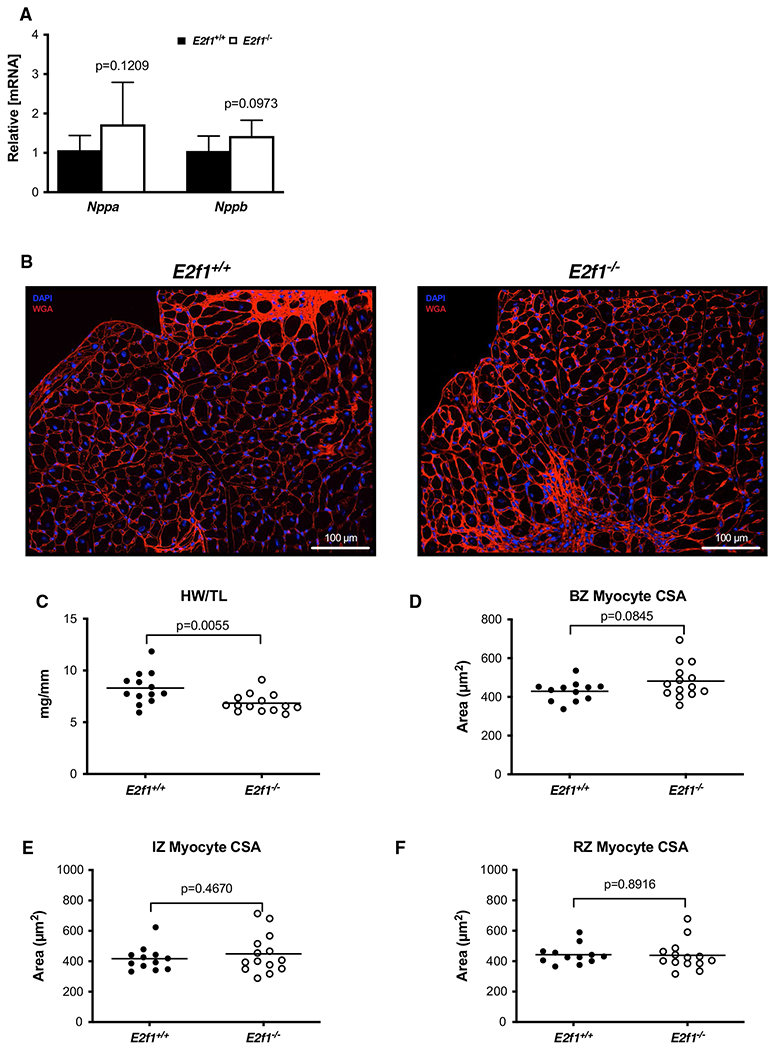
Loss of E2F1 reduces cardiac size without affecting cardiomyocyte hypertrophy after infarction. mRNA expression of markers of cardiac hypertrophy (a). Representative images of WGA-stained E2f1+/+ and E2f1−/− heart sections (b). Gravimetric analysis of heart size revealed reduced heart weight to tibia length (c) in E2f1−/− mice. Cardiomyocyte cross-sectional area was measured in the border zone of the infarct (“BZ”; panel d), in the infarct zone (“IZ”; panel e), and remote zone (“RZ”; panel f). An unpaired Student’s t test was used to determine significance between E2f1+/+ and E2f1−/− groups
Fig. 5.
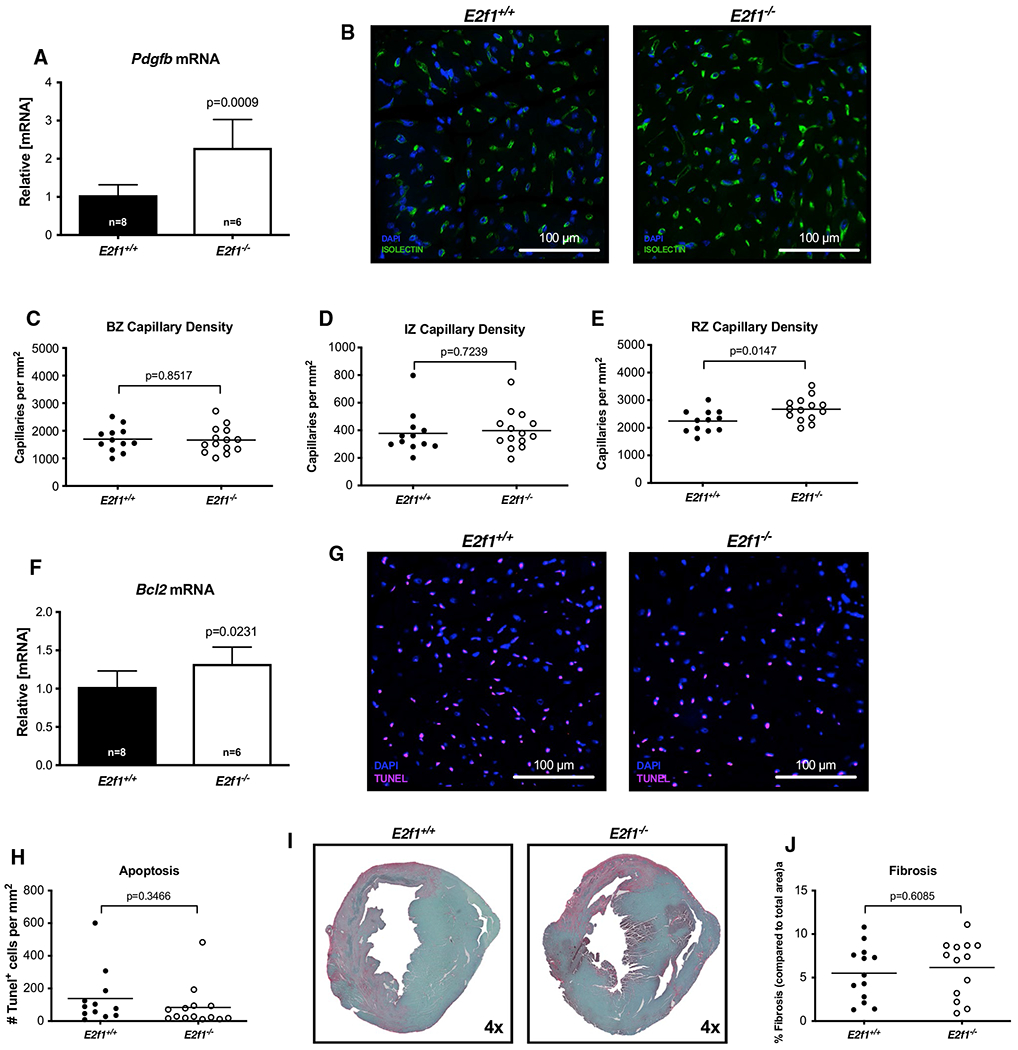
Capillary density is increased acutely after MI in the remote zone of E2f1 deficient hearts. mRNA expression of Pdgfb (a). Representative images of isolectin-stained hearts (b). Capillary density in border zone (“BZ”, panel c), infarct zone (“IZ”; panel d), and remote zone (“RZ”; panel e). Bcl2 mRNA expression (f). Representative TUNEL-stained sections (g). Quantification of TUNEL positive cells (h). Representative images for cardiac fibrosis (i) and quantification (j). An unpaired Student’s t test was used to determine significance between E2f1+/+ and E2f1−/− groups
E2f1 deficiency promotes durable improvement in ventricular function in male mice
Although the improvement in cardiac function at 1 week was significant, we wanted to know whether such improvements were maintained by subjecting an additional cohort of mice to extended observation (i.e., 4-week post-MI). E2f1 deletion attenuated cardiac dysfunction 4-week post-MI without improving survival (Supplemental Figure 1B). End diastolic and systolic volumes were preserved (Fig. 6b, c); ejection fraction was significantly higher in the E2f1−/− hearts (Fig. 6d). We examined potential sex differences within E2f1+/+ and E2f1−/− mice (Supplemental Table 2). Interestingly, the significant improvement in cardiac function was again limited to E2f1−/− male mice. Pulmonary edema was significantly less in E2f1−/− mice (Fig. 6e). These data further indicate that heart failure was less severe in E2f1−/− mice. Thus, the improvements in function we observed at 1-week post-MI were also apparent in a separate cohort of mice followed for 4 weeks.
E2F1 deficiency promotes cardiomyocyte hypertrophy in the remote zone of the failing heart
To address how deletion of E2f1 might attenuate cardiac dysfunction, we measured cardiomyocyte hypertrophy, capillary density, apoptosis, and fibrosis at 4-week post-MI. Molecular markers of cardiac hypertrophy remained similar (Fig. 7a) and heart weights were no longer different (Fig. 7c) in E2f1+/+ and E2f1−/− mice. To determine whether E2f1 deficiency chronically affects cardiomyocyte size following MI, we measured cardiomyocyte cross-sectional area (Fig. 7b–f). E2f1−/− cardiomyocyte cross-sectional area was significantly larger in only in remote zones (Fig. 7d–f). Pdgfb mRNA was significantly upregulated 4-week post-MI (Fig. 8a). Thus, we tested whether preservation of capillary density was upheld at 4-week post-MI (Fig. 8b–e). Capillary density was not different in border (Fig. 8c), ischemic (Fig. 8d), or remote zones (Fig. 8e). To further characterize how E2f1−/− attenuates chronic cardiac dysfunction, we examined whether cardiac apoptosis was altered in E2f1+/+ and E2f1−/− hearts. Bcl2 mRNA expression was not changed and TUNEL staining similarly revealed no changes in apoptosis (Fig. 8f–h). Cardiac fibrosis was not significantly different during chronic heart failure (Fig. 8i, j). Thus, deletion of E2f1 attenuates cardiac dysfunction and appears to promote cardiomyocyte hypertrophy during chronic heart failure without significantly impacting capillary density or fibrosis.
Fig. 7.
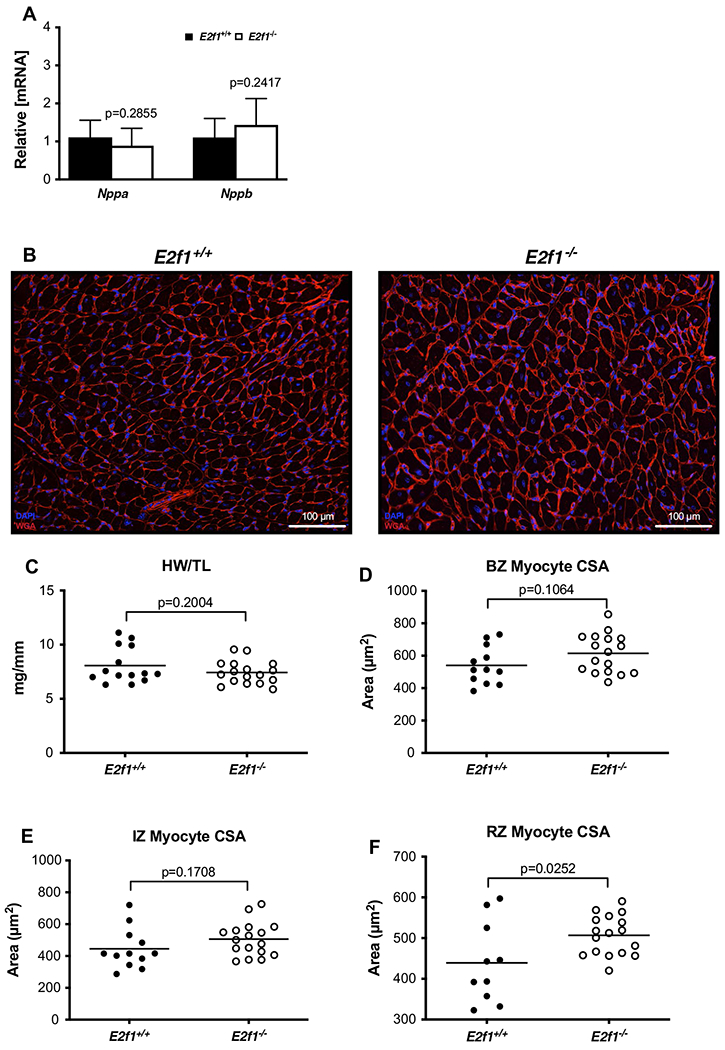
E2f1 deficiency promotes cardiomyocyte hypertrophy in the remote zone of the failing heart. Gene expression of markers of cardiac hypertrophy (a). Representative images of WGA-stained E2f1+/+ (n = 13) and E2f1−/− (n = 14) heart sections (b). Gravimetric analysis of heart size; heart weight to tibia length (c). Cardiomyocyte cross-sectional area was measured in the border zone (d), infarct zone (e), and remote zone (f; p = 0.0252). An unpaired Student’s t test was used to determine significance between E2f1+/+ and E2f1−/− groups
Fig. 8.
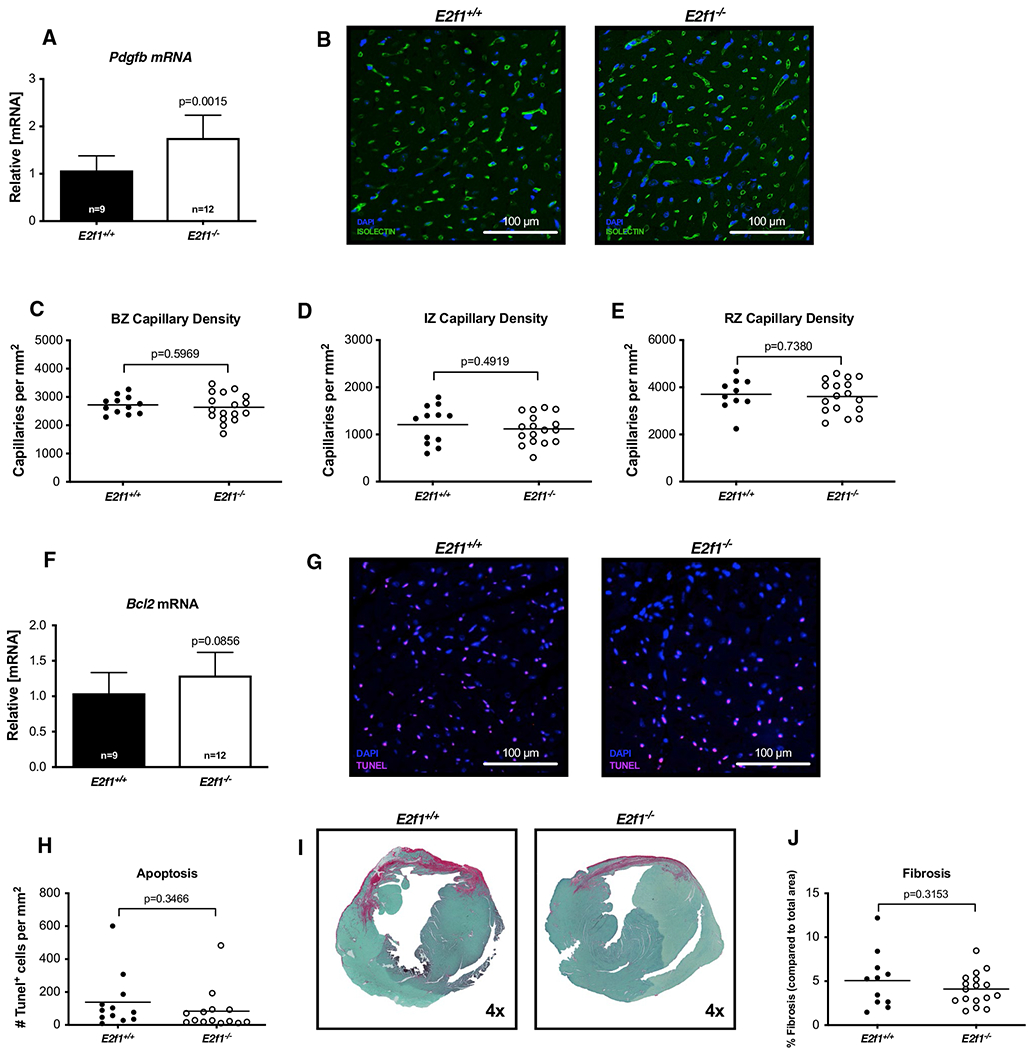
Cardiac capillary density and fibrosis are not improved during chronic heart failure in E2f1 deficient hearts. mRNA expression of Pdgfb at 4-week post-MI (a). Representative images of isolectin-stained of E2f1+/+ and E2f1−/− heart sections 4-week post-MI (b). Capillary density in border zone (“BZ”; c), infarct zone (“IZ”; d), and remote zones (“RZ”; e). Bcl2 mRNA (f). Representative TUNEL-stained of E2f1+/+ and E2f1−/− heart sections 4-week post-MI (g). Quantification of TUNEL-positive cells (h). Representative images for cardiac fibrosis (i) and quantification (j). An unpaired Student’s t test was used to determine significance between E2f1+/+ and E2f1−/− groups
E2f1−/− increases selected metabolic transcripts and without affecting protein O-GlcNAcylation early after MI
To determine whether loss of E2f1 mediated de-repression of Ogt and Mgea5 (mouse gene for OGA), we queried whether Ogt and Mgea5 mRNA and protein expression was different in E2f1−/− and E2f1+/+ hearts 1-week post-MI. We probed for OGT, OGA, and protein O-GlcNAcylation via immunoblot (Fig. 9a–c). No overall change in OGT, OGA, or protein O-GlcNAcylation was observed. E2f1 transcripts were significantly reduced (Fig. 9d); Ogt and Mgea5 expression was not different. Furthermore, we found a significant induction of markers of the hexosamine biosynthetic pathway (Gfpt2) and glucose metabolism (Pfkfb1, Pfkfb2, Ndufs1) 1 week post-MI (Fig. 9d). E2f1 ablation induces the expression glycolytic transcripts.
Fig. 9.
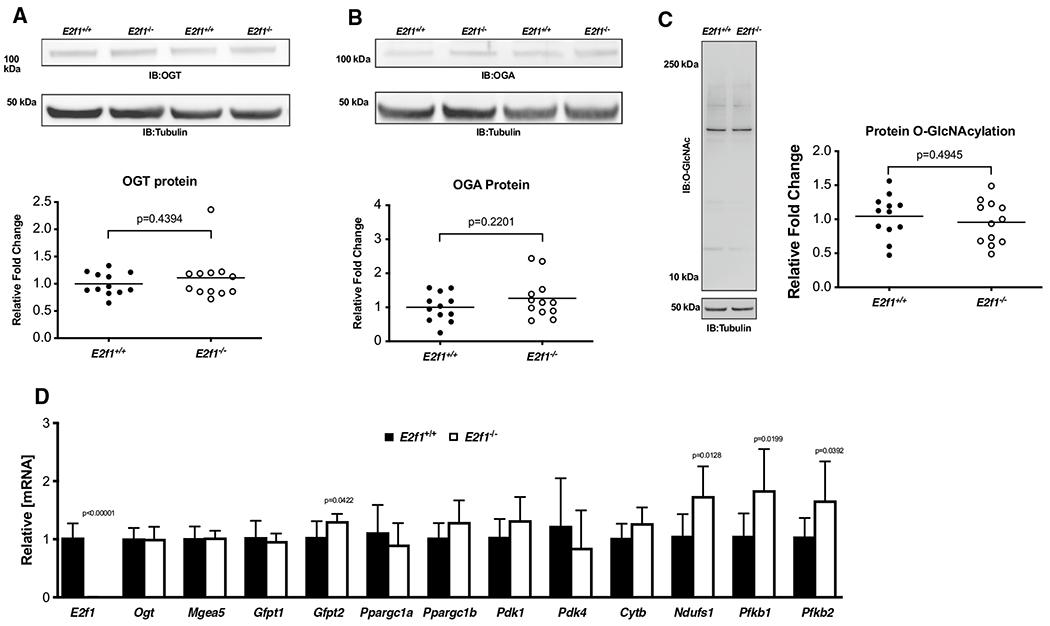
E2F1 ablation promotes expression of markers of metabolism but does not alter protein O-GlcNAcylation. Cardiac tissue harvested from 1-week post-MI E2f1+/+ and E2f1−/− hearts were probed for O-GlcNAc enzymes and markers of metabolism. Immunoblot for OGT (a), OGA (b), and protein O-GlcNAcylation (c). Expression of metabolic transcripts via RT-PCR (d). An unpaired Student’s t test was used to determine significance between E2f1+/+ and E2f1−/− groups
OGA expression is upregulated in failing E2f1−/− hearts
To determine whether loss of E2f1 mediated de-repression of Ogt and Mgea5, we queried whether Ogt and Mgea5 mRNA and protein expression was different in E2f1−/− and E2f1+/+ hearts at 4-week post-MI. While E2f1 transcripts were significantly reduced (Fig. 10d), Ogt and Mgea5 mRNA expression levels were not different. Although OGT protein expression was also not different (Fig. 10a), OGA protein expression was increased in E2f1−/− hearts (Fig. 10b). Protein O-GlcNAcylation was not changed in E2f1−/− hearts (Fig. 10c). Furthermore, E2f1−/− hearts exhibited an increased expression of Ndufs1 mRNA at 4-week post-MI (Fig. 10d). OGA protein levels were elevated in E2f1-ablated hearts during chronic heart failure, suggesting that E2F1 negatively regulates OGA expression in the failing heart.
Fig. 10.
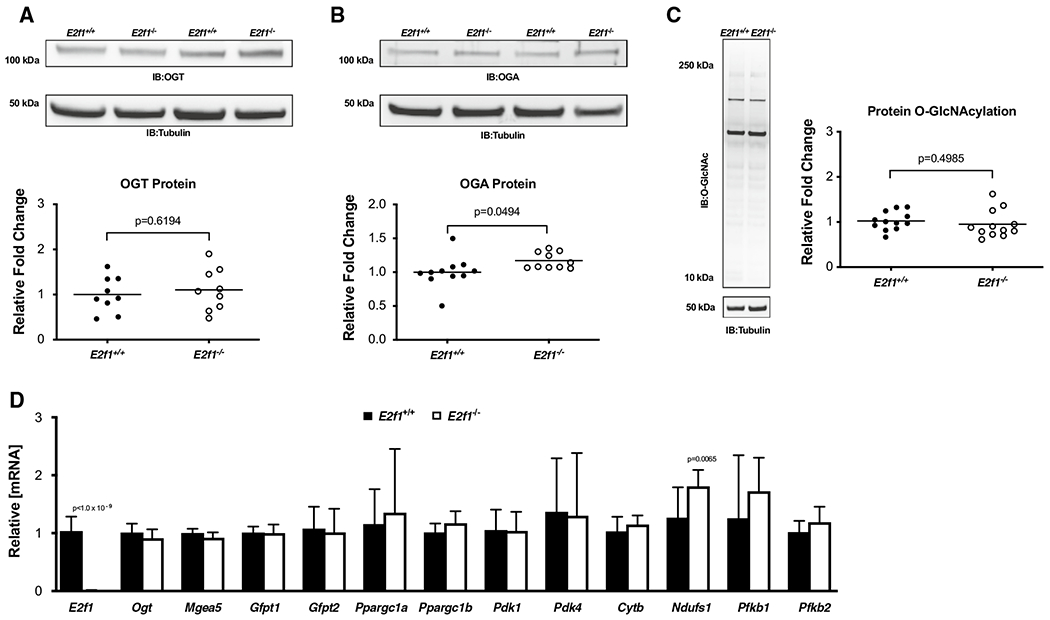
E2F1 ablation induces OGA expression in the failing heart. Cardiac tissue harvested from 4-week post-MI E2f1+/+ (n = 13) and E2f1−/− (n = 14) mice were probed for O-GlcNAc enzymes and markers of metabolism. Immunoblot for OGT (a), OGA (b), and protein O-GlcNAcylation (c). Expression of metabolic transcripts via RT-PCR (d) An unpaired Student’s t test was used to determine significance between E2f1+/+ and E2f1−/− groups
Discussion
Metabolism changes in the failing heart, and many studies have investigated the role of changes in substrate utilization in ATP generation [7]. Others have also shown that accessory metabolic pathways, particularly those directly branching off of the central glycolysis pathway, are also perturbed in the failing heart. Thus, we contend that some of these changes in ancillary pathways could underlie at least part of the pathology of the failing in heart. We and others have shown that some of these pathways’ downstream metabolites and/or applications thereof are dysregulated during heart failure [18, 28], and such changes may figure prominently in heart failure. Specifically, we and others have investigated the potential role of O-GlcNAcylation in the failing heart [20, 28]. Given the emerging role of O-GlcNAcylation in the failing heart, it would be helpful to know how O-GlcNAcylation is regulated in this specific context. Based on our recent in vitro studies, which indicated that E2F1 was a negative regulator of OGT and OGA expression [19], we tested the hypothesis that E2F1 deletion would improve cardiac function by de-repressing OGT and OGA expression in the failing heart.
Our data indicate that heart failure upregulates E2F1 expression, which has also been shown by others [1, 30, 32]. To test whether E2F1 regulates expression of OGT and OGA in the failing heart, we subjected E2f1−/− mice to MI. Although deletion of E2f1 improved ventricular function, it appeared to have limited impact on OGT and OGA mRNA expression. Yet, OGA protein expression was significantly upregulated but did not result in an overall reduction in protein O-GlcNAcylation in the 4-week study. In this regard, we satisfied the central presumption of our hypothesis that deletion of E2f1 would improve cardiac function; however, we rejected the prediction that such improvement in function would occur through de-repression of both OGT and OGA, though de-repression of OGA seems to have occurred. E2f1 is not the only transcriptional regulator of OGT or OGA. In the failing heart, there may be other molecular regulators of OGT and OGA transcription.
On face value, it may confuse some readers that we would anticipate de-repression of both OGT and OGA would be beneficial in the failing heart—or that de-repressing two presumably antagonistic enzymes would have any demonstrable effect. After all, if these two enzymes have opposing function, why would doing anything to both of them actually affect any biological process? It is now widely accepted that O-GlcNAcylation levels change during acute and chronic pathologies. Early investigations into the role of O-GlcNAcylation in various pathologic models provided strong evidence that changes in O-GlcNAcylation underlie central elements of the pathology. In some models, investigators differed in their observations, or at least differed in their interpretations. Such interpretations differed on the topic of whether more or less O-GlcNAcylation was beneficial. It is possible, however, that this is not the most appropriate question. It is possible, we contend, that changes in O-GlcNAcylation do underlie pathology; however, these changes may relate more to appropriate coupling of O-GlcNAc cycling to the cell’s needs, rather than simply higher O-GlcNAc levels versus lower O-GlcNAc levels. Protein O-GlcNAcylation is a dynamic event. The O-GlcNAc modification is readily added and removed from target proteins. To date, existing pharmacologic tools have blocked either OGT or OGA, resulting in a decrease or increase, respectively, in O-GlcNAc levels. Although OGT inhibitors and OGA inhibitors have opposite effects on the snapshot levels of O-GlcNAcylation, both approaches block cycling of O-GlcNAc—that is, the serial addition and removal of O-GlcNAcylation on target proteins. Thus, we speculate that forcing O-GlcNAc levels to be only ‘high’ or only ‘low’ may not achieve the intended goal of truly reconciling defects in O-GlcNAcylation. The reality is likely much more complicated than many in the field anticipated. Future experiments may be designed to address this. We, however, do not presently have an approach to test such speculation.
There were several other curious observations in the present study. In the 1-week cohort, the E2f1−/− hearts were smaller than the E2f1+/+ hearts, but there was no difference in cardiomyocyte cross-sectional area. On face value, this may seem like incompatible observations; however, there are other factors that could have affected the discrepancy in heart weights and cross-sectional areas. Although other measured parameters, such as fibrosis, would not seem to account for the difference, it is possible that parameters not assessed (e.g., edema) could at least partially explain the discrepancy—particularly at this early time point. A more direct explanation could have been potential changes in cardiomyocyte length, which could potentially explain the lower heart weights in the E2f1−/− group. At the 4-week time point, heart weights were not different, which, however speculative, would be consistent with the explanation of acute differences in edema. Interestingly, cardiomyocyte cross-sectional areas were higher (at least in the remote zone) of the E2f1−/− hearts.
Previous studies showed that E2F1 negatively impacts post-MI remodeling [1, 26, 27, 30, 31], and our findings confirm these results. Others have shown that E2F1 promotes apoptosis, though we did not observe a reduction in apoptosis. It is possible that E2f1 deletion may have stimulated a reduction in necrosis. Recent findings suggest that E2F1 promotes necrosis by repressing miR-30b [26]. However, our use of a non-reperfused MI model limits the likelihood of such a possibility. E2F1 may also negatively regulate vascularization by downregulating angiogenic factors Vegf and Pigf [32]. Although we observed no significant induction of Vegfa mRNA in response to E2f1 ablation, we observed an increase in capillary density during acute HF in the remote zone. Although we do not know why there was a difference in capillary density, this could be explained by an upregulation of the pro-angiogenic factor, Pdgfb, in the E2f1-ablated hearts. Others reported that induction of protein O-GlcNAcylation depresses the expression of markers of PDGF signaling [25]. Thus, it is possible that removing the repressive action of E2F1 on OGA results in the preservation of PDGF signaling and increases capillary density; however, we did not observe differences in O-GlcNAcylation, which leaves unexplained the reason for differences in vascular density we report. There are several aspects of our study design to weigh when interpreting these data. To bolster the potential reproducibility of our observations, we conducted all surgeries, ultrasounds, and data analyses in a blinded fashion. In addition, we used both male and female mice for our echocardiography studies. We used a non-reperfused model of MI to create large infarcts and significant decrements in cardiac function; this also aided in comparison to our previous publications in this area. The rationale for using this model has been well articulated by us and others [14]. In terms of limitations, our hypothesis and experimental design created no room for cell-specific differences. It is plausible that different cell types respond differently to E2f1 deletion. Future studies could use E2f1-floxed mice, which were unavailable to us when we started this project. Such a tool would allow both inducibility and tissue-specific deletion. As with many preclinical studies, ours also lacked the superimposition of a second condition (e.g., diabetes, hypertension), which would be predicted in an analogous patient population.
Thus, E2f1 exerts a deleterious effect on ventricular remodeling. We showed that deletion of E2f1 attenuates post-MI ventricular dysfunction while having only limited impact on enzymes regulating O-GlcNAcylation. Future studies may address the cell-specific effect of E2f1 on ventricular remodeling. Because our data indicate that E2f1 may limit capillary density, additional studies may focus on whether this is because of endothelial E2f1.
Supplementary Material
Acknowledgements
The authors acknowledge the University of Louisville Diabetes and Obesity Center’s Imaging and Physiology Core.
Funding Dr. Jones has been supported by Grants from the NIH (R01 HL131647, P30 GM127607, and P01 HL078825). Dr. Dassanayaka was supported by an American Heart Association Predoctoral Fellowship—Great Rivers Affiliate (14PRE19710015).
Abbreviations
- ANP
Atrial natriuretic peptide
- BCL2
B-cell lymphoma 2
- BNP
Brain natriuretic peptide
- CYTB
Cytochrome b
- E2F1
E2F transcription factor 1
- GFPT1
Glutamine fructose-6-phosphate transaminase 1
- GFPT2
Glutamine fructose-6-phosphate transaminase 2
- HBP
Hexosamine biosynthetic pathway
- MI
Myocardial infarction
- NDUFS1
NADH: ubiquinone oxidoreductase core subunit S1
- O-GlcNAc
β-O-Linked N-acetylglucosamine
- OGA
O-GlcNAcase
- OGT
O-GlcNAc transferase
- PDK1
Pyruvate dehydrogenase kinase 1
- PDK4
Pyruvate dehydrogenase kinase 4
- PFKFB1
6-Phosphofructo-2-kinase/fructose-2,6-biphosphatase 1
- PFKFB2
6-Phosphofructo-2-kinase/fructose-2,6-biphosphatase 1
- PGC1α
Peroxisome proliferator-activated receptor gamma, co-activator 1 alpha
- PGC1β
Peroxisome proliferator-activated receptor gamma, co-activator 1 beta
- VEGFA
Vascular endothelial growth factor A
Footnotes
Electronic supplementary material The online version of this article (https://doi.org/10.1007/s00395-019-0737-y) contains supplementary material, which is available to authorized users.
Conflict of interest The authors declare that they have no competing interest.
References
- 1.Angelis E, Zhao P, Zhang R, Goldhaber JI, Maclellan WR (2011) The role of E2F-1 and downstream target genes in mediating ischemia/reperfusion injury in vivo. J Mol Cell Cardiol 51:919–926. 10.1016/j.yjmcc.2011.09.012 [DOI] [PMC free article] [PubMed] [Google Scholar]
- 2.Brainard RE, Watson LJ, Demartino AM, Brittian KR, Readnower RD, Boakye AA, Zhang D, Hoetker JD, Bhatnagar A, Baba SP, Jones SP (2013) High fat feeding in mice is insufficient to induce cardiac dysfunction and does not exacerbate heart failure. PLoS One 8:e83174 10.1371/journal.pone.0083174 [DOI] [PMC free article] [PubMed] [Google Scholar]
- 3.Champattanachai V, Marchase RB, Chatham JC (2007) Glucosamine protects neonatal cardiomyocytes from ischemia-reperfusion injury via increased protein-associated O-GlcNAc. Am J Physiol Cell Physiol 292:C178–C187. 10.1152/ajpcell.00162.2006 [DOI] [PubMed] [Google Scholar]
- 4.Chatham JC, Not LG, Fulop N, Marchase RB (2008) Hexosamine biosynthesis and protein O-glycosylation: the first line of defense against stress, ischemia, and trauma. Shock 29:431–440. 10.1097/shk.0b013e3181598bad [DOI] [PubMed] [Google Scholar]
- 5.Dassanayaka S, Brainard RE, Watson LJ, Long BW, Brittian KR, DeMartino AM, Aird AL, Gumpert AM, Audam TN, Kilfoil PJ, Muthusamy S, Hamid T, Prabhu SD, Jones SP (2017) Cardiomyocyte Ogt limits ventricular dysfunction in mice following pressure overload without affecting hypertrophy. Basic Res Cardiol 112:23 10.1007/s00395-017-0612-7 [DOI] [PMC free article] [PubMed] [Google Scholar]
- 6.Dassanayaka S, Zheng Y, Gibb AA, Cummins TD, McNally LA, Brittian KR, Jagatheesan G, Audam TN, Long BW, Brainard RE, Jones SP, Hill BG (2018) Cardiac-specific overexpression of aldehyde dehydrogenase 2 exacerbates cardiac remodeling in response to pressure overload. Redox Biol 17:440–449. 10.1016/j.redox.2018.05.016 [DOI] [PMC free article] [PubMed] [Google Scholar]
- 7.Doenst T, Nguyen TD, Abel ED (2013) Cardiac metabolism in heart failure: implications beyond ATP production. Circ Res 113:709–724. 10.1161/CIRCRESAHA.113.300376 [DOI] [PMC free article] [PubMed] [Google Scholar]
- 8.Fulop N, Feng W, Xing D, He K, Not LG, Brocks CA, Marchase RB, Miller AP, Chatham JC (2008) Aging leads to increased levels of protein O-linked N-acetylglucosamine in heart, aorta, brain and skeletal muscle in Brown-Norway rats. Biogerontology 9:139–151. 10.1007/s10522-007-9123-5 [DOI] [PMC free article] [PubMed] [Google Scholar]
- 9.Hart GW (2014) Minireview series on the thirtieth anniversary of research on O-GlcNAcylation of nuclear and cytoplasmic proteins: nutrient regulation of cellular metabolism and physiology by O-GlcNAcylation. J Biol Chem 289:34422–34423. 10.1074/jbc.R114.609776 [DOI] [PMC free article] [PubMed] [Google Scholar]
- 10.Heusch G, Libby P, Gersh B, Yellon D, Bohm M, Lopaschuk G, Opie L (2014) Cardiovascular remodelling in coronary artery disease and heart failure. Lancet 383:1933–1943. 10.1016/S0140-6736(14)60107-0 [DOI] [PMC free article] [PubMed] [Google Scholar]
- 11.Jensen RV, Johnsen J, Kristiansen SB, Zachara NE, Botker HE (2013) Ischemic preconditioning increases myocardial O-GlcNAc glycosylation. SCJ, Scand Cardiovasc J. 10.3109/14017431.2012.756984 [DOI] [PubMed] [Google Scholar]
- 12.Jensen RV, Zachara NE, Nielsen PH, Kimose HH, Kristiansen SB, Botker HE (2013) Impact of O-GlcNAc on cardioprotection by remote ischaemic preconditioning in non-diabetic and diabetic patients. Cardiovasc Res 97:369–378. 10.1093/cvr/cvs337 [DOI] [PMC free article] [PubMed] [Google Scholar]
- 13.Jones SP, Zachara NE, Ngoh GA, Hill BG, Teshima Y, Bhatnagar A, Hart GW, Marban E (2008) Cardioprotection by N-acetylglucosamine linkage to cellular proteins. Circulation 117:1172–1182. 10.1161/CIRCULATIONAHA.107.730515 [DOI] [PubMed] [Google Scholar]
- 14.Lindsey ML, Bolli R, Canty JM Jr, Du XJ, Frangogiannis NG, Frantz S, Gourdie RG, Holmes JW, Jones SP, Kloner RA, Lefer DJ, Liao R, Murphy E, Ping P, Przyklenk K, Recchia FA, Schwartz Longacre L, Ripplinger CM, Van Eyk JE, Heusch G (2018) Guidelines for experimental models of myocardial ischemia and infarction. American journal of physiology. Heart Circ Physiol 314:H812–H838. 10.1152/ajpheart.00335.2017 [DOI] [PMC free article] [PubMed] [Google Scholar]
- 15.Liu J, Pang Y, Chang T, Bounelis P, Chatham JC, Marchase RB (2006) Increased hexosamine biosynthesis and protein O-GlcNAc levels associated with myocardial protection against calcium paradox and ischemia. J Mol Cell Cardiol 40:303–312. 10.1016/j.yjmcc.2005.11.003 [DOI] [PubMed] [Google Scholar]
- 16.Ma Z, Vosseller K (2014) Cancer metabolism and elevated O-GlcNAc in oncogenic signaling. J Biol Chem 289:34457–34465. 10.1074/jbc.R114.577718 [DOI] [PMC free article] [PubMed] [Google Scholar]
- 17.McLarty JL, Marsh SA, Chatham JC (2012) Post-translational protein modification by O-linked N-acetyl-glucosamine: its role in mediating the adverse effects of diabetes on the heart. Life Sci. 10.1016/j.lfs.2012.08.006 [DOI] [PMC free article] [PubMed] [Google Scholar]
- 18.Muthusamy S, DeMartino AM, Watson LJ, Brittian KR, Zafir A, Dassanayaka S, Hong KU, Jones SP (2014) MicroRNA-539 is upregulated in failing heart, and suppresses O-GlcNAcase expression. J Biol Chem 289:29665–29676. 10.1074/jbc.M114.578682 [DOI] [PMC free article] [PubMed] [Google Scholar]
- 19.Muthusamy S, Hong KU, Dassanayaka S, Hamid T, Jones SP (2015) E2F1 transcription factor regulates O-linked N-acetylglucosamine (O-GlcNAc) transferase and O-GlcNAcase expression. J Biol Chem 290:31013–31024. 10.1074/jbc.M115.677534 [DOI] [PMC free article] [PubMed] [Google Scholar]
- 20.Ngoh GA, Hamid T, Prabhu SD, Jones SP (2009) O-GlcNAc signaling attenuates ER stress-induced cardiomyocyte death. Am J Physiol Heart Circ Physiol 297:H1711–H1719. 10.1152/ajpheart.00553.2009 [DOI] [PMC free article] [PubMed] [Google Scholar]
- 21.Park K, Saudek CD, Hart GW (2010) Increased expression of beta-N-acetylglucosaminidase in erythrocytes from individuals with pre-diabetes and diabetes. Diabetes 59:1845–1850. 10.2337/db09-1086 [DOI] [PMC free article] [PubMed] [Google Scholar]
- 22.Perez-Cervera Y, Dehennaut V, Aquino Gil M, Guedri K, Solorzano Mata CJ, Olivier-Van Stichelen S, Michalski JC, Foulquier F, Lefebvre T (2013) Insulin signaling controls the expression of O-GlcNAc transferase and its interaction with lipid microdomains. FASEB J 27:3478–3486. 10.1096/fj.12-217984 [DOI] [PubMed] [Google Scholar]
- 23.Sansbury BE, DeMartino AM, Xie Z, Brooks AC, Brainard RE, Watson LJ, DeFilippis AP, Cummins TD, Harbeson MA, Brittian KR, Prabhu SD, Bhatnagar A, Jones SP, Hill BG (2014) Metabolomic analysis of pressure-overloaded and infarcted mouse hearts. Circ Heart Fail 7:634–642. 10.1161/CIRCHEARTFAILURE.114.001151 [DOI] [PMC free article] [PubMed] [Google Scholar]
- 24.Slawson C, Copeland RJ, Hart GW (2010) O-GlcNAc signaling: a metabolic link between diabetes and cancer? Trends Biochem Sci 35:547–555. 10.1016/j.tibs.2010.04.005 [DOI] [PMC free article] [PubMed] [Google Scholar]
- 25.Tan EP, McGreal SR, Graw S, Tessman R, Koppel SJ, Dhakal P, Zhang Z, Machacek M, Zachara NE, Koestler DC, Peterson KR, Thyfault JP, Swerdlow RH, Krishnamurthy P, DiTacchio L, Apte U, Slawson C (2017) Sustained O-GlcNAcylation reprograms mitochondrial function to regulate energy metabolism. J Biol Chem 292:14940–14962. 10.1074/jbc.M117.797944 [DOI] [PMC free article] [PubMed] [Google Scholar]
- 26.Wang K, An T, Zhou LY, Liu CY, Zhang XJ, Feng C, Li PF (2015) E2F1-regulated miR-30b suppresses cyclophilin D and protects heart from ischemia/reperfusion injury and necrotic cell death. Cell Death Differ 22:743–754. 10.1038/cdd.2014.165 [DOI] [PMC free article] [PubMed] [Google Scholar]
- 27.Wang K, Zhou LY, Wang JX, Wang Y, Sun T, Zhao B, Yang YJ, An T, Long B, Li N, Liu CY, Gong Y, Gao JN, Dong YH, Zhang J, Li PF (2015) E2F1-dependent miR-421 regulates mitochondrial fragmentation and myocardial infarction by targeting Pink1. Nat Commun 6:7619 10.1038/ncomms8619 [DOI] [PubMed] [Google Scholar]
- 28.Watson LJ, Facundo HT, Ngoh GA, Ameen M, Brainard RE, Lemma KM, Long BW, Prabhu SD, Xuan YT, Jones SP (2010) O-Linked beta-N-acetylglucosamine transferase is indispensable in the failing heart. Proc Natl Acad Sci USA 107:17797–17802. 10.1073/pnas.1001907107 [DOI] [PMC free article] [PubMed] [Google Scholar]
- 29.Watson LJ, Long BW, DeMartino AM, Brittian KR, Readnower RD, Brainard RE, Cummins TD, Annamalai L, Hill BG, Jones SP (2014) Cardiomyocyte Ogt is essential for postnatal viability. Am J Physiol Heart Circ Physiol 306:H142–H153. 10.1152/ajpheart.00438.2013 [DOI] [PMC free article] [PubMed] [Google Scholar]
- 30.Wohlschlaeger J, Schmitz KJ, Takeda A, Takeda N, Vahlhaus C, Stypmann J, Schmid C, Baba HA (2010) Reversible regulation of the retinoblastoma protein/E2F-1 pathway during “reverse cardiac remodelling” after ventricular unloading. J Heart Lung Transplant 29:117–124. 10.1016/j.healun.2009.09.017 [DOI] [PubMed] [Google Scholar]
- 31.Wolfram JA, Liner A, Richardson SL, Zhu X, Smith MA, Hoit BD, Lee HG (2011) The role of E2F1 in the development of hypertrophic cardiomyopathy. Int J Clin Exp Pathol 4:521–525 [PMC free article] [PubMed] [Google Scholar]
- 32.Wu M, Zhou J, Cheng M, Boriboun C, Biyashev D, Wang H, Mackie A, Thorne T, Chou J, Wu Y, Chen Z, Liu Q, Yan H, Yang Y, Jie C, Tang YL, Zhao TC, Taylor RN, Kishore R, Losordo DW, Qin G (2014) E2F1 suppresses cardiac neovascularization by down-regulating VEGF and PlGF expression. Cardiovasc Res 104:412–422. 10.1093/cvr/cvu222 [DOI] [PMC free article] [PubMed] [Google Scholar]
- 33.Wysoczynski M, Dassanayaka S, Zafir A, Ghafghazi S, Long BW, Noble C, DeMartino AM, Brittian KR, Bolli R, Jones SP (2016) A new method to stabilize C-kit expression in reparative cardiac mesenchymal cells. Front Cell Dev Biol 4:78 10.3389/fcell.2016.00078 [DOI] [PMC free article] [PubMed] [Google Scholar]
- 34.Yuzwa SA, Vocadlo DJ (2014) O-GlcNAc and neurodegeneration: biochemical mechanisms and potential roles in Alzheimer’s disease and beyond. Chem Soc Rev 43:6839–6858. 10.1039/c4cs00038b [DOI] [PubMed] [Google Scholar]
- 35.Zhang Z, Tan EP, VandenHull NJ, Peterson KR, Slawson C (2014) O-GlcNAcase expression is sensitive to changes in O-GlcNAc homeostasis. Front Endocrinol (Lausanne) 5:206 10.3389/fendo.2014.00206 [DOI] [PMC free article] [PubMed] [Google Scholar]
Associated Data
This section collects any data citations, data availability statements, or supplementary materials included in this article.