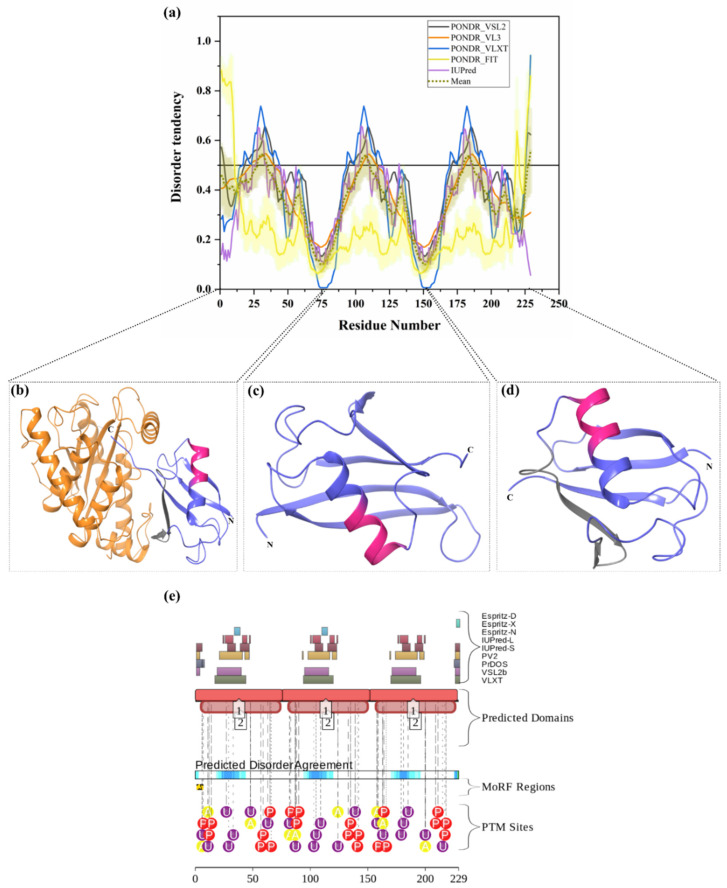
Figure 5.
Analysis of intrinsic disorder predisposition in polyubiquitin-B (UBB) and structural characterization of mature ubiquitins. (a) Disorder analysis of human polyubiquitin-B (UniProt ID: P0CG47). (b) Crystal structure of chain B of Polyubiquitin-B (PDB ID: 6FDK). (c) Crystal structure of Chain D of Polyubiquitin-B (PDB ID: 6BYH). (d) Crystal structure of Chain A of Polyubiquitin-B (PDB ID: 4XOF). In Plot (a), the disorder profile obtained forms a set of disorder predictors such as PONDR® VSL2, PONDR® VL3, PONDR® VLXT, PONDR® FIT and IUPred, represented by black, orange, blue, yellow, and purple curves respectively. Mean disorder profile, which was calculated from average of five predictor-specific per-residue disorder profiles, is shown in olive color. Predicted disorder scores above 0.5 are considered as disordered residues/regions. The light-olive shadow around the mean curve represents the error distribution for the mean. The light-yellow shadow around the PONDR® FIT curve shows the error distribution for PONDR® FIT. In Plot (b), a structure of Ub protein (faded blue) in complex with Chlamydia trachomatis effector protein Cdu1 (orange color) is represented. In Plots (b), (c), and (d), Ub is shown in faded blue color, and disordered residues are shown in salmon pink color. The position of MoRFCHiBi_Web-server-identified MoRFs (residues 40–50, shown in PDB ID:6FDK, and residues 192–202, shown in PDB ID: 4XOF) are represented by grey color. (e) Functional disorder profile of the UBB protein, using the D2P2 server, is shown.

