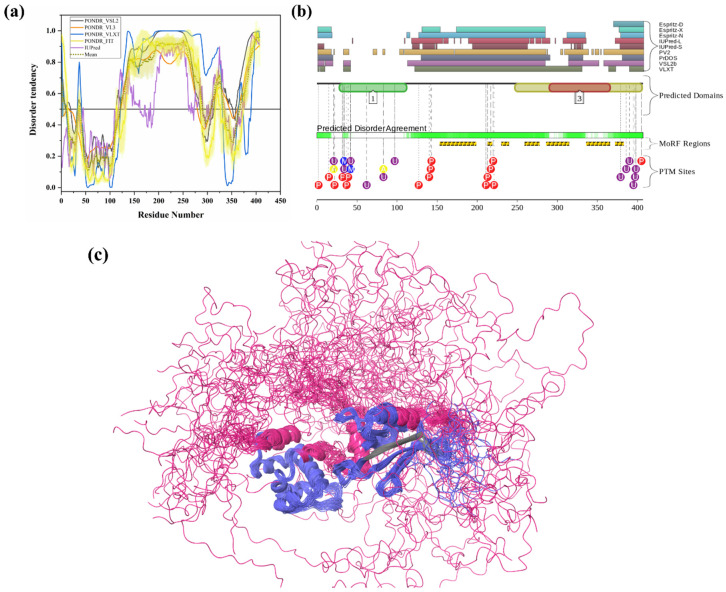
Figure 10.
Intrinsic disorder predisposition of ADRM1. (a) Intrinsic disorder profile generated for ADRM1 (UniProt ID: Q16186) by a set of per-residue disorder predictors, such as PONDR® VSL2, PONDR® VL3, PONDR® VLXT, PONDR® FIT, and IUPred. (b) D2P2 server-based functional disorder profile for ADRM1. (c) Solution NMR structure of the ADRM1 with 20 different conformations (PDB ID: 2KR0). In Plot (a), disorder profiles generated by sets of disorder predictors, such as PONDR® VSL2, PONDR® VL3, PONDR® VLXT, PONDR® FIT, and IUPred, are depicted by black, orange, blue, yellow, and purple curves, respectively. The mean disorder profile, calculated from the average of five predictor-specific per-residue disorder profiles, is shown by the olive color curve. The predicted disorder score above 0.5 are considered as disordered residues/regions. The light-olive shadow around mean curve represents the error distribution for the mean. The light-yellow shadow around PONDR® FIT curve shows error distribution for PONDR® FIT. In (c), ADRM1 is represented by the faded blue color, and disordered residues are shown by the salmon pink color.

