Abstract
Limited knowledge of the mechanisms that govern the self-renewal of human haematopoietic stem cells (HSCs), and why this fails in culture, have impeded the expansion of HSCs for transplantation1. Here we identify MLLT3 (also known as AF9) as a crucial regulator of HSCs that is highly enriched in human fetal, neonatal and adult HSCs, but downregulated in culture. Depletion of MLLT3 prevented the maintenance of transplantable human haematopoietic stem or progenitor cells (HSPCs) in culture, whereas stabilizing MLLT3 expression in culture enabled more than 12-fold expansion of transplantable HSCs that provided balanced multilineage reconstitution in primary and secondary mouse recipients. Similar to endogenous MLLT3, overexpressed MLLT3 localized to active promoters in HSPCs, sustained levels of H3K79me2 and protected the HSC transcriptional program in culture. MLLT3 thus acts as HSC maintenance factor that links histone reader and modifying activities to modulate HSC gene expression, and may provide a promising approach to expand HSCs for transplantation.
HSCs can self-renew throughout their lifetime while replenishing all blood lineages, making HSC transplantation a life-saving treatment for many blood diseases. However, a lack of HLA-matched bone marrow donors and a low yield of HSCs in cord blood limit the number of patients that can be treated1. A better understanding of HSC self-renewal is required to expand human HSCs in culture or to generate them from pluripotent stem cells.
HSCs develop during embryogenesis from haemogenic endothelium in large arteries and expand in the fetal liver before colonizing the bone marrow2. Although many factors that drive the specification of haemogenic endothelium and HSCs have been identified, we know less about those that maintain HSC self-renewal. Here we identify MLLT3 as a crucial regulator of human HSC maintenance, and show that restoring MLLT3 levels in cultured human HSCs protects stemness and enables the ex vivo expansion of transplantable HSCs.
MLLT3 is enriched and required in human HSCs
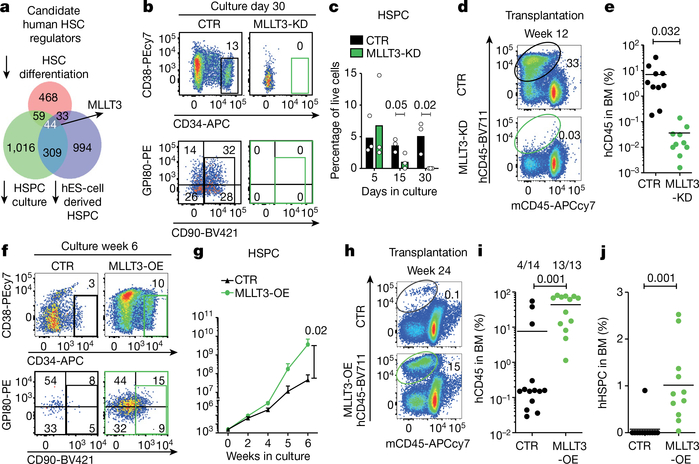
To define the molecular machinery that governs human HSC self-renewal and determine why it fails in culture, we compared the transcriptomes of highly self-renewing HSPCs from human fetal liver to their immediate progeny3 and to dysfunctional, cultured HSPCs, derived from fetal liver or embryonic stem cells4,5. From the 12 nuclear regulators correlating with self-renewal, MLLT3 was selected for further study (Fig. 1a, Extended Data Fig. 1a, b). MLLT3 is a component of the superelongation complex6 and co-operates with DOT1L, which di/trimethylates H3K79 to promote transcription7–9. MLLT3 localizes to active transcription start sites (TSSs) through the YEATS domain, which recognizes active histone marks such as H3K9 acetylation and crotonylation8,10. A truncated MLLT3 that lacks the YEATS domain forms a leukaemic fusion protein with the N terminus of MLL1, which misdirects MLLT3-interacting complexes to induce aberrant gene transcription11–14. MLLT3 also regulates erythroid or megakaryocytic progenitors15 and was identified as a definitive HSC hub gene during mouse development16.
Fig. 1 |. MLLT3 regulates human HSPC expansion.
a, Venn diagram of microarray gene expression data, identifying genes enriched in self-renewing human FL-HSPCs. Number of genes downregulated after differentiation (pink) of fetal liver CD34+CD38−/loCD90+GPI80+ HSCs to CD34+CD38−/loCD90+GPI80− progenitors3; number of genes downregulated in FL-HSPCs during 5-week culture on OP9M2 stroma (green)4; and number of genes suppressed in human embryonic stem (ES)-cell-derived HSPCs (purple)5 are shown. b, FACS analysis 30 days after transduction of CD34+CD38−/loCD90+ HSPCs with MLLT3 shRNA (MLLT3-KD) or empty vector control (CTR) (representative of three plots). c, Quantification of cells as in b after 5, 15 and 30 days in culture (n = 3). d, FACS analysis of bone marrow from NSG mice 12 weeks after transplantation of FL- HSPCs transduced with MLLT3-KD or empty vector control (representative of 10 mice). e, Quantification of human (h) CD45+ cells in bone marrow (BM) from NSG mice treated as in d (n = 10 mice, two independent experiments). f, FACS analysis of CD34+CD38−/loCD90+ FL-HSPCs transduced with control or MLLT3- OE lentiviral vector (representative of six experiments). g, Expansion of HSPCs as in f (n = 6 independent experiments). h-j, FACS analysis showing human haematopoietic reconstitution (hCD45 expression) (h) and quantification of total hCD45 cells (i) or human HSPCs (hCD45+CD34+CD38−/lo) (j) in bone marrow from NSG mice. In i andj, the number of mice showing multi-lineage reconstitution versus the number of total transplanted mice is shown (n = 13 or 14 mice, 4 independent experiments). APCcy7, PEcy7, BV421 and BV711 denote fluorochrome dyes. Data in c denote mean values; data in e, i and j denote mean and individual values; data in g are mean ± s.e.m. All P values determined by two-sided t-test.
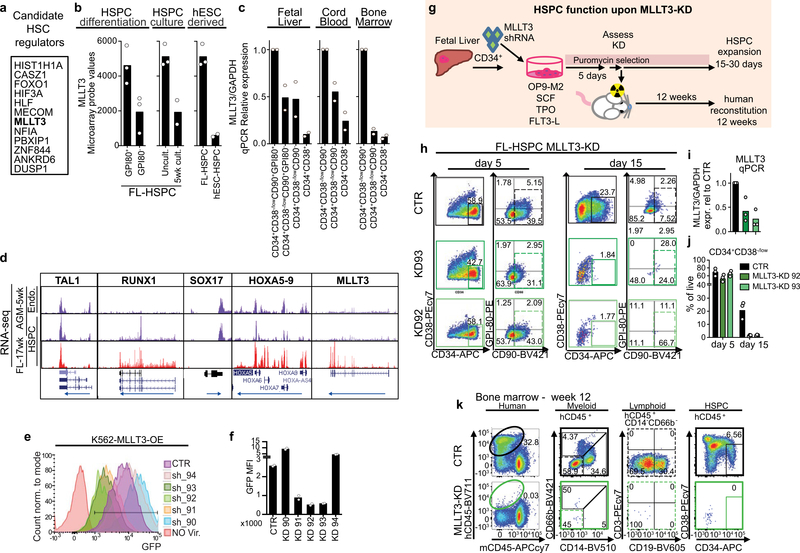
MLLT3 expression was enriched in undifferentiated human HSPCs in fetal liver, cord blood and bone marrow (Extended Data Fig. 1c). RNA-sequencing (RNA-seq) analysis of developmental haematopoietic tissues showed that MLLT3 was upregulated in fetal liver17 (Extended Data Fig. 1d), whereas genes specific to the development of haemogenic endothelium and HSCs such as TAL1 (also known as SCL), RUNX1, SOX17 and HOXA genes were already highly expressed in 5 week aorta- gonad-mesonephros, which suggests that MLLT3 is involved in HSC maturation and maintenance.
To determine whether human HSCs require MLLT3, two validated MLLT3 short hairpin RNAs (shRNAs) (Extended Data Fig. 1e, f) were tested in an HSPC expansion culture system using the OP9M2 stromal stem-cell line4. Both of the shRNAs resulted in premature depletion of fetal liver HSPCs (FL-HSPCs) in vitro (Fig. 1b, c, Extended Data Fig. 1g–j). When FL- HSPCs transduced with MLLT3-knockdown (KD) or control vector were transplanted into immunodeficient NSG (NOD-SCID Il2rg-null) mice, only the control cells showed multilineage (myelo/lymphoid) human haematopoietic reconstitution (Fig. 1d, e, Extended Data Fig. 1k, Supplementary Table 1), which indicates an important regulatory function for MLLT3.
Sustaining MLLT3 levels improves HSPC culture
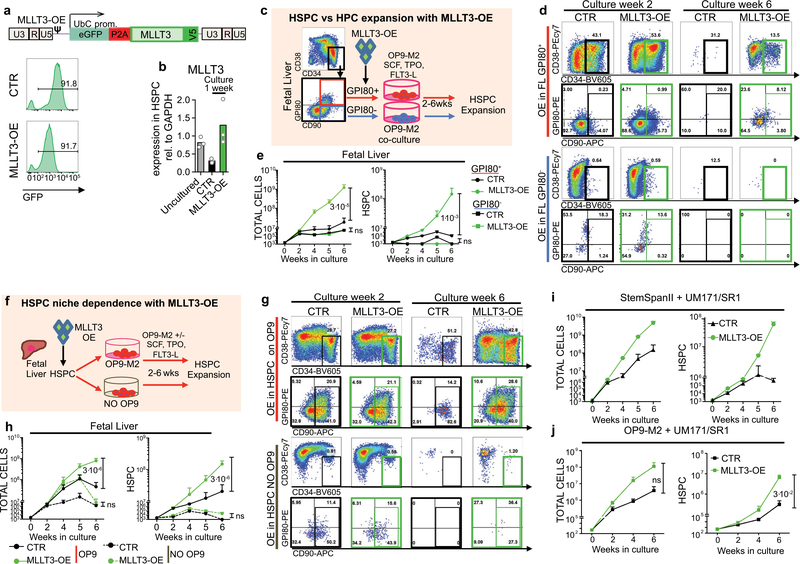
As studies had shown expansion of multipotent human HSPCs on OP9M2 stroma without measurable expansion of transplantable HSCs4, we asked whether maintaining MLLT3 expression in cultured HSPCs improves their function. Restoring physiological MLLT3 levels using an overexpression lentiviral vector (MLLT3-OE) significantly enhanced the expansion of CD34+CD38−/loCD90+ FL-HSPCs on OP9M2 stroma (78-fold greater than controls at 6 weeks) (Fig. 1f, g, Extended Data Fig. 2a, b). Targeting MLLT3-OE in the most undifferentiated CD34+CD38−/loCD90+GPI80+ FL-HSPCs3 recapitulated the expansion phenotype, whereas MLLT3-OE in CD34CD38−/loCD90+GPI80− progenitors did not confer the HSC immunophenotype or expand them (Extended Data Fig. 2c–e). Withdrawing OP9M2 stroma depleted undifferentiated MLLT3-OE HSPCs, demonstrating a dependence on a HSC- supportive microenvironment (Extended Data Fig. 2f–h). MLLT3-OE also enhanced FL-HSPC expansion when cultured in clinically suitable conditions using serum-free expansion medium (SFEM) and the small molecules SR118 and UM17119, or on OP9M2 stroma with both SR1 and UM171 (Extended Data Fig. 2i,j), showing the beneficial effects on HSPC expansion on all HSC-supportive conditions tested.
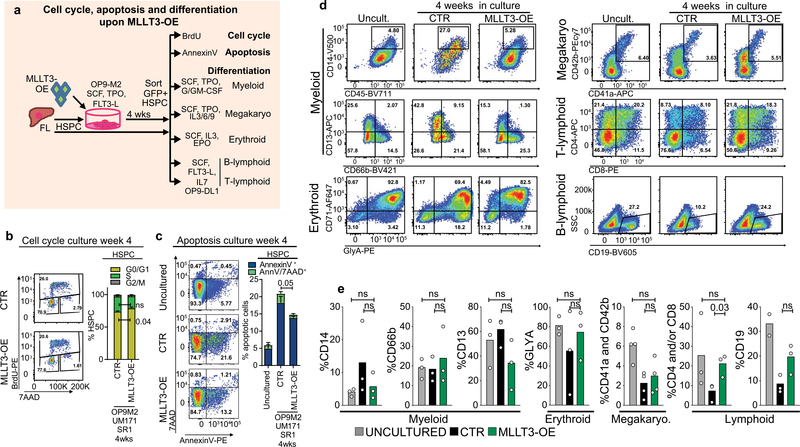
BrdU incorporation assays did not show enhanced proliferation of MLLT3-OE HSPCs in culture (Extended Data Fig. 3a, b). Staining of annexinV and 7-aminoactinomycin D (7AAD) showed greater viability of MLLT3-OE FL-HSPCs than empty-vector-transduced FL-HSPCs, but reduced cell viability compared with uncultured FL-HSPCs (Extended Data Fig. 3c). Differentiation of MLLT3-OE HSPCs after a 4-week expansion showed comparable monocytic, granulocytic, erythroid, mega- karyocytic, T and B lymphoid differentiation potential to non-expanded FL-HSPCs (Extended Data Fig. 3d, e). Hence, sustaining MLLT3 expression in cultured HSPCs maintains their identity and viability without causing excessive proliferation or resistance to apoptosis, or blocking differentiation.
MLLT3 enhances transplantation of cultured HSPCs
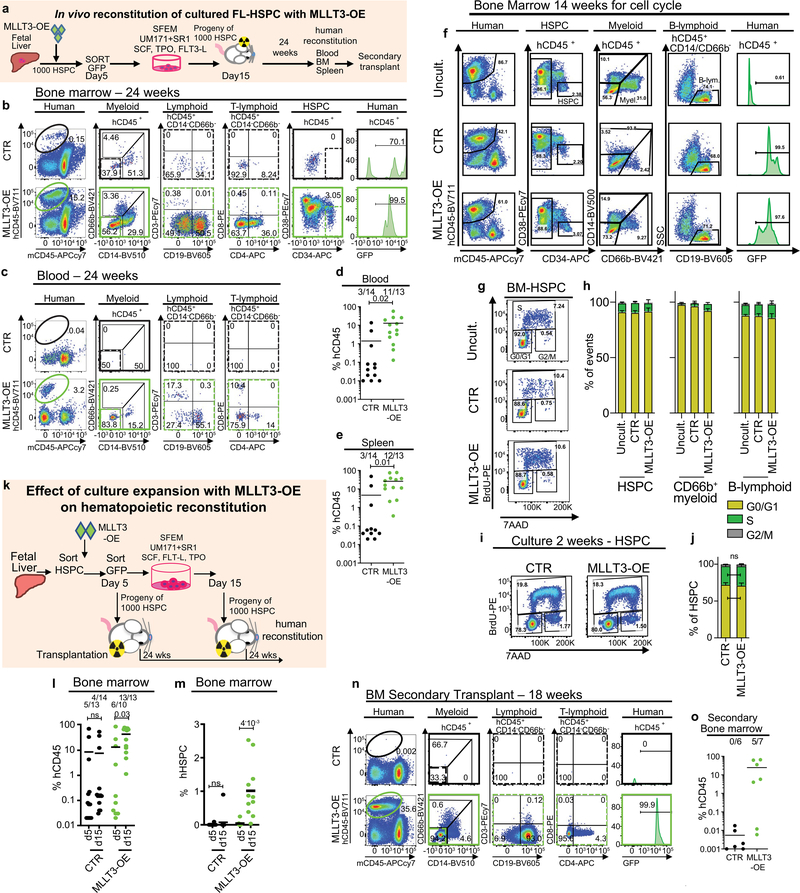
To assess whether maintaining MLLT3 levels in cultured HSPCs improves the reconstitution potential in NSG mice, CD34+GFP+ fetal liver cells sorted at day 5 and transduced with MLLT3-OE or control vector were expanded in SFEM containing SR1 and UM171 and transplanted on day 15 (Extended Data Fig. 4a). Mice transplanted with MLLT3-OE cells showed more frequent long-term (24 week) human multilineage engraftment in the bone marrow, and higher levels of engraftment than mice transplanted with control HSPCs (Fig. 1h, i, Extended Data Fig. 4b, Supplementary Table 2a). Most mice transplanted with MLLT3-OE cells, but not with control cells, also contained human HSPCs in the bone marrow and generated myeloid and lymphoid cells in the peripheral blood and spleen (Fig. 1j, Extended Data Fig. 4c–e). Increased haematopoietic reconstitution with MLLT3-OE HSPCs was not explained by altered proliferation of MLLT3-OE HSPCs or differentiated cells in recipient mice or in culture before transplantation (Extended Data Fig. 4f–j).
To ascertain the role of extended culture in MLLT3-mediated enhanced in vivo reconstitution, the engraftment levels were compared between CD34+GFP+ cells sorted 5 days after transduction and their progeny sorted at 15 days. Culture with MLLT3-OE, but not control vector, significantly increased total human haematopoietic reconstitution and HSPC reconstitution (Extended Data Fig. 4k–m). When bone marrow from primary mice was transplanted into secondary mouse recipients, only MLLT3-OE cells showed multilineage reconstitution after 18 weeks (Extended Data Fig. 4n, o). These data indicate that maintaining MLLT3 expression in FL-HSPCs during culture enhances human multilineage haematopoietic reconstitution in primary and secondary recipients.
MLLT3 binds to TSSs of active genes in human HSPCs
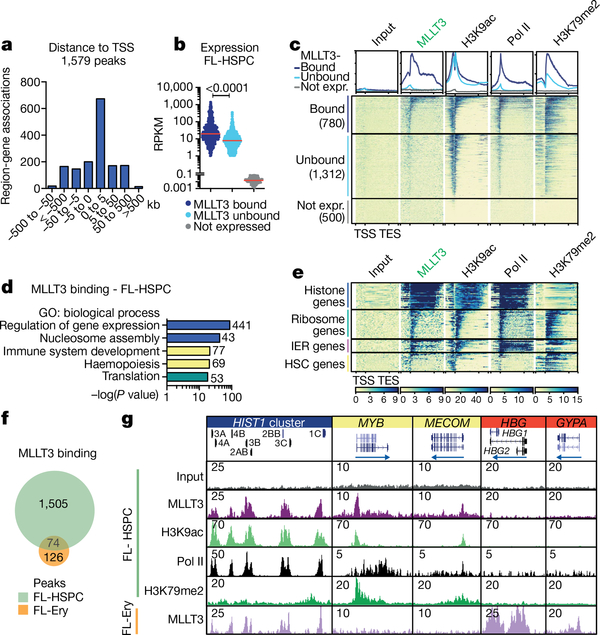
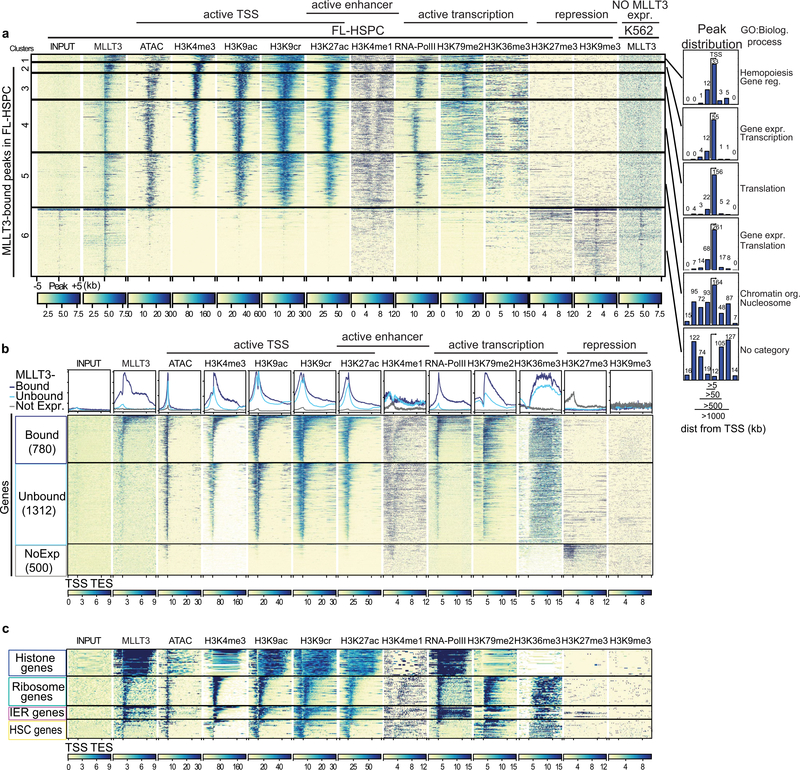
To understand how MLLT3 regulates human HSC stemness, we assessed the MLLT3 chromatin-binding pattern in FL-HSPCs. Chromatin immunoprecipitation followed by high-throughput sequencing (ChIP-seq) showed MLLT3 binding at 1,579 sites, with strongest enrichment around TSSs and within 5 kb downstream (Fig. 2a). MLLT3 peaks associated with 889 genes, 96.4% of which were expressed in FL-HSPCs, with reads per kilobase of transcript per million mapped reads (RPKM) values greater than one (Supplementary Table 3). The k-means clustering analysis showed co-localization of MLLT3 peaks with marks of active TSSs (assay for transposase-accessible chromatin using sequencing (ATAC-seq) peaks, H3K4me3, H3K9ac, H3K9cr, H3K27ac and RNA polymerase (Pol) II) (Extended Data Fig. 5a). The gene body histone mark H3K79me2 partially overlapped with MLLT3, whereas H3K36me3 was not enriched. There was minimal overlap with the enhancer mark H3K4me1 or the repressive marks H3K27me3 and H3K9me3. Thus, MLLT3 predominantly localizes to active promoters in HSPCs.
Fig. 2 |. MLLT3 binds to the TSSs of active genes in a cell-type-specific manner.
a, Distribution of MLLT3 peaks in FL-HSPCs. b, Genes expressed in FL-HSPCs (RPKM > 1, n = 3) were divided into MLLT3-bound genes (780, peak < 5 kb from the TSS) and MLLT3-unbound genes (1,312, no detectable peak), and compared to 500 randomly selected non-expressed genes (RPKM < 0.1). Red lines denote median values. P value determined by two-sided t-test. c, Average profile and heat map for MLLT3, H3K9ac, RNA Pol II and H3K79me2 ChIP-seq in FL-HSPCs. Metagene plot ± 2 kb is shown. d, GO analysis of MLLT3-bound genes in FL- HSPCs with gene numbers for each category. e, Heat maps for selected MLLT3- bound gene groups. IER, immediate early response. f, Venn diagram comparing MLLT3 peaks in FL-HSPCs and fetal liver erythroblasts (FL-Ery). g, UCSC genome browser tracks showing ChIP-seq of MLLT3 and epigenetic marks in representative MLLT3-bound genes in FL-HSPCs and FL-erythroblasts. In a–g, n = 3 MLLT3 in FL-HSPCs, n = 2 others.
Comparing MLLT3-bound genes to other expressed genes showed that, although both contained active epigenetic marks at TSSs, MLLT3- bound genes featured higher median expression, higher H3K79me2 enrichment and higher RNA Pol II occupancy (Fig. 2b, c, Extended Data Fig. 5b). Gene Ontology (GO) analysis of MLLT3-bound genes in FL-HSPCs revealed enrichment of biological processes involved in regulation of gene expression and nucleosome assembly (for example, histone genes), immune system development and haemopoiesis (for example, HSC transcription factors RUNX1, MYB, MECOM and HOXA9) and translation (for example, ribosomal proteins) (Fig. 2d, Supplementary Table 3a–c). Analysis of epigenetic marks in distinct MLLT3-bound gene groups revealed differential enrichment for H3K79me2 and Pol II: the histone genes and immediate early response genes (such as JUN and FOS) showed high Pol II occupancy but low H3K79me2, whereas HSC genes and ribosomal protein genes showed high enrichment for H3K79me2 (Fig. 2e, Extended Data Fig. 5c). These data suggest that MLLT3 may regulate distinct target genes in HSPCs by influencing H3K79me2 and/or Pol II activity.
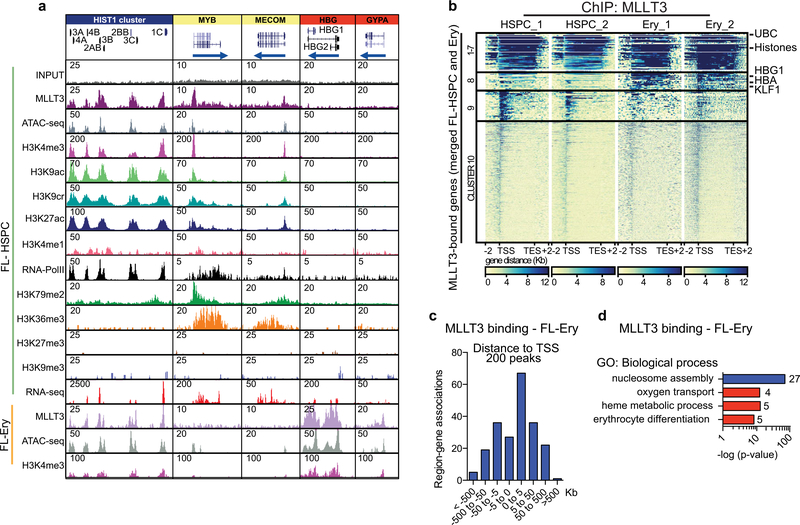
Analysis of MLLT3 binding in erythroblasts from fetal liver (Fig. 2f, Supplementary Table 3d) revealed cell-type specificity: 200 MLLT3 peaks were identified around TSSs, partially overlapping with FL-HSPC peaks (Extended Data Fig. 6a–c). Common GO categories included nucleosome assembly, whereas erythroid-specific categories included oxygen transport and haem metabolic processes (Extended Data Fig. 6d). Genome browser tracks demonstrated the correlation of MLLT3 binding with epigenetic marks of active TSS in each cell type (Fig. 2g, Extended Data Fig. 6a), and enrichment of H3K79me2 in MLLT3- bound HSC transcription factor genes.
MLLT3 protects HSC gene expression in cultured HSPCs
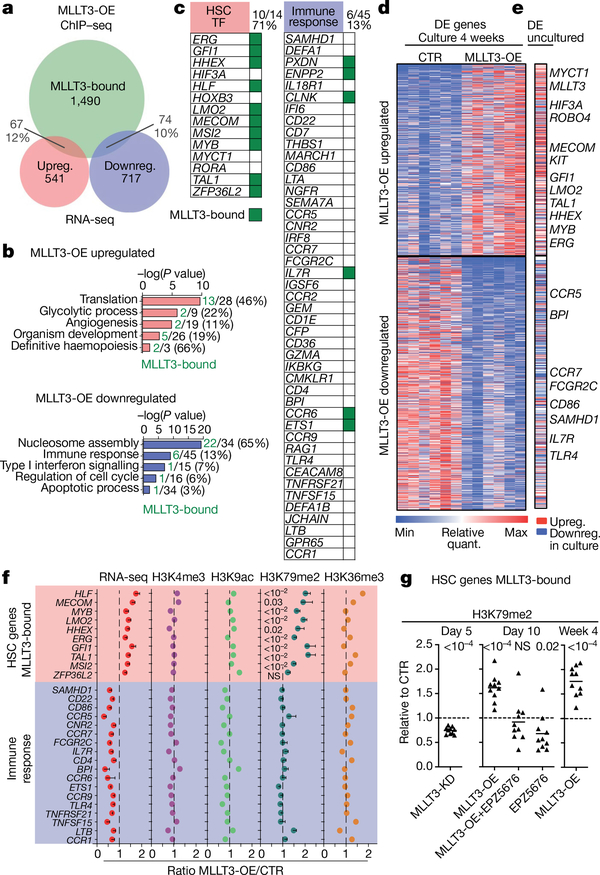
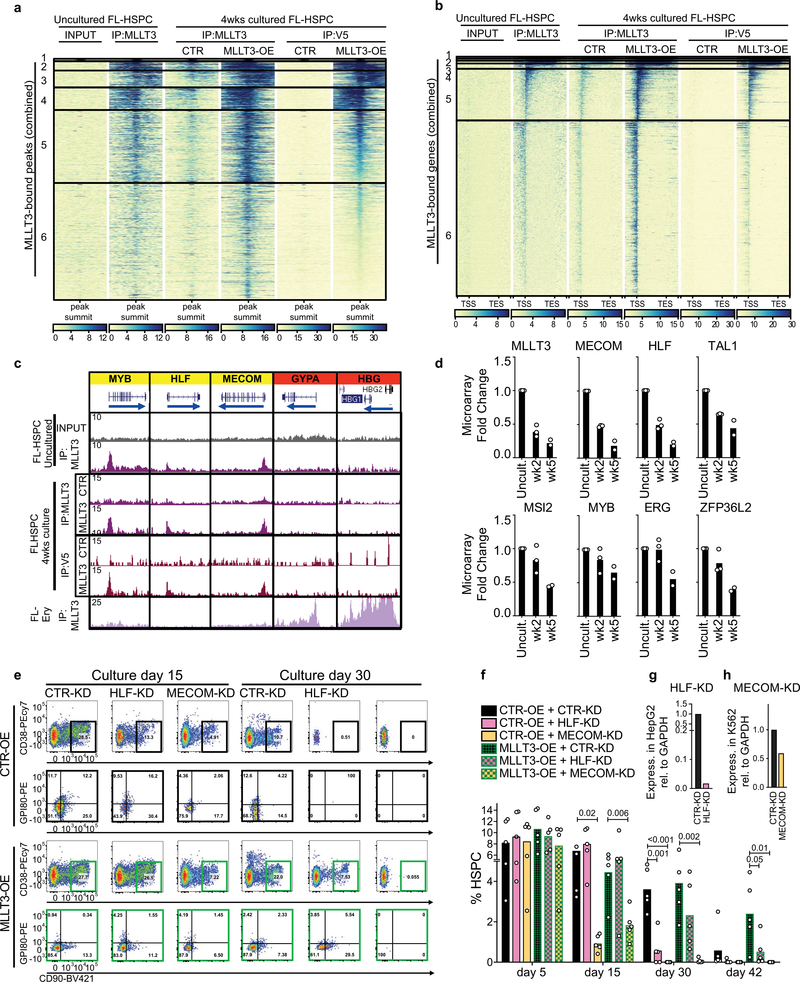
We next asked how sustaining MLLT3 expression in cultured FL-HSPCs modulates their transcriptional program. ChIP-seq data showed similar distribution of MLLT3-bound peaks and genes in uncultured HSPCs and MLLT3-OE-vector transduced HSPCs after a 4-week culture (Extended Data Fig. 7a–c). RNA-seq showed that modest differences in MLLT3 expression (2.77-fold MLLT3-OE versus control vector in HSPCs after 4-week culture) resulted in significant differential expression of 541 upregulated and 717 downregulated genes (Fig. 3a, Supplementary Table 4). Genes that regulate translation and glycolysis, and several HSC transcription factors (MECOM (also known as EVI1), HLF,MYB and GFI1) and HSC surface proteins (c-KIT (also known as KIT), CXCR4, ROBO4, EMCN and PROM1 (also known as CD133)) were significantly upregulated in MLLT3-OE HSPCs (Fig. 3b). Programs related to immune response and apoptosis were suppressed (Fig. 3b). Although MLLT3 binding was equally distributed between upregulated and downregulated genes, MLLT3 binding was enriched in specific gene categories such as MLLT3-OE-upregulated HSC transcription factor genes, and downregulated nucleosome assembly (for example, histone) genes. Immune response and apoptosis genes suppressed in MLLT3-OE HSPCs showed minimal binding (Fig. 3b–d). Comparison of cultured and uncultured HSPCs suggested that MLLT3-OE may help to diminish culture-associated drift in gene expression, either directly (HSC factors) or indirectly (immune response genes)4 (Fig. 3d, e, Extended Data Fig. 7d). Functional assessment of 2 of the 12 candidate HSC factors identified in Extended Data Fig. 1a–MECOM and HLF-both bound and upregulated by MLLT3, validated them as important MLLT3 downstream effectors that sustain HSC stemness. Knockdown of either factor resulted in premature HSPC exhaustion and diminished the effects of MLLT3-OE on HSPC expansion (Extended Data Fig. 7e–h).
Fig. 3 |. MLLT3 protects HSC sternness program through DOT1L or H3K79me2.
a, Venn diagram showing the overlap between MLLT3-bound (n = 6 MLLT3 ChIPs combined; Extended Data Fig. 7b) and MLLT3-OE up- or downregulated genes. Total number and percentage of genes are shown. b, GO analysis of genes up- or downregulated in MLLT3-OE FL-HSPCs at 4 weeks. Numbers and percentage of MLLT3-bound and total genes are shown. c, Examples of gene groups up- or downregulated by MLLT3-OE with MLLT3- bound genes marked in green. Numbers and percentage of MLLT3-bound and total genes are shown. d, Heat map showing differentially expressed genes in HSPCs transduced with MLLT3-OE or control vector after 4-week expansion (n = 6 independent experiments). P < 0.05, Benjamini-Hochberg adjusted t- test. e, Differential expression (DE) of MLLT3-regulated genes between uncultured HSPCs (n = 3) and 4-week expanded FL-HSPCs (n = 6). Selected MLLT3-regulated genes that are similarly regulated in uncultured HSPCs are highlighted. MLLT3-bound genes are in bold. f, Quantification of RNA-seq and ChIP-seq signals in MLLT3-bound, upregulated HSC transcription factor genes, and unbound, downregulated immune response genes. RNA-seq represents fold change between expanded HSPCs transduced with MLLT3-OE or control vector. ChIP-seq shows ratio of MLLT3-OE and control signal normalized to non-MLLT3-bound housekeeping gene (VCL) (n = 6 RNA-seq; n=5 H3K79me2 ChIP, n = 2 other ChIPs). Data are mean ± s.e.m. P values determined by two-sided t-test. g, Ratio of H3K79me2 signal in MLLT3-bound upregulated HSC genes between MLLT3-KD and control vector after 5-day culture (data are mean and individual values, n = 10 genes, two experiments) (left), and between MLLT3-OE, MLLT3-OE plus EPZ5676 (DOT1L inhibitor), or CTR plus EPZ5676 and control vector after 10-day culture (middle). H3K79me2 signal is normalized to S2 cell chromatin spike-in. MLLT3-OE versus control from 4-week culture is also shown (right). P values in g determined by one-sample two-sided t-test. NS, not significant.
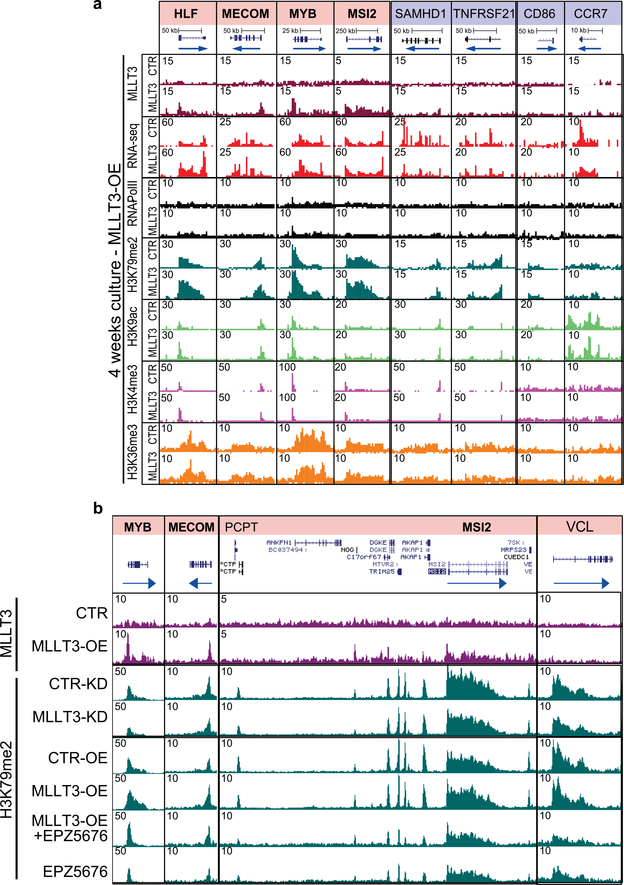
Given the strong association between MLLT3 binding and H3K79me2 deposition in genes that encode HSC regulators, we asked whether MLLT3-OE protects the expression of HSC genes in cultured HSPCs through DOT1L and H3K79me2. A significant MLLT3-dependent increase in H3K79me2 was observed in MLLT3-bound haematopoietic regulators but not in immune response genes that were indirectly downregulated by MLLT3-OE (Fig. 3f, Extended Data Fig. 8a). Other active marks tested (H3K9ac, H3K4me3 and H3K36me3) showed little change with MLLT3-OE. Dependence of H3K79me2 on MLLT3 levels was verified in MLLT3-KD HSPCs (Fig. 3g). Culture with the DOT1L inhibitor EPZ567620 reduced MLLT3-OE-associated increase in H3K79me2 in HSC genes (Fig. 3g). EPZ5676 decreased H3K79me2 in both MLLT3-bound and non-bound genes, whereas MLLT3-KD and MLLT3-OE only affected H3K79me2 in MLLT3-bound genes (Extended Data Fig. 8b). These data suggest that, although MLLT3 is not required for DOT1L activity and H3K79me2 deposition per se, MLLT3 cooperates with DOT1L in human HSCs to enhance H3K79me2 deposition in HSC regulatory genes and to maintain their activity during culture expansion.
MLLT3 enables ex vivo expansion of cord blood HSCs
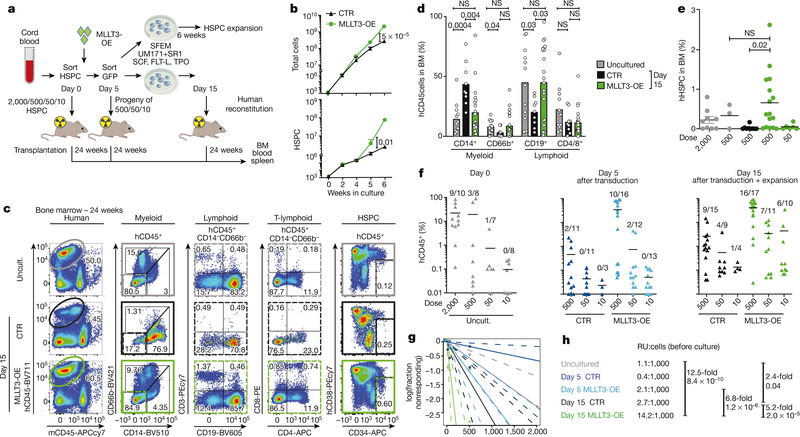
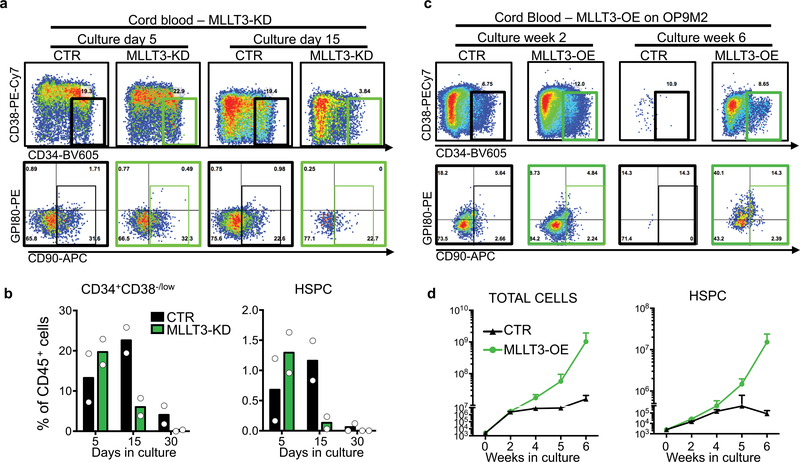
The low number of HSCs in cord blood limits their use for transplantation, despite their better availability and more permissive HLA-matching than bone marrow. We therefore asked whether MLLT3 can be used to control the self-renewal of cord-blood HSCs (CB-HSCs). MLLT3-KD in cord-blood HSPCs (CB-HSPCs) severely impaired HSPC maintenance in co-culture experiments with OP9M2 stroma cells (Extended Data Fig. 9a, b). Conversely, MLLT3-OE improved CB-HSPC expansion both in co-culture with OP9M2 cells and in serum-free conditions with UM171 and SR1 (Fig. 4a, b, Extended Data Fig. 9c, d).
Fig. 4 |. MLLT3-OE expands transplantable CB-HSCs in culture.
a, Limiting dilution analysis for assessing MLLT3-OE effects on CB-HSPC expansion and in vivo reconstitution. b, Quantification of total cell and HSPC expansion in culture (n = 3). Data are mean values. P values determined by two-sided t-test. c, Representative FACS plots showing human haematopoietic reconstitution in mice transplanted with uncultured CB-HSPCs or CB-HSPCs transduced with control or MLLT3-OE vectors and transplanted at day 15 after culture and analysed 24 weeks after transplantation. FACS plots show total human haematopoietic reconstitution (CD45), multilineage differentiation (myeloid, B-lymphoid and T-lymphoid cells) and HSPCs in hCD45+ cells. d, Quantification of differentiated populations as a percentage of hCD45+ cells in the bone marrow of engrafted mice. e, Quantification of HSPCs as a percentage of live bone marrow cells in engrafted mice. f, Quantification of human haematopoietic reconstitution In NSG mice at 24 weeks. Mice were transplanted in limited dilution doses with uncultured cells, or with transduced cells cultured for 5 or 15 days. The percentage of hCD45+ cells in bone marrow and the number of multilineage engrafted versus total transplanted mice is indicated. Data in d–f are mean and individual values from three independent experiments. P values determined by two-sided t-test. In f, n denotes engrafted mice/total transplanted mice for each condition. g, h, Calculation of reconstituting units from limiting dilution assay. Data in h are expressed as reconstituting units (RU) per 1,000 uncultured CB-HSPCs transplanted directly or transduced with MLLT3-OE or control vector and cultured for 5 or 15 days before transplantation. Expansion factors and P values between reconstituting units in uncultured HSPCs and MLLT3-OE or control vector- expanded cells were calculated using ELDA software29 and are shown.
A limiting-dilution transplantation assay (Fig. 4a) was used to quantify the expansion of transplantable HSCs (repopulating units) during CB-HSC culture. Several doses of MLLT3-OE-transduced and control- transduced cells were transplanted either at day 5 after transduction or day 15 after culture and compared to uncultured CB-HSPCs. When high doses were transplanted, multilineage human haematopoietic reconstitution was observed in mice transplanted with uncultured cells or with HSPCs transduced with control vector or MLLT3-OE vector (Fig. 4c). Quantification of lineage differentiation in engrafted mice confirmed a comparable differentiation ability ofMLLT3-OE and uncultured HSPCs (Fig. 4d), whereas HSPCs expanded by control vector showed myeloid bias. Moreover, mice engrafted with MLLT3-OE cells showed both increased HSPCs and total reconstitution compared with equal cell doses of control cells (Fig. 4e, f). Analysis of mice transplanted at limiting dilutions verified robust expansion of MLLT3-OE HSCs at 15 days of culture; 12.5-fold increase in repopulating units compared with uncultured HSPCs and a 6.8-fold increase compared with MLLT3- OE HSPCs transplanted at day 5 (Fig. 4f–h). Therefore, increased reconstitution ability was not caused merely by the expansion of MLLT3-OE cells in recipient mice. Although cells transduced with control vector showed some expansion (2.4-fold compared with uncultured HSPCs) at 15 days, the expansion of repopulating units with MLLT3-OE was 5.2-fold higher. These data corroborate the importance of maintaining MLLT3 levels during culture, both to achieve greater HSC expansion and preserve differentiation potential.
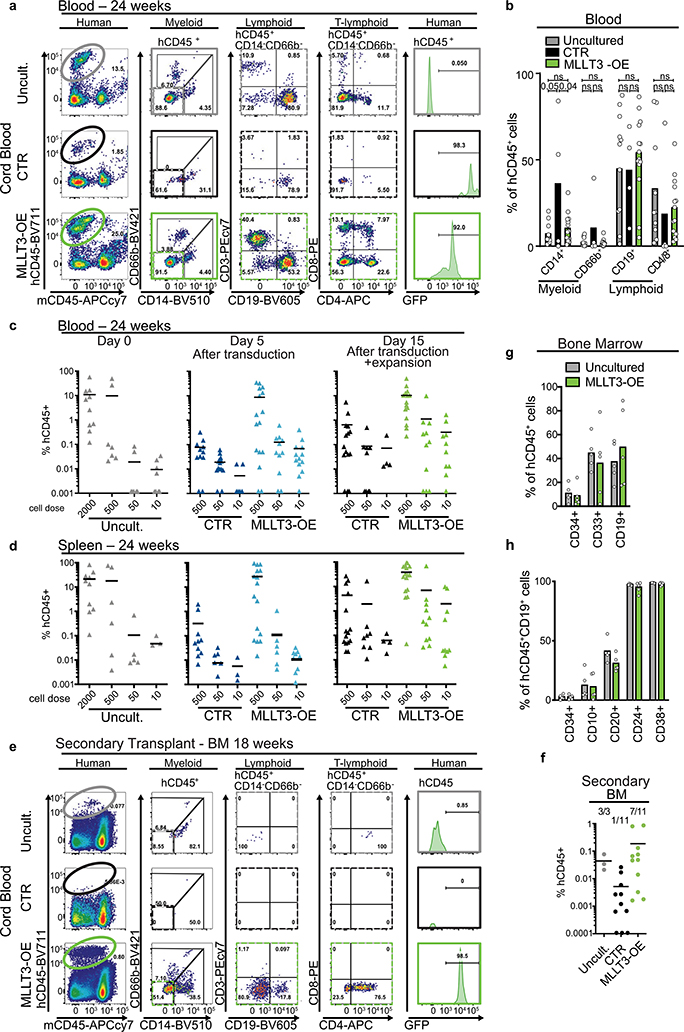
Blood and spleen showed solid human haematopoietic reconstitution by MLLT3-OE-expanded cells without evidence of lineage bias, whereas control-vector-expanded cells showed inconsistent, lower-level engraftment (Extended Data Fig. 10a–d). Secondary transplantation of bone marrow from primary mice resulted in human haematopoietic reconstitution with uncultured and MLLT3-OE cells, but not with control-vector-expanded cells (Extended Data Fig. 10e, f). Neither primary nor secondary mice transplanted with MLLT3-OE cells suffered increased mortality or expansion of immature populations (Extended Data Fig. 10g, h), unlike mice transplanted with haematopoietic cells expressing the oncogenic fusion protein MLL1–MLLT3 that rapidly developed leukaemia21,22. Thus, sustaining MLLT3 expression in CB-HSPCs during culture enables a more than 12-fold expansion of transplantable HSCs that maintain balanced multilineage haematopoiesis, demonstrating self-renewal of human HSCs in culture.
Discussion
Our discovery that restoring MLLT3 levels improves the expansion of engraftable, multipotent human HSCs when cultured with SR1 and UM171-small molecules that show promise for clinical HSC expansion19‘23‘24-suggests that combining several strategies to support HSCs may be optimal for clinical translation. Notably, recent studies showed a marked increase in mouse HSC activity after replacing albumin in culture medium25. As harnessing HSC self-renewal in culture becomes a reality, the potential for transformation and clonal haematopoiesis needs to be monitored carefully, independent of the expansion protocol used. Because every cell division in itself poses a risk for mutations, the goal should not necessarily be maximal HSC expansion, but safe expansion that preserves HSC integrity. Although no adverse effects were observed with the MLLT3-OE vector, the use of transient, nonintegrating methods to maintain MLLT3 levels would be more appropriate for clinical use.
Our work identified MLLT3 as an ‘HSC maintenance factor’ that preserves–rather than confers–HSC stemness, by reinforcing programs established by other factors. Localization of MLLT3 to active TSSs of HSC genes in human HSCs in a cell-type-specific manner, using its YEATS domain8,10, provides a molecular basis for the accurate binding of MLLT3-OE in cultured HSPCs. This explains why full-length MLLT3 does not induce a differentiation block or ectopic activation of self-renewal, unlike the oncogenic MLL1–MLLT3 fusion protein, which rapidly converts haematopoietic progenitors to self-renewing leukaemia stem cells12,21,22. Our work identifies MLLT3 as a central regulator of transcription factors that individually control HSC function26–28 and suggests that MLLT3–DOT1L-dependent regulation of H3K79me2 helps to maintain an active chromatin state in HSC regulatory genes during culture. With the ability to protect HSC stemness program as HSCs divide, without enhancing proliferation or imposing self-renewal program on progenitors, MLLT3 may help to improve HSC ex vivo expansion for clinical use.
Online content
Any methods, additional references, Nature Research reporting summaries, source data, extended data, supplementary information, acknowledgements, peer review information; details of author contributions and competing interests; and statements of data and code availability are available at https://doi.org/10.1038/s41586-019-1790-2.
Methods
Data reporting
No statistical methods were used to predetermine sample size. The experiments were not randomized, and investigators were not blinded to allocation during experiments and outcome assessment.
Human haematopoietic tissue collection and processing
Human HSPCs from fetal liver and cord blood were used to assess the function of MLLT3 in fetal and neonatal human HSC. Second trimester (14–18 weeks) fetal livers were de-identified, discarded material obtained from elective terminations of pregnancy after informed consent. Specimen age is denoted as developmental age, two weeks less than gestational age, and was determined by ultrasound or estimated by the date of the last menstrual period. Cord blood units were obtained from full-term pregnancies following informed consent and de-identified upon collection. Because these tissues are discarded material with no personal identifiers, this research does not constitute human subjects research.
Fetal liver samples were mechanically dissociated using scalpels and syringes and strained through a 70-pm mesh. Single-cell suspensions from fetal liver and cord blood were enriched in mononuclear cells by layering on Lymphoprep (Stem Cells Technologies) and centrifugation following manufacturer instructions. CD34+ cells were magnetically isolated from mononuclear cell fraction using anti-CD34 microbeads (Miltenyi Biotech).
OP9M2 stroma co-culture for HSPC expansion
Human HSC co-culture on OP9M2 (subclone of OP94, derived in our laboratory and validated by gene expression analysis) stroma was used to test the maintenance and expansion of immunophenotypic HSPCs. OP9M2 cells were irradiated (20 Gy) and pre-plated (50,000 cells cm−2) 24 h before the start of co-culture in OP9 medium, which includes a-MEM (Invitrogen), 20% fetal bovine serum (FBS; Omega) and 1x penicillin/streptomycin/glutamine (P/S/G). Human HSPCs were plated on stromal layer in OP9 medium supplemented with human HSC cytokines SCF (25 ng ml−1, Peprotech or Invitrogen), FLT3-L (25 ng ml−1, Peprotech) and TPO (25 ng ml−1, Peprotech) (HSC medium). Cells were co-cultured at 37°C and 5% CO2 and re-plated or analysed/sorted by flow cytometry for HSPC markers (CD34+CD38−/loCD90+GPI80+) every 7–14 days. Half of the HSC-medium was replaced every 2–3 days. Where indicated, 500 nM StemRegenerin1 (SR1) and 35 nM UM171 (SCT) were added to the cultures to improve human HSPC expansion.
SFEM culture for HSPC expansion
To test HSPC function in clinically relevant serum-free, stroma-free culture conditions, HSPCs were plated in StemSpan SFEM II (SCT) supplemented with human SCF (100 ng ml−1), human FLT3-L (100 ng ml−1), human TPO (50 ng ml−1), human low-density lipoprotein (10 pg ml−1, SCT), P/S/G, 500 nM SR1 and 35 nM UM171. Cells were cultured at 37 °C and 5% CO2 and re-plated or analysed/sorted by flow cytometry for human HSPC markers every 7–14 days. Half of the HSC medium was replaced every other day. In some experiments, DOT1l inhibitor EPZ5676 (Cayman) was added at a concentration of 500 nM.
Flow cytometry and cell sorting
FACS analysis was performed using single-cell suspensions prepared from fetal liver and cord blood as described above, or obtained from NSG mice transplanted with human cells.
For identification of human HSPCs, cells were stained with mouse anti-human monoclonal antibodies against human CD34-APC cl. 581 (555824; BD, 1:20) or -BV605 (343529; Biolegend, 1:20), CD90-FITC cl. 5E10 (555595; BD, 1:100) or -APC (555595; BD, 1:100), CD38-PE-Cy7 or -BUV496cl. HIT2 (560677 and 564657; BD, 1:100), GPI-80-PE cl. 3H9 (D087–5; MBL, used at 1:50). Cells were assayed on a BD-LSRII flow cytometer and data were analysed with FlowJo software (Tree Star). Cell sorting was performed using a BD FACS Aria II.
To monitor human haematopoietic engraftment in vivo in NSG mice, bone marrow cells were stained with rat anti-mouse-CD45-APC-H7 cl. 30-F11 (557659; BD, 1:100) and mouse anti-human monoclonal antibodies against human-CD45-BV711 or -BV785 cl.HI30 (304050, 304048; Biolegend, 1:100). Haematopoietic differentiation was assessed in vitro and in vivo using mouse anti-human monoclonal antibodies against human CD19-PE or BV605 cl. 1D3 or HIB19 (12–0193, 12–0199; eBiosciences, 1:50), CD3-PE-Cy7 cl. SK7 (557851, BD) (eBiosciences, 1:50), CD4-APC (MHCD0405; Invitrogen, 1:50), CD8-PE cl. HIT8A (555635; BD, 1:50), CD13-APC cl. WM15 (557454; BD, 1:50), CD66b-BV421 cl. G10F5 (555724; BD, 1:50), CD14-V500 cl. WM53 (561816; BD, 1:100), CD235a-PE or -APC (Glycophorin A, HIR2, BD 1:100), CD71-AF647 (DF1513, Santa Cruz 1:100), CD41a-APC cl. HIP8 (579777; BD, 1:20), CD42b-PEcy7 cl. HIP1 (303916; Biolegend, 1:100), CD10-AF700 cl. HI10a (563509; BD, 1:100), CD33-PE cl. WM53 (555450; BD, 1:50), CD24-BV711 cl. ML5 (563401; BD, 1:100), CD20-BV650 cl. 2H7 (563780; BD, 1:100).
Dead cells were excluded with 7AAD (BD Biosciences, used at 1:50). For assessment of cell-cycle stages or apoptosis, 7AAD was combined with BrdU-PE (556029; BD, 1:100) or annexinV-PE (556422; BD, 1:50), respectively (see below).
RNA isolation, cDNA synthesis and qRT-PCR
RNA isolation was performed using the RNeasy Mini kit (Qiagen) with additional DNase step using manufacturer’s protocol. cDNAs were prepared using High-Capacity cDNA Reverse Transcription Kit (ThermoFisher), and qPCR for GAPDH, MLLT3, MECOM and HLFwas performed with the LightCycler 480 SYBR Green I Master Mix (Roche) or TaqMan Gene Expression Master Mix on the Lightcycler 480 (Roche). Primers are presented in Supplementary Table 5.
Production of lentiviral shRNA and overexpression vectors
shRNA experiments were performed with pLKO lentiviral vectors from the TRC library containing puromycin resistance gene. shRNA TRCN00 0 0 005793 (93, Sigma) was selected for in vitro and in vivo experiments after testing for knockdown efficacy compared to other shRNAs against MLLT3 from the RNAi Consortium (TRCN0000005790 to TRCN0000005794) series. TRCN0000014790 and TRCN0000002528 were used to knockdown HLF and MECOM, respectively. shRNAs were tested on the K562 and Hep2G cell lines, obtained by ATCC and mycoplasma-free.
Human MLLT3 was cloned from human FL-HSPC full-length cDNA into the constitutive FUGW (Addgene plasmid 14883, from D. Baltimore) lentiviral vector, in which its expression is controlled by the UBC promoter. MLLT3 cDNA with a C-terminal V5-tag was inserted downstream and in frame with the GFP sequence with the synthetic addition a P2A sequence between the 2 ORFs, through two rounds of PCR (Supplementary Table 4) using PfuUltra II Ultra Fusion HS (Agilent).
For lentiviral vector production, 20 million 293T cells were co-transfected with deltaR8.2 packaging plasmid, VSVG-envelope plasmid, the lentiviral vector plasmid of choice and Turbo DNAfectin 3000 (Lamda), following manufacturer’s instructions, in Opti-MEM (Life Technologies) and incubated for 5–6 h at 37 °C. After incubation for 48 h in Ultraculture medium (Lonza), supernatant was filtered and concentrated by ultracentrifugation and pelleted viruses were resuspended in SFEM and stored at −80 °C.
Lentiviral transduction
Sorted fetal liver and cord blood HSPCs were prestimulated 24 h in StemSpan SFEM II supplemented with SCF, FLT3-L, TPO and antibiotic- antimycotic (LT). Wells were pre-coated with 40 μg ml−1 RetroNectin (Takara) and seeded with pre-stimulated HSPC in 300 pl SFEM. Lentivirus was added twice, first after 24 h from cell seeding and again after additional 8 h. After 48 h from cell seeding, transduced cells were washed and seeded in the indicated conditions for each assay. For shRNA-lentiviral vectors, puromycin (1.0 μg ml−1) treatment was used for selection of transduced HSPCs and maintained throughout culture. Cells infected with overexpression vectors were selected by cell sorting for GFP expression.
Haematopoietic differentiation assays
FL-HSPCs sorted directly or after 4 weeks of expansion on OP9M2 were plated on differentiation assays. For myeloid assay, FL-HSPCs were plated in StemSpan SFEM II (SCT) supplemented with G-CSF (20 ng ml−1, Peprotech), GM-CSF (20 ng ml−1, Peprotech), TPO (25 ng ml−1) and SCF (25 ng ml−1). For the erythroid assay, HSPCs were plated in StemSpan SFEM II supplemented with IL-3 (20 ng ml−1, Peprotech), EPO (2.5 IU, Thermo Fisher Scientific), SCF (25 ng ml−1), L-glutamine and antibiotic-antimycotic. For the megakaryocyte differentiation assay, HSPCs were plated in IMDM supplemented with recombumin (0.4% Albumedix), 2-mercaptoethanol (100 μM, Gibco), SCF (100 ng ml−1), TPO (50 ng ml−1), IL-3 (10 ng ml−1), IL-6 (7.5 ng ml−1, Peprotech), IL-9 (13.5 ng ml−1, Humanzyme), human low-density lipoprotein (4 μg ml−1, SCT), ITS-X (Gibco), glutamax and antibiotic-antimycotic. For the T cell assay, HSPCs were plated on non-irradiated OP9-DLL1 stroma (25,000 cells cm−2) in OP9 medium supplemented with SCF (25 ng ml−1), FLT3-L (10 ng ml−1) and IL-7 (20 ng ml−1, Peprotech). For the B cell assay, HSPCs were seeded on irradiated OP9M2 in MEM-alpha 5% FBS supplemented with SCF (25 ng ml−1), FLT3-L (10 ng ml−1) and IL-7 (20 ng ml−1). In each assay, cells were cultured in 24-well plates with 1 ml of the indicated medium and half medium changes were applied every 2–3 days. Cells were analysed by flow cytometry after 2 weeks.
Cell cycle and apoptosis assays
For the BrdU incorporation analysis in vitro, control- or MLLT3-OE- transduced FL-HSPCs were cultured for 4 weeks on OP9M2 with 500 nM SR1 and 35 nM UM171 and pulse-labelled with 10 μM BrdU for 35 min in culture. Cells were sorted for the indicated surface phenotypes and processed according to the PE-BrdU flow kit (BD) instructions and analysed by flow cytometry. Apoptosis from FL-HSPCs cultured in the same conditions was assessed by flow cytometry using annexin-V-PE (BD) and 7AAD incorporation, following manufacturer instructions.
Transplantation assays in NSG mice
In vivo reconstitution ability of cultured HSPCs was assessed in immunodeficient mice. Female NSG (Jackson Laboratories) mice, 8–12 weeks old, were sub-lethally irradiated (2.75 Gy) and retro-orbitally injected with cells derived from fetal liver or cord blood in a volume of 100 μl of RPMI.
For MLLT3 shRNA knockdown experiments, 30,000 fetal liver CD34+ cells were infected with MLLT3 shRNA or control lentivirus and cultured on OP9M2 for 9 days under puromycin selection before transplantation. At 12 weeks, MLLT3-KD mice were euthanized to obtain bone marrow.
For MLLT3-OE experiments with FL-HSPCs, mice were transplanted with the progeny of 1,000 sorted GPI80+ FL-HSPCs (CD34+CD38−/lo CD90+GPI80+). Cells were transduced with the MLLT3-OE or control vector and re-sorted after 5 days for GFP+CD34+ cells. These cells were either injected retro-orbitally immediately after sorting (day 5) or expanded on SFEM for an additional 10 days (day 15) before injection. After 24 weeks, mice blood was collected, and mice were euthanized to obtain bone marrow and spleen. Collected cells were analysed by FACS to evaluate human engraftment (human CD45 and absence of mouse CD45). Reconstituted mice were defined by the presence of GFP+ (MLLT3-OE and control vector) human CD45 cells that differentiated to myeloid and lymphoid lineages 24 weeks after transplantation. Differentiation into myelo-lymphoid lineages was evaluated by the detection of myeloid (CD14 or CD66b), B-lymphoid (CD19) and T-lymphoid (CD3, CD4 and CD8) markers on human CD45+ cells. Of note, T-lymphoid engraftment was evaluated only at 24 weeks from transplantation, owing to the absence of reliable T-lymphoid differentiation at week 12 (MLLT3-KD, Extended Data Fig. 1k). Preservation of the HSPC compartment (CD34+CD38−/lo) was also recorded.
For BrdU incorporation analysis in vivo, NSG mice were transplanted with high doses of human FL-HSPCs (8,000 GPI80+ HSPCs or their progeny at culture day 15 after transduction with control or MLLT3-OE vector). Then 14 weeks after transplantation, 2 mg of BrdU was injected intraperitoneally. Mice were euthanized 100 min after and bone marrow was collected. Cells were sorted for the indicated surface phenotypes and processed according to the PE-BrdU flow kit (BD) instructions and assessed by flow cytometry.
For secondary transplantations, viably frozen bone marrow from primary NSG mice transplanted with 15-day cultured HSPCs or uncultured HSPCs was used. Bone marrow from mice from the same experimental group was pooled and a dose equivalent of 1/2 femur of the primary mouse total bone marrow was injected retro-orbitally in sub-lethally irradiated secondary recipients. Human engraftment was assessed in bone marrow after 18 weeks from transplantation.
For the limiting dilution assay, CB-HSPCs were injected after FACS sorting, after transduction and sorting transduced cells (GFP+CD34+, day 5), or after an additional 10 days of expansion in culture (day 15). The number of cells reported (2,000, 500, 50, 10) is the number of sorted HSPCs (uncultured) that was transplanted directly, or the progeny of which was transplanted after culture (days 5 and 15). The criteria for multilineage engraftment was having hCD45 positive (GFP+ with MLLT3 and CTR vector) cells that displayed at least one myeloid (CD14 CD66b or both) and the B-lymphoid (CD19) marker. HSC frequency was assessed using ELDA software29.
A panel of markers covering the classical AML blast (CD34 and CD33) and B-cell precursor markers (CD34, CD10, CD20, CD24, CD38) altered in MLL-MLLT3 fusion gene-driven leukaemia in immunodeficient mice were tested in mice transplanted with day-15-expanded MLLT3-OE CB- HSPCs and uncultured CB-HSPCs.
All transplanted mice were included in the analysis unless they died before the experimental endpoint (in total from combined fetal liver and cord blood experiments, 14 out of 115 mice transplanted with MLLT3-OE, 17 out of 98 mice transplanted with control vector HSPCs, and 3 out of 36 mice with uncultured HSPCs died before 24 weeks).
All studies and procedures involving mice were conducted in compliance with all the relevant ethical regulations and were approved by the UCLA Animal Research Committee (protocol 2005–109).
ChIP-seq analysis
Sorted FL-HSPCs or erythroblasts (CD34−CD235+CD71+) (50,000–10,0000 per immunoprecipitation) were crosslinked in 1% formaldehyde for 10 min, quenched with glycine 0.0125 M and snap-frozen as a dry pellet. The pellet was re-suspended in lysis buffer (50 mM Tris, pH 8.2, 10 mM EDTA, 1% Triton X-100, 0.1% sodium deoxycholate, 0.5% sarkosyl) and sonicated 12 min at a 5% intensity using Misonix cup-horn sonicator. Chromatin was incubated overnight with 2 μg of antibody (anti-MLLT3, Genetex, GTX102835; anti-V5, Abcam, ab15828; H3K4me3, Abcam ab8580; H3K9ac, CST 9649; H3K9cr, PTM PTM-516; H3K36me3, Abcam ab9050; H3K79me2, Abcam, ab3594; RNA-polII Rbp1 (8WG16) Biolegend 664911, H3K27ac, AM 39133; H3K4me1, AM 39297; H3K27me3, AM 39155; H3K9m3, AM 39161) preloaded onto 20 pl of Protein G Dynabeads (Thermo Fisher) and washed twice with each of the solutions (low-salt wash, high-salt wash, LiCl wash and TE buffer) as previously described30.
ChIP experiments for H3K79me2 were also performed from shortterm cultures with FL-HSPCs transduced with either MLLT3-KD (no. 93) or MLLT3-OE vector and respective controls. Knockdown was collected at day 5, which included 3 days of puromycin selection. MLLT3-OE were sorted for GFP and collected at day 10, which included 4 days of EPZ5676 treatment at 500 nM, or DMSO as a control. Sonicated chromatin from these chips was spiked-in with S2 chromatin (Activ Motif) following manufacturer instructions. Libraries were prepared with the Nugen Ovation Ultralow kit v2 following manufacturer instructions and sequenced using HiSeq-4000 (Illumina) to obtain single-end 50-bp long reads. Demultiplexing of the reads based on the barcoding was performed using in house Unix shell script. Mapping to the human genome (hg19) was performed using bowtie2. Samtools v.1.3.1 package was uses to create a .bam file, remove duplicates, blacklisted region and ChrM regions, sort and index. Bedtools multicov was used to quantify histone mark signals. GO analysis on genes bound by MLLT3 was calculated using Homer annotatePeaks.pl31 using -go function and statistic is reported as P value, calculated with standard parameters by the algorithm. Each H3K79me2, H3K4me3, H3K36me3 and H3K9ac ChIP replicate on MLLT3-OE (Fig. 3f) is internally normalized using the non-MLLT3-bound, housekeeping gene VCL (Extended Data Fig. 8b). For H3K79me2 ChIP samples spiked in with S2 chromatin, sequences were aligned to both the human and Drosophila melanogaster genome (dm6) and the quantified reads, were normalized by total reads aligned to dm6 for each sample (Fig. 3g). Coverage files, average profiles heat maps were created with Deeptools packages32. MACS2 v.2.1.133 was used to call MLLT3 peaks using default parameters for broadPeak calling.
ATAC-seq analysis
FL-HSPCs or erythroblasts (CD34−CD235+CD71+) (50,000 sorted cells) were processed according to the protocol34, with minor adjustments. Nuclei were purified by the addition of 250 pl of cold lysis buffer (10 mM Tris-HCl, pH 7.4, 10 mM NaCl, 3 mM MgCl2, 0.1% IGEPAL CA-630) to sorted cells, pelleted and resuspended in the transposition reaction mix (Nextera DNA Library Prep Kit, Illumina) and incubated at 37 °C for 30 min. Transposed DNA was column purified and used for library amplification with custom made adaptor primers34 using NEBNext High-Fidelity 2× PCR Master Mix (New England Labs). The amplification was interrupted after 5 cycles and a SyBR green qPCR was performed with 1/10 of the sample to estimate for each sample the additional number of cycles to perform before saturation was achieved. Total amplification was between 10 and 15 cycles. Purified libraries were sequenced using HiSeq-2000 (Illumina) to obtain paired-end 50-bp long reads. Read-mapping to the genome (hg19) was done using Bowtie2 or v.2.2.935 with parameters-local -X 2000 -N 1-no-mixed. The Bamcoverage tool from Deeptools was used to create the coverage .bw files for visualization32. Samtools v.1.3.1 was used to remove duplicates and reads aligned to chrM.
RNA-seq analysis
Total RNA from 50,000 sorted HSPCs was extracted using the RNeasy Mini kit (Qiagen) and library was constructed using KAPA RNA Hyper-Prep Kit with RiboErase (HMR). Libraries were sequenced using HiSeq-4000 (Illumina) to obtain paired-end 50-bp long reads. Mapping to the human genome (hg19) was performed using TopHat v.2.0.9 or v.2.0.1436 with the parameters-no-coverage-search -M -T -x 1. Coverage files were created with the Genomecov tool from Bedtools37 with the parameters -bg -split -ibam. For abundance estimations (FPKMs) the aligned read files were further processed with HOMER coupled to edgeR on the hg19 annotation. GO was calculated using DAVID38 and statistic is reported as P value, calculated with standard parameters by the algorithm. Gene expression changes were considered significantly up- and downregulated when adjusted P < 0.05 (–log-transformed fold change > 0.322). The selection of differentially expressed genes is based on adjusted P value (significant across six replicates) rather than fold change because, as MLLT3 is required to maintain HSC identity and viability, the changes observed in the HSPC compartment reflect the beginning of MLLT3-dependent processes, not the end point. Heat maps were generated using Morpheus (Broad Institute) using a colour scale normalized by the minimum and maximum value for each gene.
Reporting summary
Further information on research design is available in the Nature Research Reporting Summary linked to this paper.
Data availability
Sequence data that support the findings of this study have been deposited in Gene Expression Omnibus (GEO) with the accession code GSE111484. Data from published reference are available in GEO GSE8108017. All other data are either available within the paper or from the corresponding author upon reasonable request. Custom codes for data analysis are also available upon request. There is no restriction in data availability.
Extended Data
Extended Data Fig. 1 |. MLLT3 expression in human haematopoietic tissues and after shRNA knockdown.
a, Candidate human HSC self-renewal factors that correlate with the self-renewal of human FL-HSCs (Fig. 1a) and are localizec in the nucleus are listed. b, Bar graphs showing mean and individual probe values for MLLT3 from microarray datasets after differentiation of CD34+CD38−/loCD90+GPI80+FL-HSCs to CD34+CD38−/loCD90+GPI80− progenitors3, in FL-HSPCs after 5-week culture on OP9M2 stroma4, and in hES cell-HSPCs5 (n = 3; n = 2 for 5-week culture and hES cell-HSPCs). c, Quantitative PCR with reverse transcription (qRT-PCR) validation of MLLT3 expression in human fetal liver, cord blood and bone marrow HSPCs and downstream progenitors (n = 2 donors per tissue). Expression is relative to GAPDH, normalized to the first sample of each plot. Mean and individual values are shown. d, UCSC genome browser tracks of RNA-seq analysis of sorted human developmental haematopoietic populations17. First trimester (5 weeks) embryonic aorta-gonad-mesonephros (AGM) endothelium (CD34+CD90+CD43−) and HSPC (CD34+CD90+CD43+) population from one donor are compared to second trimester (17-week) FL-HSPCs (CD34+CD38−/lo CD90+CD45+). Expression of transcription factors involved in the development of haemogenic endothelium and HSC specification are compared to MLLT3. e, f, Flow cytometry analysis (e) and quantification (f) of GFP fluorescence in human K562 cells (haematopoietic cell line with no detectable MLLT3 expression) stably expressing MLLT3-OE vector (as in Extended Data Fig. 2a), that were transduced with five different shRNAs targeting MLLT3 (sh_90–94), representative of two transductions. shRNA-mediated knockdown targeting MLLT3 also lowers GFP that is transcribed from a single GFP-P2A-MLLT3 transcript. Median fluorescence intensity (MFI) from n = 2 transductions (mean and individual values). g, Strategy for MLLT3 lentiviral knockdown and functional analysis in FL-HSPCs. h, FACS plots 5 and 15 days after MLLT3-KD (representative of three experiments). i, j, MLLT3 qRT-PCR 5 days after transduction (i) and quantification of CD34+CD38−/lo (j) in cells transduced with empty vector or MLLT3 shRNA (KD92 and KD93) after 5 and 15 days in culture (mean and individual values, n = 3 donors). k, Representative FACS plots from NSG mouse bone marrow 12 weeks after transplantation assessing human CD45+ cells, multi-lineage haematopoietic reconstitution and HSPCs (extended from Fig. 1d, n = 10 mice, 2 independent experiments).
Extended Data Fig. 2 |. Effects of MLLT3-OE on HSPC expansion.
a, FUGW lentiviral construct expressing MLLT3 and GFP. P2A, cleavage sequence; UbC, ubiquitin C promoter; V5, V5 peptide tag. Representative flow cytometry plots showing persistent GFP expression in FL-HSPCs after transduction with control or MLLT3-OE vector, representative of six experiments. b, qRT-PCR quantifying MLLT3-OE in transduced HSPCs after one week (mean, n = 3). c, The effects of MLLT3-OE in GP180+(red) and GP180− (blue) FL-HSPC progenitors. d, Representative FACS plots derived from GP180+ HSPCs (top) and GP180− progenitors (bottom) expressing control and MLLT3-OE vectors. e, Expansion of total live cells (left) and HSPCs (right) expressing control or MLLT3-OE vectors (mean and s.e.m., n = 3). f, Strategy for lentiviral overexpression of MLLT3 in FL-HSPCs seeded with or without OP9M2 stroma to assess their dependence on a supportive microenvironment. g, Representative FACS plots of FUGW empty-vector-transduced and MLLT3-OE-transduced GP180+ HSPCs seeded on OP9M2 (top) or stroma-free culture wells. h, Expansion of total live cells (left) and CD34+CD38−/lo CD90+HSPCs (right) transduced with control or MLLT3-OE vectors (mean and s.e.m., n = 3 independent experiments). Culture of MLLT3-OE HSPCs with small molecules UM171 and SR1. i, Expansion of total live cells (top) and CD34+CD38-/loCD90+HSPCs (bottom) transduced with control or MLLT3-OE vectors (mean and s.e.m., n = 2 independent experiments), cultured in SFEM with SR1 and UM171.j, Expansion of total live cells (top) and CD34+CD38−/loCD90+ HSPCs (bottom) transduced with control or MLLT3-OE vectors (mean and s.e.m., n = 3 independent experiments), cultured in HSC medium on OP9M2 with SR1 and UM171. P values in e, h and j determined by two-sided t-test.
Extended Data Fig. 3 |. Effects of MLLT3-OE on cell cycle, viability and differentiation in culture.
a, Strategy to test cell-cycle activity, apoptosis and differentiation potential of MLLT3-OE-expanded HSPCs. b, BrdU incorporation flow cytometry analysis of FL-HSPCs cultured for 4 weeks on OP9M2 with SR1 and UM171. G0/G1 (BrdU−AADl°), S (BrdU+7AADlnt) and G2/M (BrdU−7AADhi) phases are quantified in FL-HSPCs (mean and s.e.m., n = 5). c, Apoptosis analysis of HSPCs cultured for 4 weeks on OP9M2 with SR1 and UM171. Early (AnnV+7AAD−) and late (AnnV+7AAD+) apoptosis are quantified by flow cytometry (mean and s.e.m., n = 2 uncultured, n = 4 control and MLLT3-OE). d, FACS analysis of in vitro differentiation (representative of three experiments). e, Quantification of the differentiation of 4-week expanded HSPCs into myeloid, erythroid, megakaryocytic, B- and T-lymphoid lineages, compared with the differentiation of uncultured FL-HSPCs (mean, n = 3 donors except for megakaryocytic n = 4 and B-lymphoid uncultured n = 2). All P values determined by two-sided t-test.
Extended Data Fig. 4 |. Analysis of human reconstitution and correlation of cell cycle and culture time with the engraftment of MLLT3-OE cells.
a, Transplantation strategy with ex vivo expanded FL-HSPCs transduced with control or MLLT3-OE vector. On day 5, transduced CD34+GFP+ cells derived from 1,000 HSPCs were sorted and replated in SFEM and transplanted into NSG mice at day 15. Human haematopoietic reconstitution was assessed at 24 weeks. Bone marrow from engrafted mice was transplanted to secondary recipients. b, FACS analysis showing human haematopoietic reconstitution (hCD45) (Fig. 1h) and multilineage differentiation (myeloid CD66, CD14; B-lymphoid CD19; T-lymphoid CD3, CD4, CD8). c, d, Representative FACS plots (c) and quantification (d) of human haematopoietic reconstitution from peripheral blood of transplanted NSG mice (extended from Fig. 1h). e, Quantification of human haematopoietic reconstitution from mouse spleen. Number of mice showing multi-lineage reconstitution versus total transplanted mice is shown (n = 13 or 14 mice, mean and individual values from four independent experiments). f, FACS sorting strategy for cell-cycle analysis after 100 min in vivo BrdU pulse in haematopoietic cells derived from human FL-HSPCs (8,000 GPI80+FL-HSPCs or their progeny day 15 of culture after transduction with control or MLLT3-OE vector) transplanted in NSG mice and sorted 14 weeks after transplantation. g, h, Representative FACS plots (g) and quantification (h) of cell-cycle distribution by BrdU and DNA content (7AAD) staining. G0/G1 (BrdU−7AADl°), S (BrdU+7AADlnt) and G2/M (BrdU−7AADhi) phases are quantified in HSPCs, CD66b+ myeloid and CD19+ B-lymphoid cells (mean, n = 2). i, j, Cell-cycle analysis in HSPCs before transplantation, after 2-week culture in SFEM with SR1 and UM171. All P values determined by two-sided t-test. k, Transplantation strategy assessing the effect of extended culture on the reconstitution ability of MLLT3-OE FL-HSPCs. FL-HSPCs transduced with control or MLLT3-OE vector were sorted on day 5, and CD34+GFP+ cells derived from 1,000 uncultured HSPCs were transplanted directly into NSG mice or cultured in SFEM for an additional 10 days before transplantation. Numbers show mice with multilineage human engraftment, transplanted before (day 5) and after (day 15) culture expansion. l, m, Human CD45+ cells (l) and human HSPCs (m) in mouse bone marrow are quantified (n = 4 independent experiments; number of mice is indicated). *P < 0.05, two-sided t-test. n, o, Representative FACS plots (n) and quantification (o) of human haematopoietic (CD45) reconstitution and multilineage differentiation in mouse bone marrow after 18 weeks of secondary transplantation (mean, two independent experiments). Secondary mice were transplanted with 2-week-old bone marrow from primary recipients (1/2 of femur of the primary transplanted mice injected per recipient).
Extended Data Fig. 5 |. MLLT3 binding and correlation with epigenetic marks.
a, Heat map showing k-means clustering for MLLT3 ChIP-seq peaks and their association with ATAC-seq and histone marks in uncultured FL-HSPCs. ChIP of MLLT3 in K562 cells is shown as a control. The region surrounding the MLLT3 peak centre ± 5 kb is shown. Peak distance from the gene TSSs and representative high-ranked biological processes enriched in GREAT analysis are shown for each cluster. Cluster 6 genes, in which the MLLT3 signal does not correlate with active marks, show no significant enrichment for biological processes. b, Average profile and heat map for MLLT3 and indicated histone marks in expressed and non-expressed genes in uncultured FL-HSPCs. Metagene plot ± 2 kb is shown. This represents an extended version of Fig. 2c. c, Heat map for selected gene groups as in b. This represents an extended version of Fig. 2e. Tracks in a–c are representative of n = 3 experiments for MLLT3 ChIP in FL-HSPCs, n = 1 for H3K9cr, H3K27me3 and H3K9me3, and n = 2 for other ChIP experiments.
Extended Data Fig. 6 |. Cell-type specificity of MLLT3 binding.
a, UCSC genome browser tracks showing ChIP-seq of MLLT3 and epigenetic marks in representative MLLT3-bound genes in FL-HSPCs and FL-erythroblasts (n = 3 MLLT3 ChIP in FL-HSPCs, n = 1 for H3K9cr H3K27me3 and H3K9me3, and n = 2 for other ChIP experiments). This represents an extended version of Fig. 2g. b, Heat map with hierarchical clustering for genes bound by MLLT3 in FL-HSPCs (n = 2) and/or CD34−GlyA+CD71+ FL-erythroblasts (n = 2) (genes with significant MLLT3 peak < 5 kb from TSS) showing clusters of common and cell-type- specific MLLT3-bound genes. c, Distribution of MLLT3 FL- erythroblast peaks. d, GO analysis of MLLT3-bound genes in FL-erythroblasts.
Extended Data Fig. 7 |. MLLT3 binding and regulation of MLLT3 target genes in cultured HSPCs.
a, Heat map showing distribution of MLLT3 peaks reflecting endogenous MLLT3 and MLLT3-OE ChIP-seq signal using MLLT3 and V5 antibodies. MLLT3 from uncultured FL-HSPCs and input control, MLLT3 ChIP signal from 4 week cultured FL-HSPCs with MLLT3-OE or empty control vector, and V5 ChIP from FL-HSPCs cultured for 4 weeks with MLLT3-OE or control vector. The region surrounding the peak summit (± 2 kb) is shown for the combined MLLT3 peaks from all conditions (FL-HSPC MLLT3 ChIP n = 3, MLLT3-OE V5 ChIP n = 2 and MLLT3-OE MLLT3 ChIP n = 1). IP, immunoprecipitate. b, Heat map showing hierarchical clustering for all MLLT3- bound genes as in a. Signal from all MLLT3-bound genes (significant MLLT3 peak at < 5 kb from TSS) is shown. c, UCSC genome browser tracks of representative MLLT3-bound HSC (yellow) and erythroid (red) genes. Tracks show ChIP-seq signal for input and MLLT3 in uncultured FL-HSPCs, MLLT3 ChIP-seq on FL-HSPCs cultured for 4 weeks with control and MLLT3-OE vectors; V5-tagged MLLT3 ChIP-seq from FL-HSPCs cultured for 4 weeks with control and MLLT3-OE vectors, and MLLT3 ChIP-seq in FL-erythroblasts. d, Probe values from microarray datasets4 for MLLT3 and MLLT3-bound and upregulated HSC genes (see Fig. 3) documenting the decline of gene expression over time in culture (day 0 (n = 3) 2 weeks (n = 3) and 5 weeks (n = 2) on OP9M2, mean and individual values). e–g, Knockdown of MLLT3 targets MECOM and HLF in MLLT3-OE cells. e, FACS plots at 15 and 30 days after MECOM-KD and HLF-KD, with or without MLLT3-OE (representative of three experiments). f, Quantification of CD34+CD38−/lo CD90+ HSPCs (percentage of live cells) in MECOM-KD and HLF-KD FL-HSPCs transduced with empty vector or MLLT3-OE after 5, 15, 30 and 42 days in culture (mean, n = 3). P values determined by two-sided t-test. g, Quantification of HLF downregulation in HepG2 cells by qRT-PCR. h, Quantification of MECOM downregulation in K562 cells by qRT-PCR.
Extended Data Fig. 8 |. Examples of MLLT3-mediated gene regulation after MLLT3-OE, MLLT3-KD and DOT1L inhibition.
a, UCSC genome browser tracks of representative MLLT3-OE upregulated or downregulated genes. From top to bottom: MLLT3 ChIP-seq signal in FL-HSPCs cultured for 4 weeks with empty vector or MLLT3-OE; RNA-seq tracks; ChIP-seq for RNA Pol II and epigenetic marks in cultured control and MLLT3-OE FL-HSPC. Tracks are generated from the merged signal from n = 5 H3K79me2 ChIP, n = 2 other ChIPs. b, UCSC genome browser tracks of the indicated ChIP experiments in representative genes in MLLT3-KD and control vector after 5-day culture, MLLT3-OE, MLLT3- OE plus EPZ5676 (DOT1L inhibitor), or control plus EPZ5676 and control vector after 10-day culture, and MLLT3-OE versus control from 4-week culture. Genes from Fig. 3g are indicated in bold. The genomic region adjacent to MS12 is included to show genes not bound by MLLT3 (that is, PCPT and VCL).
Extended Data Fig. 9 |. Effects of MLLT3 knockdown and overexpression on CB-HSPC expansion in vitro.
a, FACS analysis, 5 and 15 days after MLLT3-KD in CB-HSPCs (representative of two experiments). b, Quantification of haematopoietic subsets CD34+CD38−/lo and CD34+CD38−/loCD90+ (HSPCs) in empty vector (CTR) and MLLT3-KD-transduced cells after 5, 15 and 30 days in culture (mean, n = 2). Circles represent individual values. c, FACS analysis of CB-HSPCs transduced with control or MLLT3-OE vectors cultured on OP9M2 (representative of two experiments). d, Expansion of total live cells (left) and CD34+CD38−/lo CD90 HSPCs (right) transduced with MLLT3-OE or control vectors.
Extended Data Fig. 10 |. Comparison of the function of MLLT3-OE cells and uncultured cells in transplanted mice.
a, FACS analysis of total human haematopoietic reconstitution in peripheral blood from mice transplanted with uncultured CB-HSPCs (CD34+CD38−CD90+) or CB-HSPCs transduced with empty GFP vector (CTR) or MLLT3-OE vector after 15 days of culture, as in Fig. 4f (representative of three experiments). Plots show human CD45 haematopoietic reconstitution and multilineage differentiation (myeloid CD66, CD14; B-lymphoid CD19; T-lymphoid CD3, CD4, CD8), and GFP in hCD45+ cells. b, Quantification of monocytes (CD14+), granulocytes (CD66b+), B cells (CD14−CD66b−CD19+) and T cells (CD14−CD66b−CD4+and/or CD8+) as a percentage of human CD45+ cells in engrafted NSG mice 24 weeks after transplantation (mean, n = 3 experiments). P values determined by two-sided t-test. Quantification of human haematopoietic reconstitution in the blood of NSG mice 24 weeks after transplantation in limiting dilution, as in Fig. 4f. Percentage of hCD45+ cells in peripheral blood (c) and spleen (d) (mean, n = 3 experiments). e, f, FACS plots (e) and quantification (f) of total human CD45+ haematopoietic reconstitution after 18 weeks of secondary transplantation of cord blood (uncultured, day-15-expanded control and MLLT3-OE HSPCs) in mouse bone marrow (mean, n = 2 experiments). g, h, Quantification of human reconstitution in engrafted mice after 24 weeks of primary transplantation. A panel of markers covering the classical AML blast (CD34 and CD33) and B-cell precursor markers (CD34, CD10, CD20, CD24, CD38) were tested in day 15-expanded MLLT3-OE CB-HSPCs, comparing their distribution to mice engrafted with uncultured CB-HSPCs (n = 5 mice from two independent experiments, mean and individual values). Haematopoietic markers included CD33+ myeloid, CD19+ lymphoid, and B-cell precursor markers CD34+ CD10+, CD20+, CD24+ and CD38+within the CD19+ population.
Supplementary Material
Acknowledgements
We thank BSCRC flow cytometry (F. Codrea, J. Scholes and J. Calimlim) and sequencing (S. Feng) cores, TCGB (NIH P30CA016042) and CFAR cores (NIH P30AI028697-21) at UCLA. We thank J. Zhao, T. Montoya and D. Dou for assistance with experiments; V. Rezek, D. Johnson and O. Witte for help with NSG mice and D. Kohn, Z. Romero and R. Hollis for help with lentiviral vectors. This work was supported by NIH RO1 DK100959 and RO1 DK121557; Broad Stem Cell Center at UCLA, Rose Hills Foundation, Jonsson Cancer Center Foundation, and UCLA David Geffen School of Medicine Regenerative Medicine Theme Award for H.K.A.M.; LLS Special Fellow Award and BSCRC post-doctoral fellow award for V.C.; CIRM GC1R-06673B for C.M.G. and H.K.A.M; Ruth L. Kirschstein National Research Service Award T32HL069766 for A.V., LLS Fellow Award and AACR post-doctoral award for F.L.; Beckman Scholars Program for A.T.N. and T.J.B; and NIH grant CA178415 to S.K.K.
Footnotes
Competing interests The authors declare no competing interests.
Additional information
Supplementary information is available for this paper at https://doi.org/10.1038/s41586-019-1790-2.
Peer review information Nature thanks Elisa Laurenti and the other, anonymous, reviewer(s) for their contribution to the peer review of this work.
Publisher′s note Springer Nature remains neutral with regard to jurisdictional claims in published maps and institutional affiliations.
References
- 1.Ballen KK, Gluckman E & Broxmeyer HE Umbilical cord blood transplantation: the first 25 years and beyond. Blood 122, 491–498 (2013). [DOI] [PMC free article] [PubMed] [Google Scholar]
- 2.Gritz E & Hirschi KK Specification and function of hemogenic endothelium during embryogenesis. Cell. Mol. Life Sci 73, 1547–1567 (2016). [DOI] [PMC free article] [PubMed] [Google Scholar]
- 3.Prashad SL et al. GPI-80 defines self-renewal ability in hematopoietic stem cells during human development. Cell Stem Cell 16, 80–87 (2014). [DOI] [PMC free article] [PubMed] [Google Scholar]
- 4.Magnusson M et al. Expansion on stromal cells preserves the undifferentiated state of human hematopoietic stem cells despite compromised reconstitution ability. PLoS ONE 8, e53912 (2013). [DOI] [PMC free article] [PubMed] [Google Scholar]
- 5.Dou DR et al. Medial HOXA genes demarcate haematopoietic stem cell fate during human development. Nat. Cell Biol 18, 595–606 (2016). [DOI] [PMC free article] [PubMed] [Google Scholar]
- 6.He N et al. Human polymerase-associated factor complex (PAFc) connects the super elongation complex (SEC) to RNA polymerase II on chromatin. Proc. Natl Acad. Sci. USA 108, E636–E645 (2011). [DOI] [PMC free article] [PubMed] [Google Scholar]
- 7.Steger DJ et al. DOT1L/KMT4 recruitment and H3K79 methylation are ubiquitously coupled with gene transcription in mammalian cells. Mol Cell Biol 28, 2825–2839 (2008). [DOI] [PMC free article] [PubMed] [Google Scholar]
- 8.Li Y et al. AF9 YEATS domain links histone acetylation to DOT1L-mediated H3K79 methylation. Cell 159, 558–571 (2014). [DOI] [PMC free article] [PubMed] [Google Scholar]
- 9.Bitoun E, Oliver PL & Davies KE The mixed-lineage leukemia fusion partner AF4 stimulates RNA polymerase II transcriptional elongation and mediates coordinated chromatin remodeling. Hum. Mol. Genet 16, 92–106 (2007). [DOI] [PubMed] [Google Scholar]
- 10.Li Y et al. Molecular coupling of histone crotonylation and active transcription by AF9 YEATS domain. Mol. Cell 62, 181–193 (2016). [DOI] [PMC free article] [PubMed] [Google Scholar]
- 11.Schoch C et al. AML with 11q23/MLL abnormalities as defined by the WHO classification: incidence, partner chromosomes, FAB subtype, age distribution, and prognostic impact in an unselected series of 1897 cytogenetically analyzed AML cases. Blood 102, 2395–2402 (2003). [DOI] [PubMed] [Google Scholar]
- 12.Krivtsov AV et al. Transformation from committed progenitor to leukaemia stem cell initiated by MLL-AF9. Nature 442, 818–822 (2006). [DOI] [PubMed] [Google Scholar]
- 13.Bernt KM et al. MLL-rearranged leukemia is dependent on aberrant H3K79 methylation by DOT1L. Cancer Cell 20, 66–78 (2011). [DOI] [PMC free article] [PubMed] [Google Scholar]
- 14.Wang X, Chen CW & Armstrong SA The role of DOT1L in the maintenance of leukemia gene expression. Curr. Opin. Genet. Dev 36, 68–72 (2016). [DOI] [PubMed] [Google Scholar]
- 15.Pina C, May G, Soneji S, Hong D & Enver T MLLT3 regulates early human erythroid and megakaryocytic cell fate. Cell Stem Cell 2, 264–273 (2008). [DOI] [PubMed] [Google Scholar]
- 16.McKinney-Freeman S et al. The transcriptional landscape of hematopoietic stem cell ontogeny. Cell Stem Cell 11, 701–714 (2012). [DOI] [PMC free article] [PubMed] [Google Scholar]
- 17.Ng ES et al. Differentiation of human embryonic stem cells to HOXA+ hemogenic vasculature that resembles the aorta-gonad-mesonephros. Nat. Biotechnol 34, 1168–1179 (2016). [DOI] [PubMed] [Google Scholar]
- 18.Boitano AE et al. Aryl hydrocarbon receptor antagonists promote the expansion of human hematopoietic stem cells. Science 329, 1345–1348 (2010). [DOI] [PMC free article] [PubMed] [Google Scholar]
- 19.Fares I et al. Pyrimidoindole derivatives are agonists of human hematopoietic stem cell self-renewal. Science 345, 1509–1512 (2014). [DOI] [PMC free article] [PubMed] [Google Scholar]
- 20.Daigle SR et al. Potent inhibition of DOT1L as treatment of MLL-fusion leukemia. Blood 122, 1017–1025 (2013). [DOI] [PMC free article] [PubMed] [Google Scholar]
- 21.Horton SJ et al. MLL-AF9-mediated immortalization of human hematopoietic cells along different lineages changes during ontogeny. Leukemia 27, 1116–1126 (2013). [DOI] [PubMed] [Google Scholar]
- 22.Sontakke P et al. Modeling BCR-ABL and MLL-AF9 leukemia in a human bone marrow-like scaffold-based xenograft model. Leukemia 30, 2064–2073 (2016). [DOI] [PubMed] [Google Scholar]
- 23.Wagner JE Jr et al. Phase I/II trial of stemregenin-1 expanded umbilical cord blood hematopoietic stem cells supports testing as a stand-alone graft. Cell Stem Cell 18, 144–155 (2016). [DOI] [PMC free article] [PubMed] [Google Scholar]
- 24.Ngom M et al. UM171 enhances lentiviral gene transfer and recovery of primitive human hematopoietic cells. Mol. Ther. Methods Clin. Dev 10, 156–164 (2018). [DOI] [PMC free article] [PubMed] [Google Scholar]
- 25.Wilkinson AC et al. Long-term ex vivo haematopoietic-stem-cell expansion allows nonconditioned transplantation. Nature 571, 117–121 (2019). [DOI] [PMC free article] [PubMed] [Google Scholar]
- 26.Kataoka K et al. Evi1 is essential for hematopoietic stem cell self-renewal, and its expression marks hematopoietic cells with long-term multilineage repopulating activity. J. Exp. Med 208, 2403–2416 (2011). [DOI] [PMC free article] [PubMed] [Google Scholar]
- 27.Rentas S et al. Musashi-2 attenuates AHR signalling to expand human haematopoietic stem cells. Nature 532, 508–511 (2016). [DOI] [PMC free article] [PubMed] [Google Scholar]
- 28.Komorowska K et al. Hepatic leukemia factor maintains quiescence of hematopoietic stem cells and protects the stem cell pool during regeneration. Cell Reports 21, 3514–3523 (2017). [DOI] [PubMed] [Google Scholar]
- 29.Hu Y & Smyth GK ELDA: extreme limiting dilution analysis for comparing depleted and enriched populations in stem cell and other assays. J. Immunol. Methods 347, 70–78 (2009). [DOI] [PubMed] [Google Scholar]
- 30.Org T et al. Sol binds to primed enhancers in mesoderm to regulate hematopoietic and cardiac fate divergence. EMBO J. 34, 759–777 (2015). [DOI] [PMC free article] [PubMed] [Google Scholar]
- 31.Heinz S et al. Simple combinations of lineage-determining transcription factors prime cis-regulatory elements required for macrophage and B cell identities. Mol. Cell 38, 576–589 (2010). [DOI] [PMC free article] [PubMed] [Google Scholar]
- 32.Ramirez F, Dundar F, Diehl S, Gruning BA & Manke T deepTools: a flexible platform for exploring deep-sequencing data. Nucleic Acids Res. 42, W187–91 (2014). [DOI] [PMC free article] [PubMed] [Google Scholar]
- 33.Zhang Y et al. Model-based analysis of ChIP-Seq (MACS). Genome Biol. 9, R137 (2008). [DOI] [PMC free article] [PubMed] [Google Scholar]
- 34.Buenrostro JD, Giresi PG, Zaba LC, Chang HY & Greenleaf WJ Transposition of native chromatin for fast and sensitive epigenomic profiling of open chromatin, DNA- binding proteins and nucleosome position. Nat. Methods 10, 1213–1218 (2013). [DOI] [PMC free article] [PubMed] [Google Scholar]
- 35.Langmead B & Salzberg SL Fast gapped-read alignment with Bowtie 2. Nat. Methods 9, 357–359 (2012). [DOI] [PMC free article] [PubMed] [Google Scholar]
- 36.Trapnell C, Pachter L & Salzberg SL TopHat: discovering splice junctions with RNA- seq. Bioinformatics 25, 1105–1111 (2009). [DOI] [PMC free article] [PubMed] [Google Scholar]
- 37.Quinlan AR & Hall IM BEDTools: a flexible suite of utilities for comparing genomic features. Bioinformatics 26, 841–842 (2010). [DOI] [PMC free article] [PubMed] [Google Scholar]
- 38.Dennis G Jr et al. DAVID: Database for Annotation, Visualization, and Integrated Discovery. Genome Biol. 4, 3 (2003). [PubMed] [Google Scholar]
Associated Data
This section collects any data citations, data availability statements, or supplementary materials included in this article.
Supplementary Materials
Data Availability Statement
Sequence data that support the findings of this study have been deposited in Gene Expression Omnibus (GEO) with the accession code GSE111484. Data from published reference are available in GEO GSE8108017. All other data are either available within the paper or from the corresponding author upon reasonable request. Custom codes for data analysis are also available upon request. There is no restriction in data availability.


