

Abstract
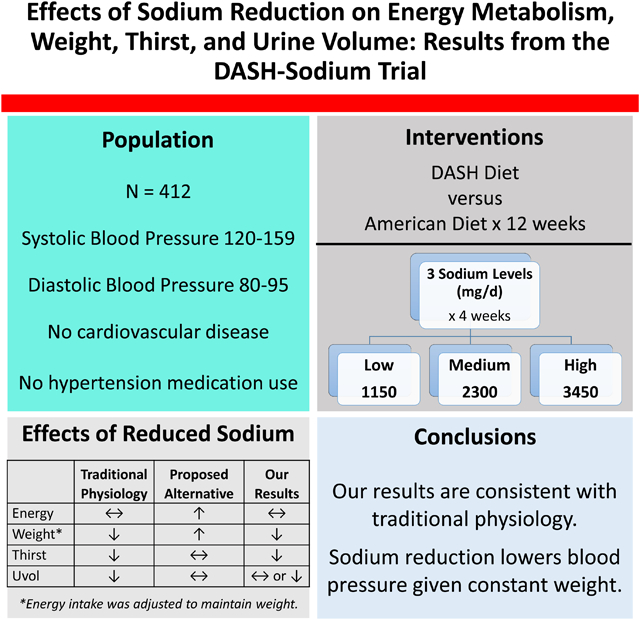
Two recent studies challenged traditional paradigms of mammalian sodium physiology, suggesting that sodium reduction might cause weight gain by altering metabolism. This new theory has important implications for population-wide dietary recommendations. However, these observations have not been confirmed. In the DASH-Sodium trial, 412 adults with systolic blood pressure (BP) of 120–159 mmHg and diastolic BP of 80–95 mmHg not taking antihypertensive medications, were randomly assigned to the DASH diet or a control diet (parallel design). On their assigned diet, participants randomly consumed each of three sodium levels for 4 weeks (crossover design). Participants were provided all meals, but could drink non-caloric beverages (e.g. water) freely. Throughout the trial, energy intake was adjusted to maintain weight constant. The three sodium levels (at 2100 kcal/day) were: low (1150 mg of Na/day), medium (2300 mg of Na/day), and high (3450 mg of Na/day). Energy intake, weight, self-reported thirst, and 24-hr urine volume were assessed after each period. Participants were 57% women and 57% black; mean age was 48yrs [SD,10]). Among those assigned the control, mean weight increased slightly with higher sodium, but not among those assigned DASH. Energy intake did not vary across sodium levels in either diet (P-trends≥0.36). Higher sodium resulted in more thirst (P-trends<0.001 on both diets) and higher urine volume (suggesting higher fluid intake) during the control diet (P-trend=0.007). Reducing sodium did not increase energy requirements to maintain stable weights, but did decrease thirst and urine volume (control diet only), findings consistent with the traditional understanding of mammalian sodium physiology.
Keywords: sodium, thirst, metabolism, weight, urine volume, blood pressure, trial
Graphical Abstract
Summary
Our results support the traditional understanding of sodium physiology. Public health recommendations aimed at lowering population-wide sodium intake for blood pressure should continue without concern for weight gain.
High blood pressure (BP) affects over 150 million adults in the US.1 Sodium reduction is widely considered to be an important, public health strategy for reducing BP based on the BP-lowering effects of sodium reduction observed in multiple clinical trials.2,3 It has been traditionally thought that higher sodium intake initially increases serum sodium concentrations, stimulating thirst, which leads to greater fluid consumption and increased intravascular volume.4 However, this traditional perspective has recently been challenged by studies suggesting that higher sodium intake does not stimulate thirst and fluid consumption, but rather promotes catabolism and potentially weight loss.5,6 These findings have not been replicated.
The Dietary Approaches to Stop Hypertension (DASH)-Sodium trial was a controlled-feeding study that examined the effects on blood pressure of 3 levels of sodium intake (low, medium, or high) in 2 distinct diets - a typical American diet (control diet) or a healthy diet (DASH Diet).2 In order to maintain constant weight, energy intake was adjusted. Hence, if reduced sodium intake leads to weight gain, as postulated by recent studies, energy intake would be expected to increase in order to maintain stable weight. The effects of the diets on self-reported thirst were recorded along with blood concentrations of renin and aldosterone, 24-hour urine volume, and urine electrolytes. Ultimately, the trial demonstrated that low (versus high) sodium intake significantly decreased blood pressure.2 However, the impact of sodium on metabolism, thirst, urine electrolyte regulation, hormonal regulation of electrolyte balance, and electrolyte excretion have not been reported.2
In this secondary analysis of the DASH-Sodium trial, we examined the impact of sodium intake on: (1) energy intake and weight (surrogates of metabolism) and (2) thirst and urine volume (a surrogate of volume intake). We also examined mechanisms related to sodium handling by examining the effects of sodium intake on: (3) plasma renin and serum aldosterone concentrations and (4) urine osmolarity. We hypothesized that if reduced sodium intake contributed to weight gain, then energy intake in DASH-Sodium would be expected to decrease in order to maintain stable weight.
Methods
The data that support the findings of this study are available from the National Heart, Lung, and Blood Institute BioLINCC repository.
The DASH-Sodium trial was an investigator-initiated study conducted between September 1997 through November 1999 at four clinical centers within the United States (Baltimore, Maryland; Boston, Massachusetts; Durham, North Carolina; Baton Rouge, Louisiana). The study was sponsored by the National Heart, Lung, and Blood Institute. A detailed description of the study and its primary results have been published.2 In brief, DASH-Sodium compared the effects of consuming three different levels of sodium in the setting of the DASH diet or a typical American diet (control), designed to reflect the 25th percentile of several micronutrients and the average macronutrient profile of the US population. Institutional Review Boards at each institution approved the original study protocol along with subsequent analyses. Written, informed consent was provided by all participants. The current study is a post-hoc analysis of the original DASH-Sodium trial.
Participants
DASH-Sodium participants were adults, aged 22 years and older with mean SBP of 120–159 mm Hg and DBP of 80–95 mm Hg. Adults with a prior diagnosis of heart disease, renal insufficiency, poorly controlled dyslipidemia, diabetes mellitus, or heart failure were excluded.2 The study also excluded individuals taking antihypertensive agents or insulin, and persons drinking more than 14 alcoholic drinks a week.
Dietary Interventions
The DASH-Sodium trial simultaneously tested dietary patterns and levels of sodium intake. Following a parallel design, participants were randomized to one of two diets: the DASH diet or a control diet. Following a crossover design, participants were also randomized to different orders of three sodium levels (low, medium, or high), in their assigned dietary pattern.
The DASH diet emphasized fruits, vegetables, and low-fat dairy products and was reduced in saturated fat, total fat, and cholesterol.7 The DASH diet included whole grains, poultry, fish, and nuts, and was reduced in red meat, sweets, and sugar-containing beverages. The control diet was designed to reflect a diet that is typical of what many Americans eat.7
Each participant ate their assigned diet at 3 different sodium levels: high (1.6 mg/kcal), medium (1.1 mg/kcal), and low (0.5 mg/kcal). The 3 levels of sodium intake differed by level of energy intakes. Initial Calorie levels were assigned based on estimated Calorie needs and could be adjusted in order maintain weight constant. The five energy levels of the provided meals were: 1,600, 2,100, 2,600, 3,100, and 3,600 kcal/day. For example, at a 2,100 kcal/day energy level, a participant was provided the following sodium levels (high, medium, and low): 3,450 mg (150 mmol), 2,300 mg (100 mmol), and 1,150 mg (50 mmol), while participants requiring 2,600 kcal of energy, were provided 4,140 mg (180 mmol), 2,760 mg (120 mmol), and 1,380 mg (60 mmol) of sodium. The high level was consistent with average sodium intake in the US. The medium level was based on sodium recommendations at the time the study was designed. The low sodium intake, below current recommendations, was hypothesized to lower BP further. The contrast in sodium levels was achieved by using unsalted or salted varieties of foods or by adding salt to entrees, ensuring similar nutrient profiles across sodium levels. A detailed description of the dietary interventions is in Supplement Table S1.8
Feeding was tightly controlled. All meals and snacks were provided to participants. The participants’ main meal (lunch or dinner) was consumed at the study centers under observation with monitoring for waste or protocol deviations. The remaining study meals were consumed off-site. Participants were weighed daily and, if needed, energy intake adjusted approximately weekly to ensure that weight remained constant.
Prior to randomization, all participants underwent a two-week run-in period, during which they ate the high sodium-control diet. They were then randomized to diet and sodium sequence. Each sodium level was consumed for an average of 30 days, separated by an average 5-day washout period during which participants ate their usual diets. Over 98% of participants completed each intervention period.2
Primary and secondary outcome measures
The outcomes of the main DASH-Sodium trial are published elsewhere.8 The primary outcome measures of our post-hoc study were mean energy, weight, thirst, and urine volume. Secondary outcomes were plasma renin concentrations, serum aldosterone concentrations, and urine osmolarity.
Mean energy intake was determined across all days of the feeding period. On each daily value, we calculated kcal of energy from 3 sources: 1) kcal from provided meals (1,600, 2,100, 2,600, 3,100, or 3,600 kcal); 2) kcal from ‘unit’ foods, which were each 100 kcal (used to achieve kcal levels between the 5 energy levels of provided meals); and 3) the kcal from alcohol beverages, if any. On each day of feeding and for each participant, we calculated total kcal from the following equation: the energy level of the meals provided + (# of unit foods consumed*100kcal) + (# 10*total ounces of beer + 25*total ounces of wine + 75*total ounces of spirits). Weight at 4-weeks was assessed using a calibrated scale.
Thirst was reported via a symptom questionnaire administered during the last 7 days of the run-in period as well as after each of the three sodium intake periods. Participants were asked whether they felt “excessive thirst,” and could select: none (no experience of this symptom), mild (symptom occurred but did not interfere with usual activities), moderate (occurrence of symptom somewhat interfered with usual activities), or severe (occurrence of symptom resulted in an inability to perform usual activities). This variable was dichotomized to be none or any (mild, moderate, or severe) excessive thirst. Baseline change in severity was the difference between severity scores (values 1 through 4) at the end of each feeding period minus scores at the end of run-in (baseline).
At baseline (before run-in and randomization) and during the last week of each intervention period, 24-hour urine collections were obtained. These collections were used to measure urine volume (an indirect measure of fluid intake)9 and urine excretion of sodium, potassium, and creatinine. Urine osmolality was estimated with the following formula: 1.07×{2×[(urine sodium (mEq/L)]+[urine urea nitrogen (mg/dl)]/2.8+[urine creatinine (mg/dl)]×2/3}+16.10 Given right-tailed skew in the distribution of total urine volume, these values were log-transformed for trend and regression analyses.
Plasma renin activity and serum aldosterone were measured in frozen specimens originally collected in a seated position using standard assays. The lower limit of detection for plasma renin activity was 0.01. Undetectable renin values were imputed using the halfway value of 0.005. This affected 4 values. Both plasma renin activity and serum aldosterone were log-transformed to address non-normal residuals.
Covariates
Other population characteristics were determined via questionnaire, laboratory specimens, and physical examination. Body mass index (BMI) was derived from measured height and weight. Systolic and diastolic BP were measured at the same time with random-zero sphygmomanometers, while participants were seated. BP was measured at three visits during the screening phase and at two visits during the 2-week run-in period. The average of these 5 measurements served as a baseline for this study. Hypertension, as defined in this trial, was a SBP ≥ 140 mm Hg or DBP ≥ 90 mm Hg. Note that BP was the primary outcome of the original trial, reported previously,2 and replicated in this study.
Statistical analysis
We used means (SD) and proportions to describe baseline population characteristics by diet assignment. Means were calculated for each sodium intake level as well as the proportion of participants reporting any thirst. We also examined the proportion of each thirst response (did not occur, mild, moderate, severe) across the three sodium intake levels.
Trends across sodium categories were determined via generalized estimating equation (GEE) regression models with a Huber and White robust variance estimator11, which conservatively assumed an exchangeable working correlation matrix, by treating sodium intake as a continuous variable (low 0, medium 1, and high 2). For continuous variables (energy, weight, urine volume, SBP, DBP, aldosterone, renin, urine osmolality, urine sodium, urine potassium, and urine urea nitrogen) we used a normal family, identity link, while for any thirst we used a binomial family, logit link. We also compared low versus medium, medium versus high, and low versus high sodium intake via GEE models above. We further plotted trends in energy, weight, thirst, and urine volume in a subpopulation restricted to participants with all 4 of these measurements at all 3 sodium intake levels. We also assessed for delay in sodium effects on metabolism by restricting analyses to the last week and last 2 weeks of each sodium period.
Finally, we determined the effect of the DASH diet versus control on baseline change (end of period minus baseline) in energy, weight, thirst, and urine volume at each sodium intake level (using linear regression given the trial’s parallel design) and overall (using GEE given the three repeat measurements for each participant). For this analysis we did not dichotomize thirst, since residuals of the change from baseline were normally distributed.
All analyses were conducted with Stata version 15.0 (Stata Corporation, College Station, TX, USA). Missing data were minimal and evenly distributed throughout dietary interventions and time periods throughout the study.
Results
Baseline characteristics
Baseline characteristics of the 412 participants of the DASH-Sodium trial are shown in Table 1. Overall, there were no significant differences between participants assigned the DASH diet or control diet.
Table 1.
Baseline characteristics according to diet assignment
| DASH Diet | Control Diet | ||||
|---|---|---|---|---|---|
| Characteristic | Total N | Mean (SD) or N (%) | Total N | Mean (SD) or N (%) | |
| Age, yr | 208 | 47.4 (9.6) | 204 | 49.1 (10.4) | |
| Women, % | 208 | 123 (59.1) | 204 | 111 (54.4) | |
| Black, % | 208 | 119 (57.2) | 204 | 115 (56.4) | |
| Blood pressure, mm Hg | |||||
| Systolic | 208 | 134.2 (9.6) | 204 | 135.4 (9.4) | |
| Diastolic | 208 | 85.6 (4.8) | 204 | 85.8 (4.1) | |
| Body mass index, kg/m2 | 208 | 28.8 (4.7) | 204 | 29.5 (5.0) | |
| Body mass index ≥30, % | 208 | 78 (37.5) | 204 | 82 (40.2) | |
| Mean energy intake, kcal/day | 208 | 2618.9 (483.9) | 204 | 2605.9 (448.8) | |
| Any thirst, % | 208 | 64 (30.8) | 204 | 52 (25.5) | |
| Urine volume, mL/day | 204 | 1595.4 (807.4) | 204 | 1531.0 (690.8) | |
| Weight, kg | 208 | 82.8 (14.9) | 204 | 85.6 (16.1) | |
| Serum aldosterone, ng/dL | 208 | 9.5 (6.6) | 204 | 8.8 (6.1) | |
| Plasma renin activity, ng/ml/hr | 190 | 0.6 (0.6) | 188 | 0.6 (1.1) | |
| Urine Osmol, mOsm/L | 204 | 523.8 (212.4) | 204 | 529.3 (202.1) | |
| Urine Na, mg/day | 204 | 3622.7 (1813.9) | 204 | 3505.2 (1650.3) | |
| Urine K, mg/day | 204 | 2120.0 (934.9) | 204 | 2052.9 (885.7) | |
| Urine BUN, mg/day | 204 | 9750.0 (4323.3) | 204 | 9735.3 (3689.8) | |
Energy, weight, thirst, and urine volume
We examined mean energy intake and weight across sodium intake levels (Table 2). There was no difference in mean energy consumption by level of sodium intake among those assigned the DASH diet (P-trend = 0.68) or the control diet (P-trend = 0.36). On both diets, weight was minimally but significantly reduced at lower sodium intake among those assigned to the DASH diet (P-trend = 0.049) and among those assigned the control diet (P-trend = 0.001).
Table 2.
Effects of sodium intake on energy, weight, thirst, and urine volume
| Sodium Intake | ||||||||||||||
|---|---|---|---|---|---|---|---|---|---|---|---|---|---|---|
| Diet Assignment | Low | Medium | High | P-trend | N* | Low vs High Sodium (Mean Difference or Odds Ratio [OR], 95% CI) | P† | |||||||
| DASH Diet‡ | N | Mean | N | Mean | N | Mean | ||||||||
| Energy intake, kcal/day | 203 | 2639.5 | 200 | 2637.9 | 199 | 2629.6 | 0.68 | 207 | 6.13 (−23.00,35.26) | 0.68 | ||||
| Weight, kg | 196 | 82.2 | 197 | 82.1 | 199 | 82.3 | 0.049 | 201 | −0.17 (−0.34,−0.00) | 0.048 | ||||
| Any thirst, % | 208 | 18.8 | 208 | 26.0 | 208 | 35.6 | <0.001 | 208 | OR=0.42 (0.29, 0.61) | <0.001 | ||||
| Urine volume, mL/day§ | 199 | 1667.3 | 196 | 1661.9 | 200 | 1684.9 | 0.76 | 204 | −0.8 (−5.9, 4.5)† | 0.76 | ||||
| Control Diet‡ | ||||||||||||||
| Energy intake, kcal/day | 195 | 2644.5 | 196 | 2623.4 | 198 | 2620.9 | 0.36 | 204 | 14.09 (−16.27,44.44) | 0.36 | ||||
| Weight, kg | 192 | 85.0 | 195 | 85.1 | 193 | 85.3 | 0.001 | 200 | −0.26 (−0.41,−0.11) | 0.001 | ||||
| Any thirst, % | 204 | 21.6 | 204 | 21.1 | 204 | 34.8 | <0.001 | 204 | OR=0.52 (0.37, 0.72) | <0.001 | ||||
| Urine volume, mL/day§ | 193 | 1499.1 | 196 | 1532.8 | 195 | 1572.9 | 0.007 | 200 | −7.0 (−11.7,−1.9)† | 0.007 | ||||
N represents the number of people contributing to the model. Note that medium sodium contrast is displayed in Supplement Table ST2.
These P-values are nearly identical to the P-trend.
Note there was no evidence of a statistical interaction across the DASH and Control diet for these outcomes.
The residuals of urine volume were not normally distributed. We present mean urine volume without transformation, but difference was log-transformed and presented as percentage points.
We also examined thirst and 24-hour urine volume across sodium intake levels (Table 2). Regardless of diet assignment, self-reported thirst was lower with lower sodium intake (P-trends < 0.001). Details of thirst severity overall and stratified by control and DASH diets may be seen in Supplement Figures S1–3. A lower percentage of participants reported mild, moderate, and severe thirst symptoms at lower sodium intake levels. In contrast, there was no difference in 24-hour urine volume across levels of sodium intake among those assigned the DASH diet (P-trend = 0.76), but a significant downward trend with lower sodium among those assigned to the control diet (P-trend = 0.007). Trends were similar when restricted to a subpopulation (N=186 for control and 189 for DASH) that was not missing any energy, weight, thirst, or urine volume measurements at any sodium period (Figure 1 A–D).
Figure 1.
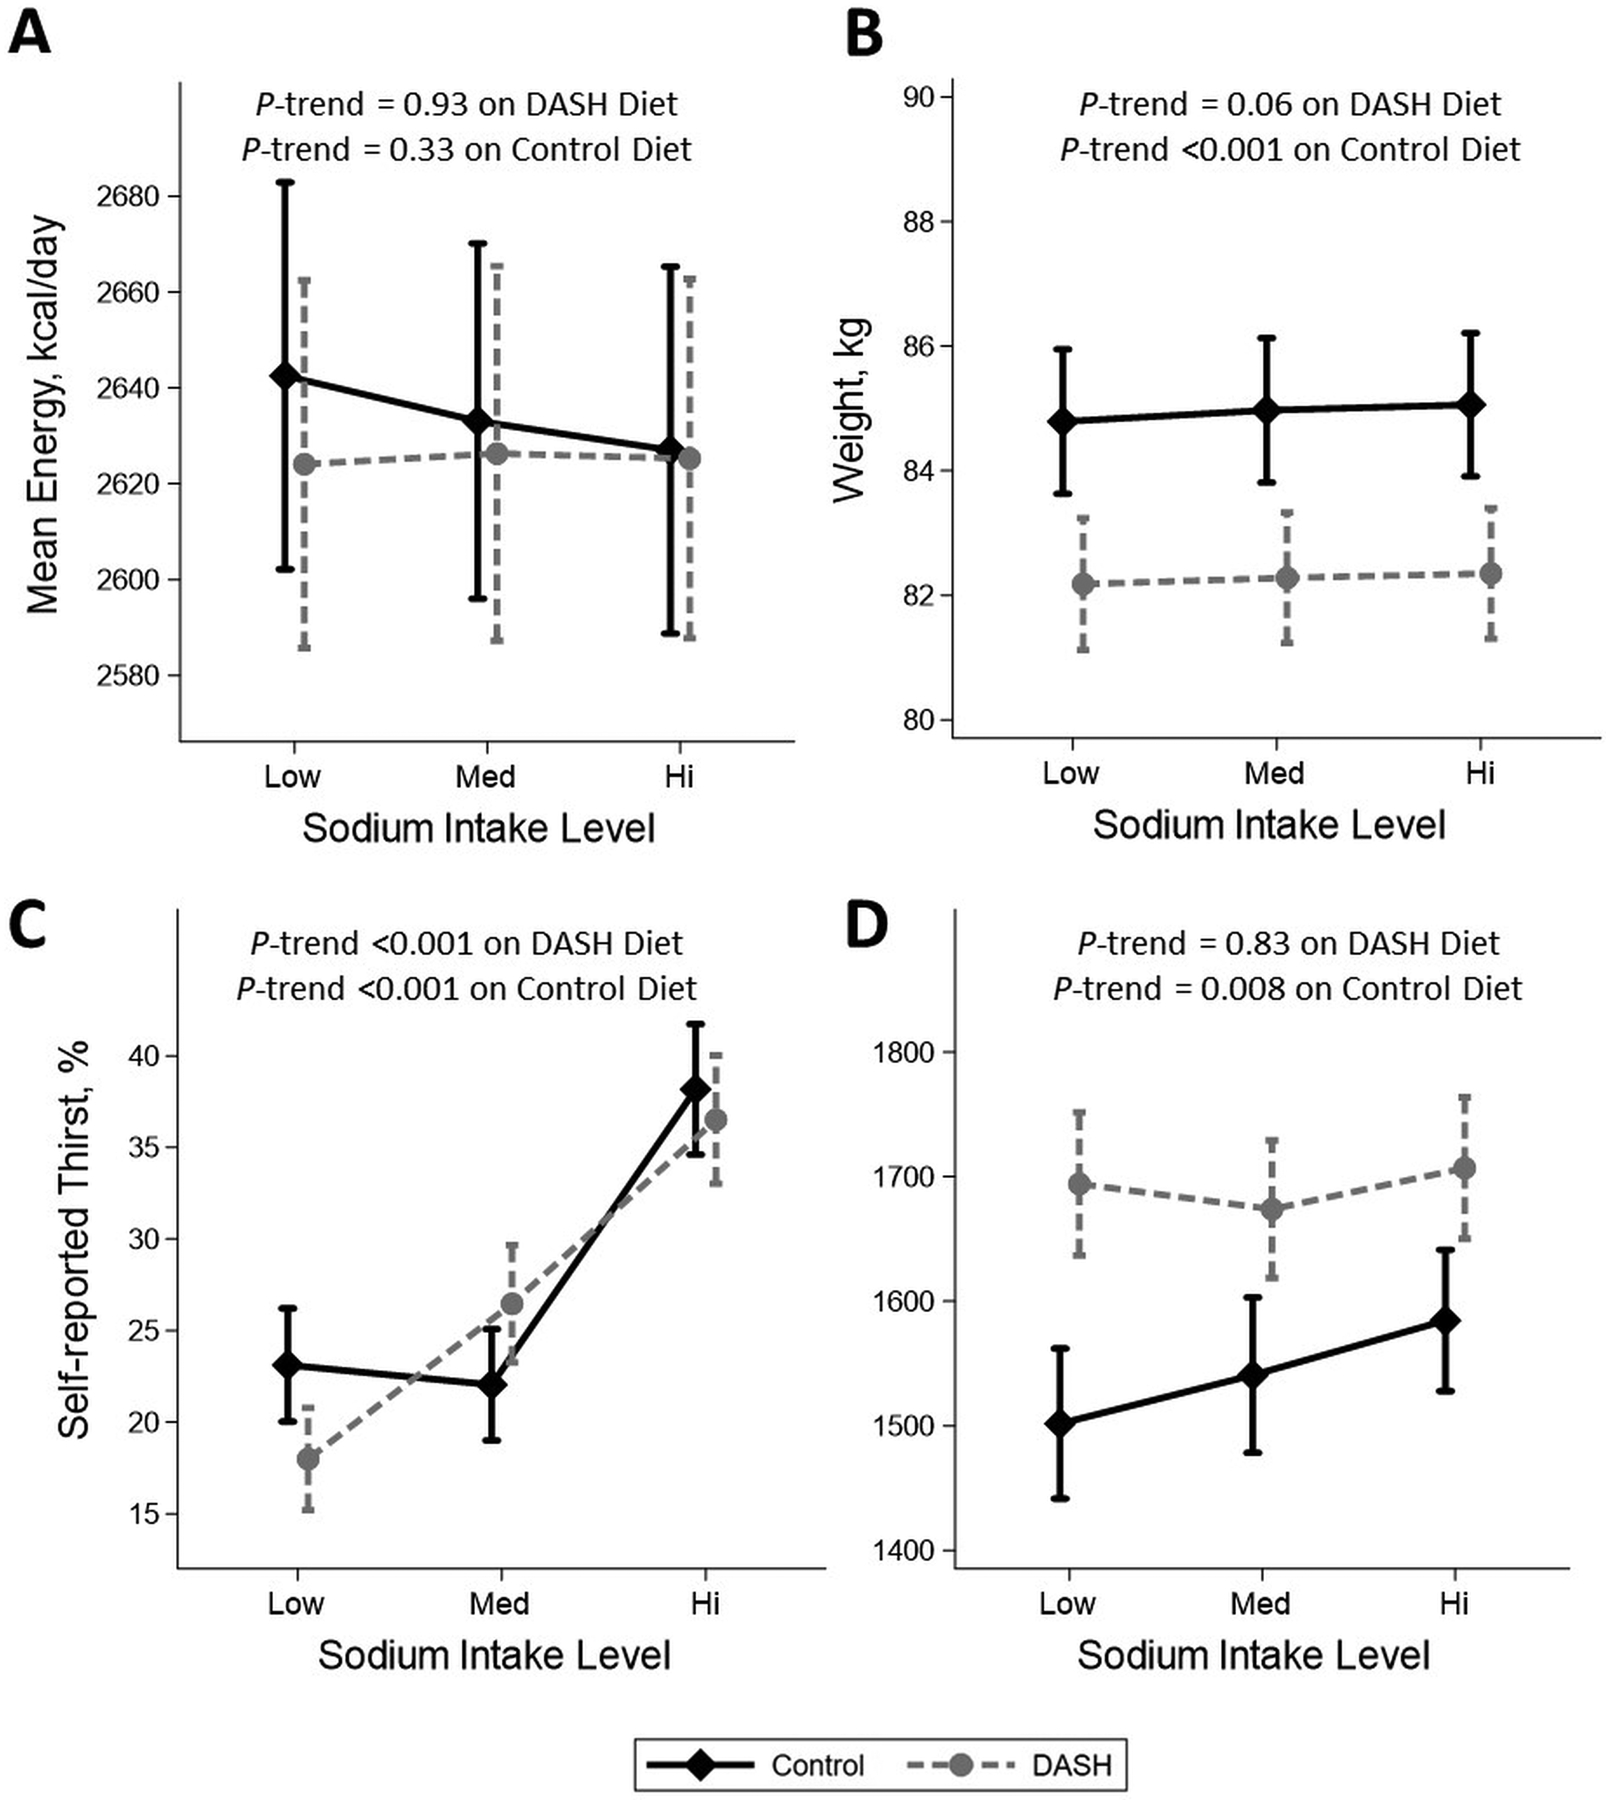
The effect of low, medium, or high sodium intake on (A) Mean energy intake (kcal/day), (B) Mean body weight (kg), (C) Self-reported thirst (%), and (D) Mean urine 24-hr volume (mL) for both DASH (diamond, solid line) and control (circle, dash line) diets. Markers represent means or %, while vertical bars represent standard errors. P-trends determined via generalized estimated equations (either normal or binomial distribution) where sodium assignment was considered a continuous variable (1 low, 2 medium, or 3 high). Urine volume was log-transformed to determine P-trend. Unlike Table 2, these figures and analyses were restricted to the subgroup with all measures at all sodium levels (N=186 for control and 189 for DASH). As a result, P-trends differ slightly from Table 2. Note that baseline weight for DASH was 82.8 kg versus 85.6 kg for control.
Comparisons of low versus medium and medium versus high sodium intake were consistent with low versus high comparisons for energy intake, weight, thirst, and urine volume, although effects were attenuated (Supplement Table S2).
We examined the effects of sodium reduction on energy intake from daily measurements restricted to the last week or 2 weeks of the low and high sodium intake periods. There was evidence of a potential increase in energy intake with sodium reduction in the context of the control diet (Supplement Table S3).
Blood pressure, aldosterone, renin, and urine solute excretion
As previously reported, a lower sodium intake decreased both SBP and DBP regardless of diet (all P-trends < 0.001; Table 3). Both serum aldosterone and plasma renin activity increased with lower sodium intake (all P-trends < 0.001). Twenty-four hour urine osmolality and urine sodium levels were lower with lower sodium on both diets (all P-trends < 0.001). In contrast, urine potassium trended upward, significantly among those assigned the DASH diet (P-trend = 0.002) and non-significantly among those assigned the control diet (P-trend = 0.16). There was no significant trend in urine urea nitrogen excretion across sodium intake levels on the DASH diet (P-trend = 0.37) and a borderline trend of reduced urea nitrogen with higher sodium intake levels on the control diet (P-trend = 0.06).
Table 3.
Effects of sodium intake on blood pressure, sodium hormones, and urine solute excretion
| Sodium Intake | ||||||||||||||
|---|---|---|---|---|---|---|---|---|---|---|---|---|---|---|
| Diet Assignment | Low | Medium | High | P-trend | N* | Low vs High Sodium (Mean Difference, 95% CI) | P | |||||||
| DASH Diet | N | Mean | N | Mean | N | Mean | ||||||||
| Blood Pressure | ||||||||||||||
| SBP, mm Hg | 208 | 123.9 | 208 | 125.7 | 208 | 127.0 | <0.001 | 208 | −3.1 (−4.1, −2.2) | <0.001 | ||||
| DBP, mm Hg | 208 | 79.5 | 208 | 80.5 | 208 | 80.9 | <0.001 | 208 | −1.5 (−2.1, −0.8) | <0.001 | ||||
| Hormonal regulation | ||||||||||||||
| Serum aldosterone, ng/Dl† | 188 | 16.8 | 184 | 13.2 | 191 | 11.1 | <0.001 | 204 | 52.4 (41.3, 64.4)† | <0.001 | ||||
| Plasma renin activity, ng/ml/hr† | 183 | 1.2 | 192 | 0.9 | 193 | 0.7 | <0.001 | 204 | 75.4 (53.3, 100.8)† | <0.001 | ||||
| Urine solute excretion | ||||||||||||||
| Osmolality, mOsm/L | 198 | 425.7 | 196 | 489.4 | 200 | 514.1 | <0.001 | 204 | −91.1 (−112.6, −69.6) | <0.001 | ||||
| Sodium, mg/day | 198 | 1530.8 | 196 | 2468.9 | 200 | 3302.0 | <0.001 | 204 | −1775.2 (−1981.3, −1569.2) | <0.001 | ||||
| Potassium, mg/day | 198 | 3169.4 | 196 | 3165.4 | 200 | 2941.4 | 0.001 | 204 | 217.2 (87.0, 347.4) | 0.001 | ||||
| Urea nitrogen, mg/day | 198 | 11752.5 | 196 | 12367.3 | 200 | 11515.0 | 0.37 | 204 | 202.2 (−245.8, 650.2) | 0.38 | ||||
| Control Diet | ||||||||||||||
| Blood Pressure | ||||||||||||||
| SBP, mm Hg | 204 | 126.4 | 204 | 130.2 | 204 | 132.8 | <0.001 | 204 | −6.4 (−7.5, −5.2) | <0.001 | ||||
| DBP, mm Hg | 204 | 80.2 | 204 | 82.2 | 204 | 83.4 | <0.001 | 204 | −3.2 (−3.9, −2.5) | <0.001 | ||||
| Hormonal regulation | ||||||||||||||
| Serum aldosterone, ng/Dl† | 182 | 12.4 | 185 | 8.9 | 182 | 7.5 | <0.001 | 200 | 69.2 (55.4, 84.3)† | <0.001 | ||||
| Plasma renin activity, ng/ml/hr† | 177 | 1.0 | 183 | 0.6 | 172 | 0.5 | <0.001 | 198 | 131.0 (96.5, 171.5)† | <0.001 | ||||
| Urine solute excretion | ||||||||||||||
| Osmolality, mOsm/L | 193 | 441.4 | 196 | 489.1 | 195 | 515.4 | <0.001 | 200 | −68.9 (−92.4, −45.5) | <0.001 | ||||
| Sodium, mg/day | 193 | 1477.4 | 196 | 2433.8 | 195 | 3250.1 | <0.001 | 200 | −1773.3 (−1966.0, −1580.5) | <0.001 | ||||
| Potassium, mg/day | 193 | 1621.4 | 196 | 1600.0 | 195 | 1558.4 | 0.19 | 200 | 63.0 (−30.4, 156.4) | 0.19 | ||||
| Urea nitrogen, mg/day | 193 | 10025.9 | 196 | 9709.2 | 195 | 9584.6 | 0.06 | 200 | 457.3 (−23.6, 938.1) | 0.06 | ||||
Abbreviations: SBP, systolic blood pressure; DBP represents diastolic blood pressure
N represents the number of people contributing to the model. Note that medium sodium contrast is not displayed. See Supplement Table ST2.
The residuals of serum aldosterone and plasma renin activity were not normally distributed. We present means without transformation, but difference was log-transformed and presented as percentage points.
DASH versus Control
We examined the effects of DASH versus control on energy, weight, thirst, and urine volume (Supplement Table S4). Ultimately after accounting for baseline differences, DASH had little effect on energy consumption, thirst, or urine volume. After accounting for differences in weight at baseline, mean weight was slightly lower on the DASH diet compared to control, but the magnitude of the reduction was minimal at only 0.4 kg, when comparing all sodium levels (P-values < 0.05).
Discussion
In this post-hoc analysis of the DASH-Sodium trial, we found that reduced sodium intake did not affect the provision of energy required to keep weight constant, but rather decreased thirst. Furthermore, urine volume, a marker of fluid intake, was either unchanged or lower with lower sodium intake. Sodium reduction also increased plasma aldosterone and renin concentrations and decreased urine osmolality. Together these results suggest that in free living humans with elevated BP or hypertension, a lower sodium intake decreases thirst, urine volume (and likely fluid intake), and blood pressure with compensatory hormonal effects, i.e. increased plasma renin activity and aldosterone. These changes occurred without altering the amount of energy required to maintain stable weight.
Sodium is a highly regulated micronutrient. Traditionally, sodium regulation in humans has been viewed as a reactive process with higher sodium intake resulting in greater thirst and fluid intake.4 These changes in behavior subsequently contribute to higher body weight and blood pressure from increased intravascular and extracellular fluid volume. Meanwhile, the macula densa senses higher sodium in the early distal tubule and down regulates renin release, angiotensin II formation, and aldosterone secretion,12 causing greater excretion of sodium in urine, which increases urine sodium and osmolality.13,14 This understanding has supported recommendations to reduce sodium intake for lowering blood pressure.
Recently, two studies have challenged the traditional understanding of renal physiology. One study was conducted in 10 cosmonauts with carefully quantified sodium intake, fluid intake, and urine collections.6 This study demonstrated that long-term, higher sodium intake did not increase fluid intake and that volume homeostasis was related to increased energy expenditure. Another study, involving mice, demonstrated that high sodium intake caused energy-intense, catabolic urea production to promote free water retention.5 This increase in energy utilization required compensatory increases in food intake. Together these studies suggested that high sodium intake does not alter volume homeostasis, but may increase catabolism and by extrapolation contribute to weight loss in the setting of stable food intake. Our study in a larger, feeding trial does not support these findings. In the setting of varied sodium levels, there was no difference in energy intake, virtually no change in weight (slight increase, rather than decrease, in weight with higher sodium levels), and no significant change in urine urea excretion.
Several key differences between the present study and the Cosmonaut study6 should be noted that may account for the distinct observations between these studies. First, in the Cosmonaut study, the lowest sodium level was 6 g of salt per day (approximately 2,400 mg of sodium, similar to the medium sodium level), while the highest sodium level was 12 g of salt per day (approximately 4,800 mg of sodium), which is higher than what most individuals received in the high sodium level in our study. Second, the two studies differed in duration with the sodium exposure in our study lasting 4-weeks versus 15–30 weeks in the Cosmonaut study. The longer-term design of the Cosmonaut study maybe better suited for assessing cause and effect relationships. Third, the Cosmonaut study was much smaller than the present study, which may account for differences in findings. The impacts of these design features should be examined in subsequent research.
In an independent study, 14 mice were fed either a low sodium (0.1% NaCl chow and tap water, N=6) or a high-salt diet (4% NaCl chow and 0.9% saline water, N=8) over a 2-week period. Despite a 10-fold increase in urine sodium excretion, there was no increase in total osmolyte excretion and no difference in urine volume. This suggested that water excretion was not proportional to excess sodium excretion. Further, in a separate experiment after 6-weeks, it was found that medullary urea content was substantially increased in the renal medulla of high sodium-fed mice. This was believed to represent a catabolic-driven mechanism to conserve excess fluid loss from sodium excretion. We did not observe similar findings in DASH-Sodium as there was no clear difference in urea excretion across sodium levels and osmolality was significantly greater (predominantly due to increased sodium excretion) among the high sodium group.
Our study has limitations. First, calorimetry was not performed as part of this study. Instead, we relied on measured body weight and calculated caloric intake during a closely monitored feeding trial. Notably, despite the study design goal of maintaining weight at a constant level, there was a small statistically significant decrease in weight with reduced sodium in both the control and DASH diets, findings consistent with traditional understanding of sodium physiology. Second, fluid intake was not measured and participants were not queried about fluid intake or water consumption. As a result, we relied on urine volume, an indirect measure of fluid intake, which could be influenced by metabolic water production, as well as the fluid content of the meals. Third, energy estimates did not include items listed on food dietaries as quantities could not be verified. While off-site consumption was minimal, it is possible some sources of energy were missed. Finally, the sodium intervention periods lasted only 4 weeks. While we would expect the changes observed at 4 weeks to extend beyond the study, we cannot confirm this hypothesis.
Our study also has several strengths. The sodium intervention was tightly controlled, administered in randomized cross-over fashion, which enhances statistical power and which allows for within-person estimates of change in outcome variables. This minimizes confounding and strengthens our ability to determine the direct effects of sodium intake on human physiology. Second, the isocaloric design minimized the possibility of weight change and its effects on trial outcomes. Third, the study population was large and diverse with a broad range of outcomes and extremely high rates of follow-up.
The debate surrounding the effects of sodium on human physiology has public health implications. Hypertension affects over 1.3 billion people worldwide15 with the highest incidence of CVD among countries consuming the most sodium.16 Sodium reduction lowers BP in the short-term.17 Further, many high sodium foods are also high in energy,18 thereby with the potential for weight gain in addition to high blood pressure. While the long-term effect of sodium continues to be an important research focus, our data do not support the notion that sodium intake within the range of 1,150 mg to 3,450 mg/d (for a 2,100 kcal/d diet, the upper range being more typical of an American diet) has a substantial effect on energy metabolism. Rather, our study continues to support evidence for population-wide interventions targeting sodium reduction as a means to lower blood pressure with no expected increases in weight.
Perspectives
In conclusion, lower sodium intake not only lowered blood pressure, but decreased thirst and urine volume (control diet only) without significant changes in the provision of energy needed to keep weight constant. Together these findings support the traditional understanding of sodium handling in human physiology and underscore the importance of sodium reduction as a means to lower blood pressure.
Supplementary Material
Novelty and Significance.
What is New?
Recent studies challenged traditional paradigms of sodium physiology, suggesting that sodium reduction might cause weight gain by altering metabolism. We report the effects of sodium reduction on energy intake, weight, thirst, and urine volume in a randomized trial.
What is Relevant?
Reducing sodium did not increase weight or alter energy intake, but did decrease thirst and urine volume (control diet only), supporting the traditional understanding of sodium physiology and the importance of sodium reduction to lower blood pressure.
Acknowledgements
The authors thank Kartik Kalra, MD, for his help with the graphic abstract.
We are indebted to the study participants for their sustained commitment to the DASH-Sodium Trial.
Sources of Funding
The DASH-Sodium trial was supported by cooperative agreements and grants from the National Heart, Lung, and Blood Institute (U01-HL57173, to Brigham and Women’s Hospital; U01-HL57114, to Duke University; U01-HL57190, to Pennington Biomedical Research Institute; U01-HL57139 and K08 HL03857-01, to Johns Hopkins University; and U01-HL57156, to Kaiser Permanente Center for Health Research) and by the General Clinical Research Center Program of the National Center for Research Resources (M01-RR02635, to Brigham and Women’s Hospital, and M01-RR00722, to Johns Hopkins University).
SPJ supported by a NIH/NHLBI K23HL135273 and R21HL144876.
Abbreviations used:
- DASH
Dietary Approaches to Stop Hypertension
- GEE
generalized estimating equation
- CI
confidence interval
- SBP
systolic blood pressure
- DBP
diastolic blood pressure
Footnotes
This trial is registered at clinicaltrials.gov, number: NCT00000608
Conflicts of interest
The authors have no conflicts of interest to report.
References
- 1.Muntner P, Carey RM, Gidding S, Jones DW, Taler SJ, Wright JT, Whelton PK. Potential U.S. Population Impact of the 2017 ACC/AHA High Blood Pressure Guideline. J Am Coll Cardiol. 2018;71:109–118. [DOI] [PMC free article] [PubMed] [Google Scholar]
- 2.Sacks FM, Svetkey LP, Vollmer WM, Appel LJ, Bray GA, Harsha D, Obarzanek E, Conlin PR, Miller ER, Simons-Morton DG, Karanja N, Lin P-H, Aickin M, Most-Windhauser MM, Moore TJ, Proschan MA, Cutler JA. Effects on Blood Pressure of Reduced Dietary Sodium and the Dietary Approaches to Stop Hypertension (DASH) Diet. New England Journal of Medicine. 2001;344:3–10. [DOI] [PubMed] [Google Scholar]
- 3.He FJ, Li J, Macgregor GA. Effect of longer term modest salt reduction on blood pressure: Cochrane systematic review and meta-analysis of randomised trials. BMJ. 2013;346:f1325. [DOI] [PubMed] [Google Scholar]
- 4.Zeidel ML. Salt and water: not so simple. J Clin Invest. 2017;127:1625–1626. [DOI] [PMC free article] [PubMed] [Google Scholar]
- 5.Kitada K, Daub S, Zhang Y, Klein JD, Nakano D, Pedchenko T, Lantier L, LaRocque LM, Marton A, Neubert P, Schröder A, Rakova N, Jantsch J, Dikalova AE, Dikalov SI, Harrison DG, Müller DN, Nishiyama A, Rauh M, Harris RC, Luft FC, Wassermann DH, Sands JM, Titze J. High salt intake reprioritizes osmolyte and energy metabolism for body fluid conservation. J Clin Invest. 2017;127:1944–1959. [DOI] [PMC free article] [PubMed] [Google Scholar]
- 6.Rakova N, Kitada K, Lerchl K, Dahlmann A, Birukov A, Daub S, Kopp C, Pedchenko T, Zhang Y, Beck L, Johannes B, Marton A, Müller DN, Rauh M, Luft FC, Titze J. Increased salt consumption induces body water conservation and decreases fluid intake. J Clin Invest. 2017;127:1932–1943. [DOI] [PMC free article] [PubMed] [Google Scholar]
- 7.Appel LJ, Moore TJ, Obarzanek E, Vollmer WM, Svetkey LP, Sacks FM, Bray GA, Vogt TM, Cutler JA, Windhauser MM, Lin PH, Karanja N. A clinical trial of the effects of dietary patterns on blood pressure. DASH Collaborative Research Group. N Engl J Med. 1997;336:1117–1124. [DOI] [PubMed] [Google Scholar]
- 8.Svetkey LP, Sacks FM, Obarzanek E, Vollmer WM, Appel LJ, Lin PH, Karanja NM, Harsha DW, Bray GA, Aickin M, Proschan MA, Windhauser MM, Swain JF, McCarron PB, Rhodes DG, Laws RL. The DASH Diet, Sodium Intake and Blood Pressure Trial (DASH-sodium): rationale and design. DASH-Sodium Collaborative Research Group. J Am Diet Assoc. 1999;99:S96–104. [DOI] [PubMed] [Google Scholar]
- 9.Perrier E, Vergne S, Klein A, Poupin M, Rondeau P, Le Bellego L, Armstrong LE, Lang F, Stookey J, Tack I. Hydration biomarkers in free-living adults with different levels of habitual fluid consumption. Br J Nutr. 2013;109:1678–1687. [DOI] [PMC free article] [PubMed] [Google Scholar]
- 10.Imamura T, Kinugawa K, Minatsuki S, Muraoka H, Kato N, Inaba T, Maki H, Shiga T, Hatano M, Yao A, Kyo S, Komuro I. Urine osmolality estimated using urine urea nitrogen, sodium and creatinine can effectively predict response to tolvaptan in decompensated heart failure patients. Circ J. 2013;77:1208–1213. [DOI] [PubMed] [Google Scholar]
- 11.White H A heteroskedasticity-consistent covariance matrix estimator and a direct test for heteroskedasticity. Econometrica. 1980;48:817–838. [Google Scholar]
- 12.Peti-Peterdi J, Harris RC. Macula Densa Sensing and Signaling Mechanisms of Renin Release. J Am Soc Nephrol. 2010;21:1093–1096. [DOI] [PMC free article] [PubMed] [Google Scholar]
- 13.Kunita H, Obara T, Komatsu T, Hata S, Okamoto M. The effects of dietary sodium on the diurnal activity of the renin-angiotensin-aldosterone system and the excretion of urinary electrolytes. J Clin Endocrinol Metab. 1976;43:756–759. [DOI] [PubMed] [Google Scholar]
- 14.He FJ, Markandu ND, Sagnella GA, MacGregor GA. Effect of salt intake on renal excretion of water in humans. Hypertension. 2001;38:317–320. [DOI] [PubMed] [Google Scholar]
- 15.Bloch MJ. Worldwide prevalence of hypertension exceeds 1.3 billion. J Am Soc Hypertens. 2016;10:753–754. [DOI] [PubMed] [Google Scholar]
- 16.Mente A, O’Donnell M, Rangarajan S, McQueen M, Dagenais G, Wielgosz A, Lear S, Ah STL, Wei L, Diaz R, Avezum A, Lopez-Jaramillo P, Lanas F, Mony P, Szuba A, Iqbal R, Yusuf R, Mohammadifard N, Khatib R, Yusoff K, Ismail N, Gulec S, Rosengren A, Yusufali A, Kruger L, Tsolekile LP, Chifamba J, Dans A, Alhabib KF, Yeates K, Teo K, Yusuf S. Urinary sodium excretion, blood pressure, cardiovascular disease, and mortality: a community-level prospective epidemiological cohort study. Lancet. 2018;392:496–506. [DOI] [PubMed] [Google Scholar]
- 17.Juraschek SP, Woodward M, Sacks FM, Carey VJ, Miller ER, Appel LJ. Time Course of Change in Blood Pressure From Sodium Reduction and the DASH Diet. Hypertension. 2017;70:923–929. [DOI] [PMC free article] [PubMed] [Google Scholar]
- 18.Monteiro CA. Nutrition and health. The issue is not food, nor nutrients, so much as processing. Public Health Nutrition. 2009;12:729–731. [DOI] [PubMed] [Google Scholar]
Associated Data
This section collects any data citations, data availability statements, or supplementary materials included in this article.