

SUMMARY
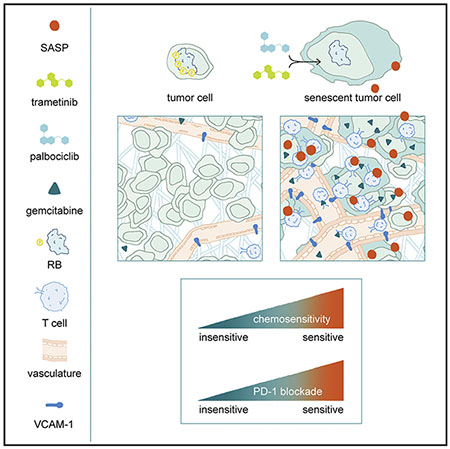
KRAS mutant pancreatic ductal adenocarcinoma (PDAC) is characterized by a desmoplastic response that promotes hypovascularity, immunosuppression, and resistance to chemo- and immunotherapies. We show that a combination of MEK and CDK4/6 inhibitors that target KRAS-directed oncogenic signaling can suppress PDAC proliferation through induction of retinoblastoma (RB) protein-mediated senescence. In preclinical mouse models of PDAC, this senescence-inducing therapy produces a senescence-associated secretory phenotype (SASP) that includes pro-angiogenic factors that promote tumor vascularization, which in turn enhances drug delivery and efficacy of cytotoxic gemcitabine chemotherapy. In addition, SASP-mediated endothelial cell activation stimulates the accumulation of CD8+ T cells into otherwise immunologically ‘cold’ tumors, sensitizing tumors to PD-1 checkpoint blockade. Therefore, in PDAC models, therapy-induced senescence can establish emergent susceptibilities to otherwise ineffective chemo- and immunotherapies through SASP-dependent effects on the tumor vasculature and immune system.
In Brief
In mouse models of KRAS mutant pancreatic ductal adenocarcinoma, tumor cell senescence following MEK and CDK4/6 inhibition promotes vascular remodeling through induction of a pro-angiogenic senescence-associated secretory phenotype, leading to enhanced drug delivery and T cell infiltration that sensitizes these tumors to chemotherapy and immune checkpoint blockade.
Graphical Abstract
INTRODUCTION
Pancreatic ductal adenocarcinoma (PDAC) conveys a dismal prognosis (Siegel et al., 2019) and is refractory to chemo- and immunotherapies, including immune checkpoint blockade that has revolutionized the treatment landscape of other tumors (Ribas and Wolchok, 2018; Royal et al., 2010). This treatment-refractory behavior likely results from the unique characteristics of PDAC, which arises through perturbations in a combination of undruggable cancer drivers, including mutations in the KRAS oncogene and disruption of the TP53, SMAD4, and CDKN2A tumor suppressors (Morris et al., 2010). Furthermore, the disease evolves within a heterogeneous tumor microenvironment (TME) characterized by a fibro-inflammatory stroma that contributes to disease progression (Ligorio et al., 2019; Öhlund et al., 2017), limits drug accessibility (Olive et al., 2009; Provenzano et al., 2012), and enforces an immune suppressive niche that suppresses anti-tumor immunity (Kraman et al., 2010). Indeed, several strategies have targeted aspects of the PDAC TME to improve drug uptake (Chauhan et al., 2013; Olive et al., 2009; Provenzano et al., 2012) and sensitivity to immunotherapies (Feig et al., 2013; Jiang et al., 2016).
KRAS mutations occur in over 90% of human PDAC, and mouse models implicate oncogenic KRAS in initiating and maintaining tumorigenesis as well as the stromal changes that accompany disease progression (Collins et al., 2012a, 2012b; Kapoor et al., 2014). While pharmacological efforts to directly target KRAS or its downstream effectors have proven largely ineffective to date, combinatorial strategies for inhibiting RAS pathway components and interfering with compensatory or negative feedback signaling have shown promise in preclinical studies (Manchado et al., 2016; Okumura and Jänne, 2014; Sun et al., 2014). Recently, we demonstrated that one of these targeted therapy combinations–the MEK inhibitor trametinib and CDK4/6 inhibitor palbociclib–could lead to durable cell-cycle exit of KRAS mutant lung and pancreas cancer cells through induction of retinoblastoma (RB) protein-mediated cellular senescence (Ruscetti et al., 2018).
Cellular senescence is a physiological stress-response that results in the proliferative arrest and immune-mediated clearance of damaged and pre-malignant cells, seemingly as a part of a wound healing process that facilitates tissue regeneration after injury (Demaria et al., 2014; Kang et al., 2011; Krizhanovsky et al., 2008; Mosteiro et al., 2016). Senescence can be triggered by oncogenic signaling, including by mutant KRAS in pre-malignant lesions such as pancreatic intraepithelial neoplasias (PanINs) (Caldwell et al., 2012), thus serving as a natural barrier to malignancy. The CDKN2A/RB and p53 tumor suppressor programs collaborate to regulate this process, and their disruption can disable senescence and facilitate cancer initiation and progression, including in PDAC (Bardeesy et al., 2006; Carrière et al., 2011; Morton et al., 2010; Serrano et al., 1997).
Two key molecular modules involved in senescence are an RB-dependent program that produces a repressive chromatin state to transcriptionally silence many pro-proliferative genes (Chicas et al., 2010; Narita et al., 2003), and a nuclear factor κB (NF-κB)-regulated gene activation program that induces expression of secreted factors that can influence the microenvironment (Chien et al., 2011; Lesina et al., 2016; Tasdemir et al., 2016). This latter component is often referred to as the senescence-associated secretory phenotype (SASP) and is characterized by the secretion of chemokines, cytokines, matrix metalloproteinases(MMPs), and other paracrine signaling factors (Coppé et al., 2008; Kuilman and Peeper, 2009). Given the pleiotropic nature of many of these secreted factors, the consequences of SASP are context-dependent, and can influence multiple cell types within the tumor milieu (Coppé et al., 2010; Faget et al., 2019). Hence, while SASP factors can be pro- or anti-tumorigenic, their production by pre-malignant cells can stimulate immune surveillance, leading to the clearance of senescent cells and contributing to tumor suppression (Kang et al., 2011; Tasdemir et al., 2016).
Although cancer cells evade senescence early during the course of tumor evolution, restoration of this program in advanced cancers can have profound anti-tumor effects. Indeed, genetic restoration of p53 in a RAS-driven liver carcinoma model induces senescence to promote tumor clearance by triggering innate immune surveillance (Xue et al., 2007). Pharmacological strategies that induce tumor cell senescence can also facilitate anti-tumor immunity and tumor regressions despite the absence of cytotoxicity to cancer cells themselves. For example, in a KRAS mutant lung cancer model, the induction of senescence by trametinib and palbociclib treatment triggered SASP-dependent and natural killer (NK) cell-mediated tumor regressions, even in tumors lacking p53 (Ruscetti et al., 2018). Intrigued by the ability of these RAS pathway-targeted therapies to produce therapeutically relevant effects on the surrounding TME, we set out to explore how senescence induction could remodel the hypovascular and immune suppressive PDAC TME and alter the treatment landscape of this disease.
RESULTS
Trametinib and Palbociclib Treatment Triggers Vascular Remodeling in PDAC
Combined trametinib and palbociclib (T/P) treatment, but neither agent alone, potently induces senescence and SASP in human PDAC lines (Ruscetti et al., 2018). To determine if therapy-induced senescence can alter the PDAC TME, we evaluated the response to T/P treatment in two mouse models of PDAC that recapitulate the histopathology and stromal responses observed clinically: the Pdx1-Cre;LSL-KRASG12D;Trp53fl/wt (KPCflox) genetically engineered mouse model (GEMM), where tumors form autochthonously in the pancreas (Herreros-Villanueva et al., 2012); and orthotopic transplantation of PDAC organoids derived from tumors arising in Pdx1-Cre; LSL-KRASG12D;Trp53R172H/wt (KPCmut) mice into the pancreata of syngeneic C57BL/6 recipients (Boj et al., 2015; Hingorani et al., 2003).
Two-week treatment with T/P (but neither agent alone) led to decreased proliferation, inhibition of ERK and RB phosphorylation, and induction of senescence-associated β-galactosidase (SA-β-gal) activity in the absence of apoptosis in both KPCflox GEMM and KPCmut organoid transplant models (Figures 1A, S1A, and S1B). This response was associated with a modest increase in the survival of PDAC-bearing animals (Figures S1C and S1D). In contrast to KRAS-driven lung cancer models (Ruscetti et al., 2018), however, T/P treatment did not increase NK cell numbers, activation, or cytotoxicity, and failed to elicit tumor regressions (Figures S1B and S1E–S1H). Therefore, while T/P treatment triggers senescence in PDAC, this does not engage NK cell surveillance or produce robust tumor regressions.
Figure 1. Trametinib and Palbociclib Treatment Triggers Vascular Remodeling in PDAC.
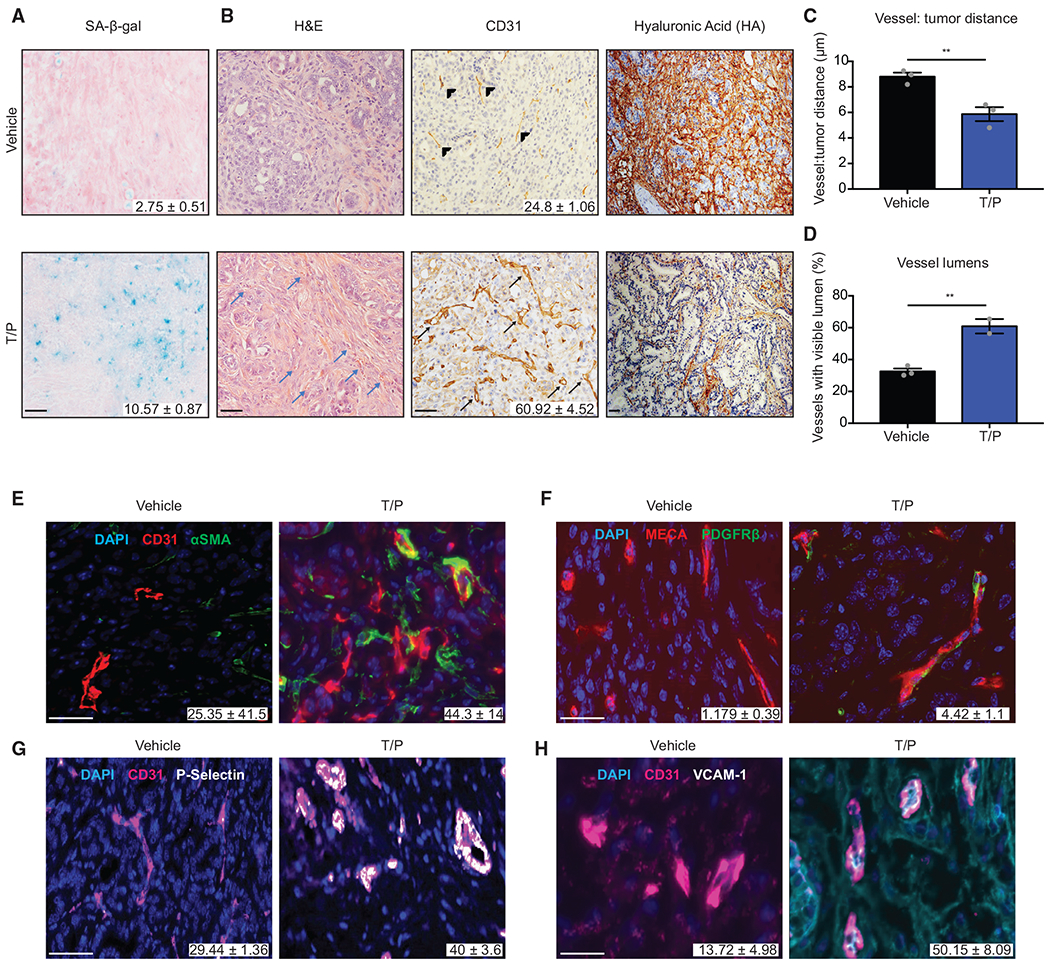
(A and B) H&E and immunohistochemical (IHC) staining of KPCflox GEMM tumors treated with vehicle or trametinib (1 mg/kg) and palbociclib (100 mg/kg) for 2 weeks. Quantification of SA-β-gal positive area (A) and blood vessels per field (B) are shown (n = 2–3; p < 0.02). Blue arrow, blood vessel; arrowhead, collapsed vessel; black arrow, visible lumen.
(C) Analysis of distance between vessels and tumor cells in (B) (n = 3).
(D) Quantification of vessels with visible lumens in (B) (n = 3).
(E–H) Immunofluorescence (IF) staining and quantification of αSMA (E), PDGFRβ (F), P-selectin (G), and VCAM-1 (H) colocalization with blood vessels in KPCflox GEMM tumors treated as in (A) (n = 2–3; p = 0.021, 0.044, 0.111, and 0.062, respectively).
Error bars, mean ± SEM. **p < 0.01. Scale bars, 50 μm.
See also Figure S1.
Close inspection of T/P-treated tumor sections showed an accumulation of blood vessels adjacent to tumor cells (Figure 1B), suggesting that T/P therapy may affect the TME in other ways. Combinatorial treatment led to an increase in CD31+ blood vessel density and closer proximity of vessels and tumor cells in both organoid transplant and GEMM models (Figures 1B, 1C, S1I, and S1J). By contrast, no change in the number of lymphatic vessels was observed (Figure S1L). Although many blood vessels in vehicle-treated PDAC tumors appeared collapsed, most in T/P-treated tumors harbored open and readily discernible lumens (Figures 1B, 1D, S1I, and S1K). T/P treatment also reduced the stromal content of hyaluronic acid (HA), an effect linked to increased vessel opening in PDAC (Provenzano et al., 2012), without affecting collagen deposition or accumulation of α-smooth muscle actin (αSMA)-positive myofibroblasts (Figures 1B, S1M, and S1N). Whereas the improved vascularization achieved through inhibition of signaling pathways involved in maintaining the desmoplastic stroma is associated with increased metastasis ( Lee et al., 2014; Rhim et al., 2014), PDAC-bearing mice treated with T/P showed fewer metastases compared to controls (Figures S1O and S1P). Hence, T/P treatment induces vascular remodeling without metastatic adaptation.
Compared to controls, the blood vessels present in T/P-treated tumors were associated with higher levels of αSMA and the pericyte marker PDGFRβ, characteristics of a mature vasculature (Figures 1E, 1F, and S1Q). Vascular endothelial cells also displayed upregulation of immunomodulatory cell surface molecules such as P-selectin, VCAM-1, and ICAM-1 (a phenomenon hereafter referred to as endothelial cell activation) that are expressed on permeable blood vessels that accompany tissue inflammation (Figures 1G, 1H, S1R, and S1S) (Hunt and Jurd, 1998; Lorenzon et al., 1998). Therefore, T/P treatment, perhaps by promoting senescence, leads to multiple vascular remodeling phenotypes in PDAC models.
SASP Factors Contribute to Vascular Remodeling in PDAC
In addition to immunomodulatory factors, senescent cells secrete SASP factors that can alter endothelial cell proliferation and behavior (Ancrile et al., 2007; Coppé et al., 2006; Mikuła-Pietrasik et al., 2016; Oubaha et al., 2016). Indeed, murine and human PDAC lines treated with T/P displayed increased secretion of pro-angiogenic factors (VEGF, PDGFA/B, FGF2) and MMPs (MMP2/3/7/9/10) compared to cells treated with single agents (Figures 2A and S2A). Increased expression of these SASP factors was also detected in tumor cells sorted from T/P-treated tumors derived from orthotopic transplant of KPCmut cell lines engineered to express luciferase and GFP, and conditioned media from KPCmut cells pretreated with T/P was able to support the proliferation of endothelial cells in culture (Figures 2B, S2B, and S2C). Similarly, when endothelial cells were grown on a 3D basement membrane, conditioned media from T/P-treated KPCmut cells promoted the formation of tube-like structures that were reminiscent of vascular networks in vivo (Figure 2C).
Figure 2. SASP Factors Contribute to Vascular Remodeling in PDAC.
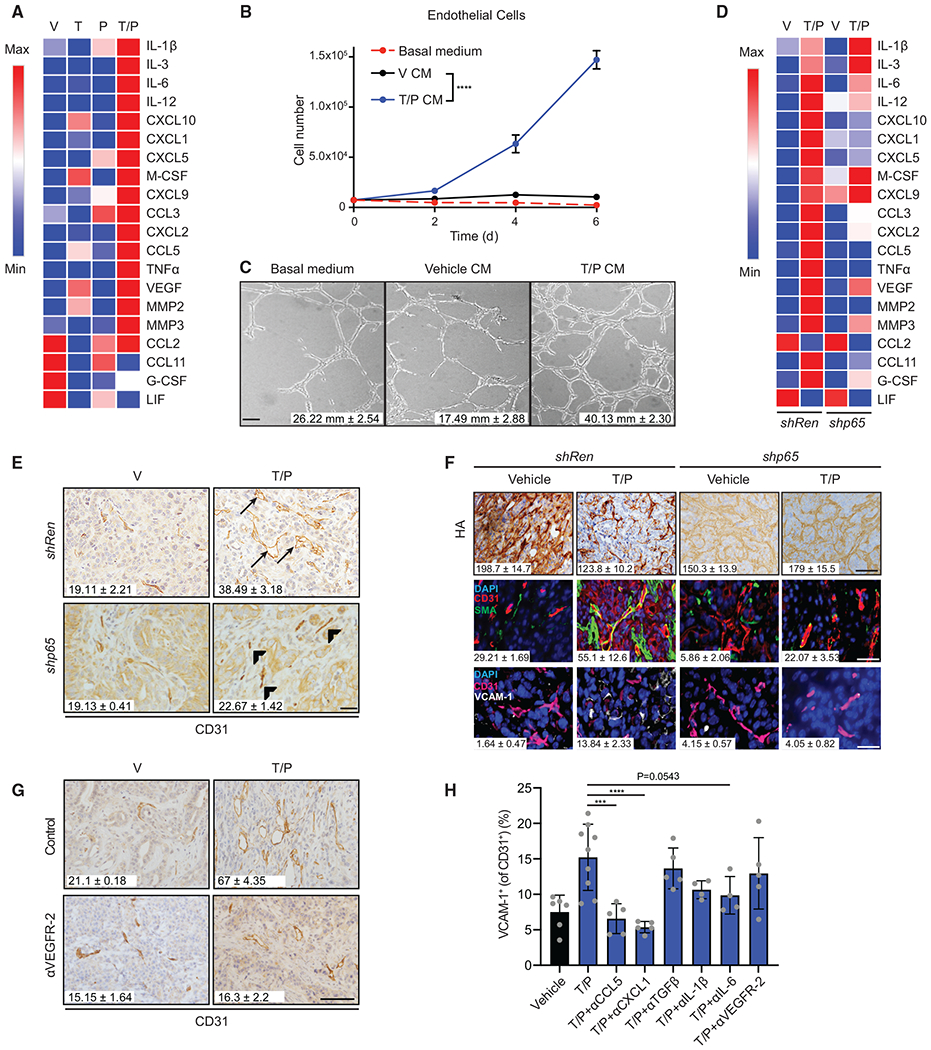
(A) Heatmap of cytokine array results from KPCmut cells following 8-day treatment with trametinib (25 nM) and/or palbociclib (500 nM). Data presented as mean of three biological replicates.
(B) Cell growth analysis of 3B11 cells cultured in serum-free (basal) or conditioned media (CM) from KPCmut cells treated as in (A) (n = 3).
(C) Endothelial tube formation analysis of 3B11 cells cultured in CM from (B). Quantification of total tube length is shown (n = 2; V versus T/P, p = 0.01).
(D) Heatmap of cytokine array results from KPCmut cells harboring control Renilla (Ren) or p65 shRNAs and treated as in (A). Data presented as mean of three biological replicates.
(E) IHC staining and quantification of blood vessels per field in KPCmut organoid transplant tumors harboring Ren or p65 shRNAs and treated for 2 weeks with vehicle or trametinib (1 mg/kg) and palbociclib (100 mg/kg) (n = 3; Ren T/P versus p65 T/P, p = 0.003). Arrowhead, collapsed vessel; arrow, visible lumen.
(F) IHC and IF staining of tumor samples in (E). Quantification of HA staining and αSMA and VCAM-1 colocalization with blood vessels are shown (n = 2–3; Ren V versus Ren T/P, p ≤ 0.05; Ren T/P versus p65 T/P, p ≤ 0.05).
(G) IHC staining and quantification of blood vessels per field in KPCmut organoid transplant tumors treated for 2 weeks with vehicle, trametinib (1 mg/kg), palbociclib (100 mg/kg), and/or a VEGFR-2 blocking antibody (DC101; 800 μg) (n = 3; T/P versus T/P+DC101, p = 0.003).
(H) Flow cytometry analysis of VCAM-1 expression on endothelial cells in KPCmut cell transplant tumors treated with vehicle, trametinib (1 mg/kg), palbociclib (100 mg/kg), and/or monoclonal antibodies (mAbs) targeting CCL5 (MAB478; 50 μg), CXCL1 (MAB453; 25 μg), TGF-β (1D11; 300 μg), IL-1β (B122; 200 μg), IL-6 (MP5-20F3; 200 μg), or VEGFR-2 (DC101; 800 μg) for 2 weeks (n ≥ 4).
Two-way ANOVA (B). One-way ANOVA (F and H). Error bars, mean ± SEM. ****p < 0.001, ***p < 0.01, Scale bars, 50 μm.
See also Figures S2 and S3.
Other stromal subtypes in the PDAC TME, most prominently fibroblasts and macrophages, can also secrete factors that promote angiogenesis. However, T/P treatment did not stimulate the secretion of angiogenic factors from pancreatic fibroblasts, and conditioned media from T/P-treated senescent PDAC cells did not affect fibroblast or macrophage proliferation (Figures S2D–S2F). While there was an increase in the number of PDAC-associated F4/80+ macrophages and their expression of MHC-II and CD86 following T/P treatment, we only observed minor changes in expression of VEGF or other macrophage polarization markers (Figures S2G–S2I). Furthermore, the vascular remodeling that accompanied senescence induction was not dependent on immune cells, as T/P treatment of tumors derived from KPCmut organoids injected orthotopically into C567BL/6 or immunodeficient NOD-scid IL2Rγnull (NSG) mice led to similar increases in vascular density, open vessel lumens, and endothelial activation (Figures S2J–S2L). Therefore, senescent tumor cells are likely the primary source of angiogenic SASP factors following T/P treatment.
To directly test whether the SASP contributes to vascular remodeling in vivo, KPCmut organoids were transduced with short hairpin RNAs (shRNAs) targeting the p65 subunit of NF-κB, a transcription factor required for SASP induction but dispensable for senescence-mediated growth arrest (Chien et al., 2011; Ruscetti et al., 2018). As predicted, suppression of NF-κB in PDAC cells treated with T/P reduced the secretion of both immune modulatory and pro-angiogenic SASP factors (Figure 2D). KPCmut organoids expressing the p65 or control (Ren) shRNA were then transplanted orthotopically into C57BL/6 mice to assess the impact of SASP suppression on vascular remodeling. While potent NF-κB inhibition can block proliferation of KRAS mutant tumors in some contexts (Lesina et al., 2016; Meylan et al., 2009), partial NF-κB suppression using p65-targeting shRNAs did not affect tumor growth or senescence-associated cell-cycle arrest of KPCmut organoid-derived tumors following T/P treatment (Figures S3A–S3C). Instead, p65 suppression blocked the increase in vascular density, maturation, perfusion, and immunomodulatory activation, as well as the decrease in HA levels that accompanies T/P treatment in tumors harboring Ren shRNAs (Figures 2E, 2F, and S3D–S3H).
VEGF was one SASP factor that contributed to vascular remodeling. Treatment of human and murine PDAC cells produced an NF-κB-dependent increase in VEGF secretion (Figures 2A, 2D, and S2A). Moreover, suppression of VEGFR-2, the cognate receptor for VEGF, using high doses of the VEGFR-2 blocking antibody DC101 effectively inhibited neo-vascularization following T/P treatment (Figure 2G). By contrast, VEGFR-2 blockade did not inhibit the upregulation of endothelial activation markers P-selectin and VCAM-1 following T/P treatment, which instead were suppressed using antagonizing antibodies against other inflammatory SASP factors, including CCL5, CXCL1, and interleukin (IL)-6 (Figures 2H and S3I). Thus, different SASP factors collaborate to produce vascular remodeling and endothelial cell activation after T/P treatment.
Senescence-Inducing Therapies Sensitize PDAC to Cytotoxic Chemotherapy
The hypovascularity and vascular compression associated with PDAC contributes to its chemo-refractory nature by impeding drug delivery to the tumor (Olive et al., 2009; Provenzano et al., 2012). To determine if SASP-mediated vascular remodeling enhances tumor perfusion and permeability of soluble factors, including standard-of-care gemcitabine chemotherapy, tumor-bearing KPCmut organoid transplant or KPCflox GEMM mice were pretreated with vehicle or T/P for 2 weeks, and then injected with (1) lectin, (2) a high molecular weight dextran, and/or (3) a 14C-labeled gemcitabine radiotracer. Consistent with the increase in vessel size and maturation, vessels in T/P pretreated tumors had increased lectin perfusion (Figure 3A). T/P pretreated tumors also had significantly more dextran accumulation as compared to controls, indicative of enhanced vessel permeability (Figures 3A and S4B). These dual effects of T/P treatment on vascular permeability and perfusion resulted in no change in hypoxia in the PDAC TME as assessed by pimonidazole staining (Figure S4A).
Figure 3. Senescence-Inducing Therapies Sensitize PDAC to Cytotoxic Chemotherapy.
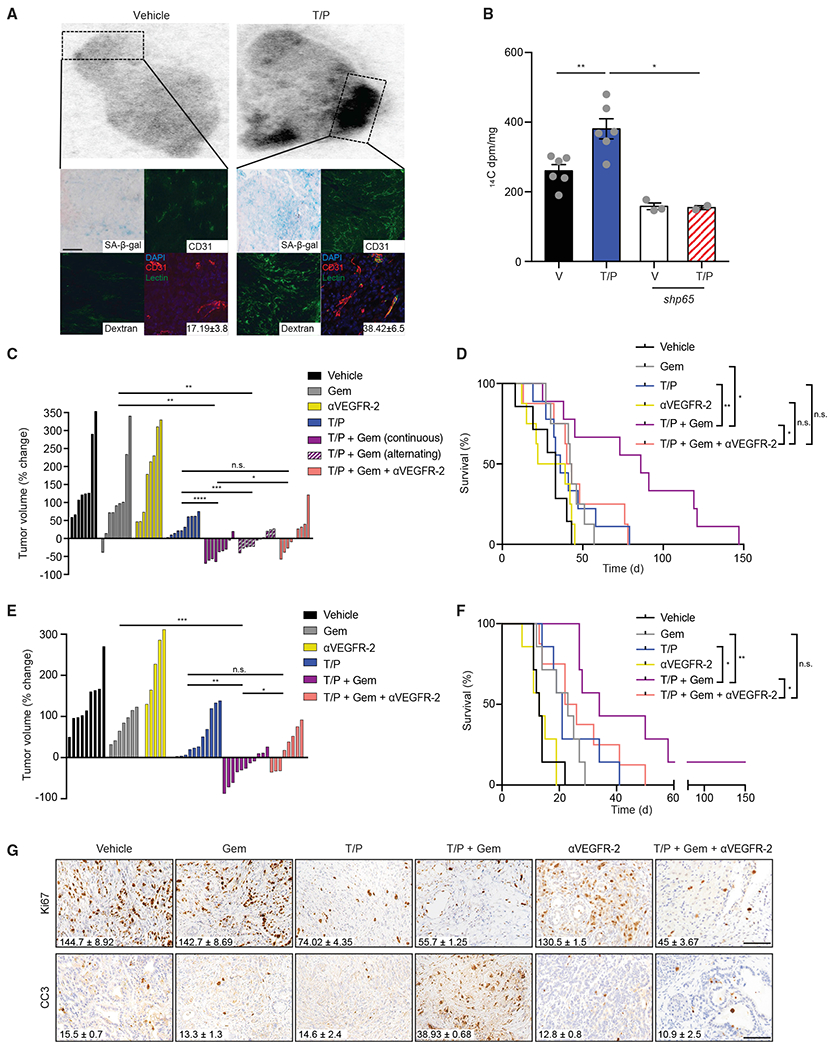
(A) KPCmut organoid transplant mice were pretreated with vehicle or trametinib (1 mg/kg) and palbociclib (100 mg/kg) for 2 weeks and subsequently injected with 14C-labeled gemcitabine (gem), dextran, and/or lectin prior to tissue harvest. Autoradiograph showing distribution of 14C-gem in tumors. Below: overlay of autoradiographs with IHC/IF staining and quantification of lectin colocalization with blood vessels (n = 2–3; p = 0.054).
(B) 14C-gem quantification in indicated tumors (n = 3–6).
(C) Waterfall plot of the response of KPCmut organoid transplant tumors after 2 weeks treatment with vehicle, trametinib (1 mg/kg), palbociclib (100 mg/kg), gemcitabine (100 mg/kg), and/or a VEGFR-2 blocking antibody (DC101; 800 μg) either continuously or on an alternating schedule (n ≥ 8).
(D) Kaplan-Meier survival curve of KPCmut organoid transplant mice treated as in (C) (n ≥ 7).
(E) Waterfall plot of the response of KPCflox GEMM tumors following treatment as in (C) (n ≥ 5).
(F) Kaplan-Meier survival curve of KPCflox GEMM mice treated as in (C) (n ≥ 7).
(G) IHC staining of KPCflox GEMM tumors treated as in (C). Quantification of Ki67+ and cleaved capase-3 (CC3+) cells per field is shown (n = 3; Gem versus T/P/G and T/P/G versus T/P/G/DC101, p < 0.05).
One-way ANOVA (B, C, and E). Log-rank test (D and F). Error bars, mean ± SEM. ****p < 0.001, ***p < 0.01, **p < 0.01, *p < 0.05. n.s., not significant. Scale bars, 50 μm.
See also Figure S4.
T/P pretreatment also increased gemcitabine penetration into the tumor, particularly in focal regions containing high densities of SA-β-gal+ senescent cells and blood vessels (Figures 3A, 3B, and S4B). By contrast, such effects were not observed in the normal pancreas or other organs of the same tumor-bearing mice (Figure S4C). The increase in drug uptake and dextran accumulation in tumors following T/P treatment was suppressed upon tumor-specific p65 knockdown or DC101 treatment, indicating these processes were dependent on SASP induction and signaling through the SASP factor VEGF (Figures 3B and S4D).
To assess whether the addition of gemcitabine to the T/P combination (T/P/G) produced better treatment outcomes than either regimen alone, cohorts of tumor-bearing KPCmut organoid transplant or KPCflox GEMM mice were monitored for tumor response and for overall survival following treatment with gemcitabine, T/P, or both. To examine the contribution of the remodeled vasculature to drug activity, some mice were also treated with DC101 to prevent SASP-mediated neo-vascularization. As is often observed clinically (Carmichael et al., 1996), gemcitabine alone had modest effects on tumor growth and limited survival impact in our murine PDAC models (Figures 3C–3F). T/P treatment modestly delayed tumor growth and produced a marginal survival advantage, but the T/P/G regimen produced potent tumor regressions and significantly enhanced survival, effects that were largely ablated by DC101 (Figures 3C–3F). Similar efficacy was observed when PDAC-bearing mice were treated using an alternating weekly schedule of T/P and gemcitabine (Figures 3C). These results further support a role for T/P pretreatment in priming gemcitabine efficacy through its vascular remodeling effects, as has been observed in other settings (Olive et al., 2009; Provenzano et al., 2012).
Histological analyses of tumors revealed that T/P or gemcitabine treatment alone was not cytotoxic, but the T/P/G regimen produced considerable tumor cell apoptosis that could be blocked by DC101 (Figures 3G, S4E, and S4F). We suspect that this increase in tumor cell apoptosis results from a culling of cycling tumor cells that fail to senesce, as analysis of the residual tumor mass following short-term T/P/G treatment revealed an enrichment for non-proliferating and SA-β-gal-positive cells as compared to T/P or gemcitabine treatment alone (Figures 3G and S4E–S4G). Thus, SASP-provoked vascular remodeling can enhance PDAC responses to cytotoxic chemotherapy, at least in part, by facilitating drug uptake.
We also examined the treatment responses of two patient-derived xenograft (PDX) models propagated through subcutaneous transplantation of PDAC tissue into immunodeficient mice. While many subcutaneous xenograft models lack the dense stroma and hypovascularity found in autochthonous PDACs (Olive et al., 2009), two models obtained from patients that had progressed under gemcitabine chemotherapy regimens retained a robust and dense stroma and thus were chosen for further analysis (Figure S4H). As was noted in the murine models, T/P treatment triggered proliferative arrest and senescence in PDX tumors, together with an increase in vascular density and lumen diameter and HA degradation in the stroma (Figures S4H–S4K). Both PDX models had only a modest response to gemcitabine alone, whereas T/P/G therapy produced an increase in apoptosis associated with sustained tumor growth inhibition and partial tumor regressions in some mice (Figures S4L–S4N). Thus, vascular remodeling following therapy-induced senescence also sensitizes human PDAC to chemotherapy.
The SASP Promotes T Cell Infiltration via Endothelial Activation
Besides its dysfunctional vasculature, human and mouse PDAC displays an abundance of immune suppressive myeloid and regulatory T cells (Tregs) together with a scarcity of cytotoxic lymphocytes (Blando et al., 2019; Clark et al., 2007; Vonderheide and Bayne, 2013). As such, these tumors are considered immunologically “cold.” Hypovascularity and lack of an activated endothelium can also impair lymphocyte homing to normal and malignant tissues (Huang et al., 2018; Muller, 2009; Wu et al., 1992). We therefore used a combination of genetic and pharmacological approaches to assess the consequences of perturbing SASP, neo-vascularization, or endothelial cell activation on immune cell infiltrates following T/P therapy.
Consistent with the above results (see Figures S1E and S1F), drug treatment did not increase NK cell numbers or activity in any of the three murine PDAC models tested, and antibody-mediated NK cell depletion did not affect the survival of T/P-treated mice harboring orthotopically transplanted KPCmut cell-derived tumors (Figures S5A and S5B). Instead, we noted a substantial increase in the influx of T cells, and in particular, CD8+ T cells, into the tumor mass of transplanted and autochthonous PDAC following 2-week T/P treatment (Figures 4A, 4B, and S5C). Immunophenotyping confirmed that this increase was mainly due to CD8+ T cell accumulation that occurred in the absence of changes in Ly6G+ neutrophil, Gr-1hiCD11b+ myeloid-derived suppressor cell (MDSC), FOXP3+Treg, or FAP+ fibroblast populations that have been associated with CD8+ T cell suppression in PDAC (Figures 4C, 4D, and S5D–S5F) (Clark et al., 2007; Feig et al., 2013; Jiang et al., 2016; Steele et al., 2016). This T/P treatment-induced increase in CD8+ T cells required SASP-mediated vascular remodeling, as the effect was largely abolished in tumors harboring a p65 shRNA or treated with DC101 (Figures 4E–4H).
Figure 4. The SASP Promotes T Cell Infiltration via Endothelial Activation.
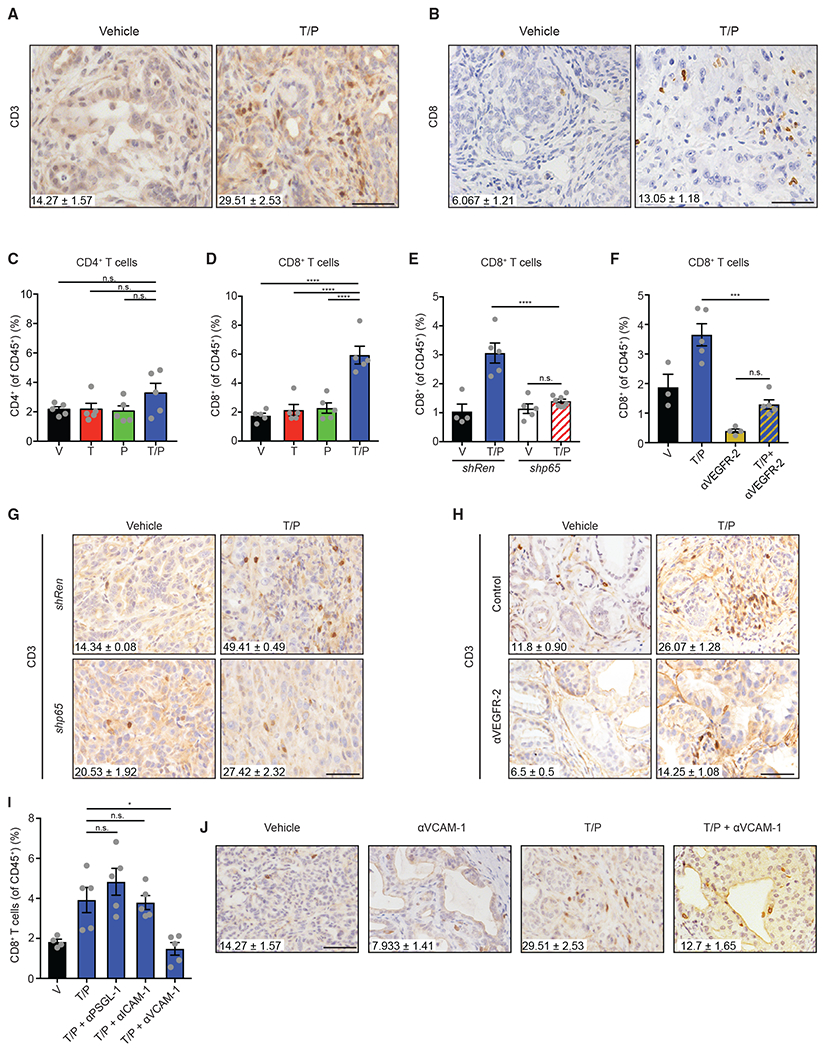
(A and B) IHC staining and quantification of intratumoral total (A) and CD8+ (B) T cells per field in KPCflox GEMM tumors treated with vehicle or trametinib (1 mg/kg) and palbociclib (100 mg/kg) for 2 weeks (n = 3; p < 0.01).
(C and D) Flow cytometry analysis of CD4+ (C) and CD8+ (D) T cells in KPCmut cell transplant tumors following 2-week treatment with vehicle, trametinib (1 mg/kg), and/or palbociclib (100 mg/kg) (n = 5).
(E) Flow cytometry analysis of CD8+ T cells in KPCmut cell transplant tumors harboring control Ren or p65 shRNAs and treated as in (A) (n = 4–7).
(F) Flow cytometry analysis of CD8+ T cells in KPCmut cell transplant tumors treated with vehicle, trametinib (1 mg/kg), palbociclib (100 mg/kg), and/or a VEGFR-2 blocking antibody (DC101; 800 μg) for 2 weeks (n = 3–5).
(G) IHC staining and quantification of intratumoral T cells per field in KPCmut organoid tumors harboring Ren or p65 shRNAs and treated as in (A) (n = 2–3; Ren T/P versus p65 T/P, p = 0.0001).
(H) IHC staining and quantification of intratumoral T cells per field in KPCflox GEMM tumors treated as in (F) (n = 2–3; T/P versus T/P/DC101, p = 0.007).
(I) Flow cytometry analysis of CD8+ T cells in KPCmut cell transplant tumors following 2-week treatment with vehicle, trametinib (1 mg/kg), palbociclib (100 mg/kg), and/or neutralizing mAbs targeting PSGL-1 (4RA10; 50 μg), ICAM-1 (YN1/1.7.4; 200 μg), or VCAM-1 (M/K-2.7; 200 μg) (n = 4–5).
(J) IHC staining and quantification of intratumoral T cells per field in KPCflox GEMM tumors treated with vehicle, trametinib (1 mg/kg), palbociclib (100 mg/kg), and/or a VCAM-1 neutralizing antibody (M/K-2.7; 200 μg) for 2 weeks (n ≥ 3; T/P versus T/P/VCAM-1, p = 0.008). Values for V and T/P-treated cohorts are the same displayed in (A).
One-way ANOVA (C–F and I). Error bars, mean ± SEM. ****p < 0.001, ***p < 0.01, *p < 0.05. n.s., not significant. Scale bars, 50 μm.
See also Figure S5.
To assess whether endothelial cell activation contributes to CD8+ T cell accumulation that accompanies senescence in T/P-treated PDAC, we used neutralizing antibodies against the P-selectin ligand PSGL-1, VCAM-1, and ICAM-1, and evaluated the PDAC immune landscape. Blockade of VCAM-1, but not PSGL-1 or ICAM-1, significantly reduced the numbers of total and CD8+ tumor-infiltrating T cells in T/P treated-mice (Figures 4I and 4J). VCAM-1 induction on endothelial cells facilitates blood vessel adhesion and tissue extravasation of T cells expressing its ligand, VLA-4 (Lorenzon et al., 1998; Nandi et al., 2004). Accordingly, VLA-4 expression was elevated on CD8+ T cells isolated from transplanted PDAC in a SASP-dependent manner following T/P treatment (Figure S5G). Thus, SASP-induced vascular remodeling, in part through the VCAM-1/VLA-4 cell adhesion axis, enables the penetration of CD8+ T cells into the PDAC TME.
Therapy-Induced Senescence Leads to T Cell Activation and Exhaustion
PDAC-associated CD8+ T cells expressed higher levels of the activation markers CD69 and CD44 following T/P, but not single agent or vehicle treatment (Figures 5A and 5B). This effect was dependent on SASP-mediated vascular remodeling (Figures S6A–S6D), hinting that senescence induction in tumor cells may stimulate the activity of tumor-reactive T cells. Of note, both MEK and CDK4/6 inhibitors can increase antigen presentation and T cell targeting of tumor cells in other cancer models (Brea et al., 2016; Deng et al., 2018; Ebert et al., 2016; Goel et al., 2017; Schaer et al., 2018) and, accordingly, transcripts encoding components of the antigen processing/presentation machinery were elevated in human PDAC lines following T or P treatment alone (Figure S6E). Nonetheless, the T/P combination produced a much greater increase in the expression of these genes as well as surface level expression of MHC-I in orthotopic KPCmut tumors (Figures 5C and S6E). This effect appeared functionally meaningful, as OT-1 T cells co-cultured with antigen matched ovalbumin (OVA)-expressing KPCmut PDAC cells showed enhanced T cell activation and expression of the effector cytokines tumor necrosis factor alpha (TNF-α) and interferon (IFN)-γ after T/P-pretreatment of tumor cells in an MHC-I-dependent manner (Figures S6F and S6G).
Figure 5. Therapy-Induced Senescence Leads to T Cell Activation and Exhaustion.
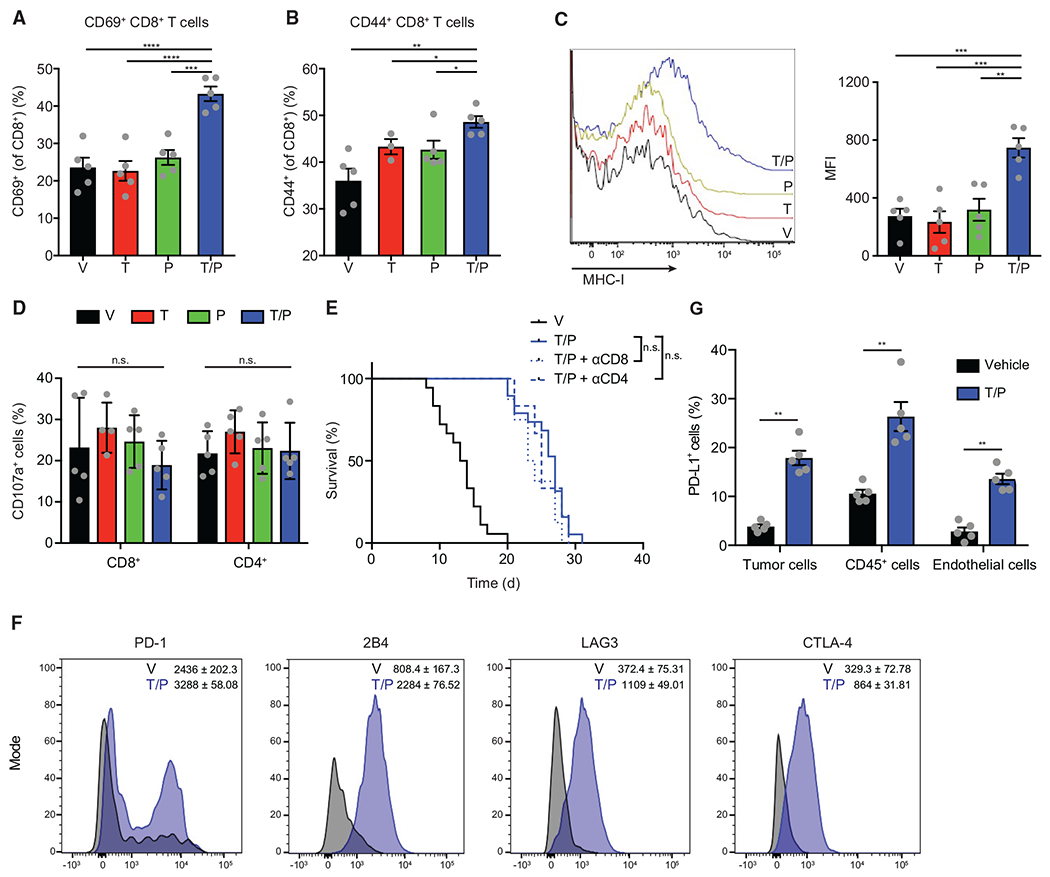
(A–D) Flow cytometry analysis of KPCmut cell transplant tumors following 2-week treatment with vehicle, trametinib (1 mg/kg) and/or palbociclib (100 mg/kg) (n = 3–5). (A) Percentage of CD69+ CD8+ T cells. (B) Percentage of CD44+ CD8+ T cells. (C) Representative histograms (left) and quantification of mean fluorescent intensity (MFI) of MHC-I (H-2kb) expression on tumor cells. (D) Percentage of CD107a+ T cells.
(E) Kaplan-Meier survival curve of KPCmut cell transplant mice treated with vehicle or trametinib (1 mg/kg) and palbociclib (100 mg/kg) in the presence or absence of a CD8 (2.43; 200 μg) or CD4 (GK1.5; 200 μg) depleting antibody (n ≥ 6).
(F and G) Flow cytometry analysis of KPCmut cell transplant tumors following treatment as in (A). (F) Representative flow cytometry plots and MFI for PD-1 (p = 0.016), 2B4 (p < 0.0001), LAG3 (p < 0.0001), and CTLA-4 (p = 0.0002) expression on CD8+ T cells (n = 3–5). (G) Percentage of PD-L1+ tumor, immune, and endothelial cells (n = 5).
One-way ANOVA (A–D). Log-rank test (E). Error bars, mean ± SEM. ****p < 0.0001, ***p < 0.001, **p < 0.01, *p < 0.05. n.s., not significant.
See also Figure S6.
Despite producing conditions that favor activation of cytotoxic T cell effector functions, T/P treatment did not stimulate robust anti-tumor T cell immunity in PDAC. Hence, T cells isolated from KPCmut tumors following T/P treatment did not express the cytotoxicity marker CD107a, and neither CD8 nor CD4 depletion altered the modest survival advantage produced by T/P therapy (Figures 5D and 5E). In agreement, CD8+ T cells isolated from the T/P treatment cohort displayed higher expression levels of the exhaustion markers PD-1,2B4, CTLA-4, and LAG3 (Figure 5F). While PD-1 expression can indicate prior T cell activation and priming, it can also induce T cell exhaustion and dysfunction through binding to its ligand PD-L1 (Sharpe and Pauken, 2018; Sun et al., 2018). Indeed, immune, endothelial, and tumor cells each showed a significant increase in surface expression of PD-L1 after T/P treatment (Figure 5G). Therefore, despite initial influx of activated T cells into PDAC undergoing therapy-induced senescence, CD8+ T cells rapidly become phenotypically exhausted and do not contribute to an anti-tumor response.
T Cell Exhaustion Is Reversed by PD-1 Blockade that Triggers Anti-tumor Immunity
Induction of the PD-1/PD-L1 inhibitory axis in T cell inflamed tumors following T/P treatment provides a clear rationale for combining senescence-inducing agents with PD-1 blockade. First, we examined activation and exhaustion marker expression on CD8+ T cells isolated from KPCmut cell transplant tumors treated with T/P in combination with PD-1 blockade (T/P/PD-1). Remarkably, CD8+ T cells from T/P/PD-1-treated tumors displayed reduced expression of exhaustion markers and increased co-expression of activation markers CD69 and CD44 compared to T/P treatment alone (Figures 6A–6C). These T cells also displayed higher TNF-α, INF-γ, and granzyme B expression compared to those harvested from tumors following T/P or PD-1 treatment alone, further indicative of reversion of lymphocyte dysfunction (Figures 6D and 6E).
Figure 6. T Cell Exhaustion Is Reversed by PD-1 Blockade that Triggers Anti-tumor Immunity.
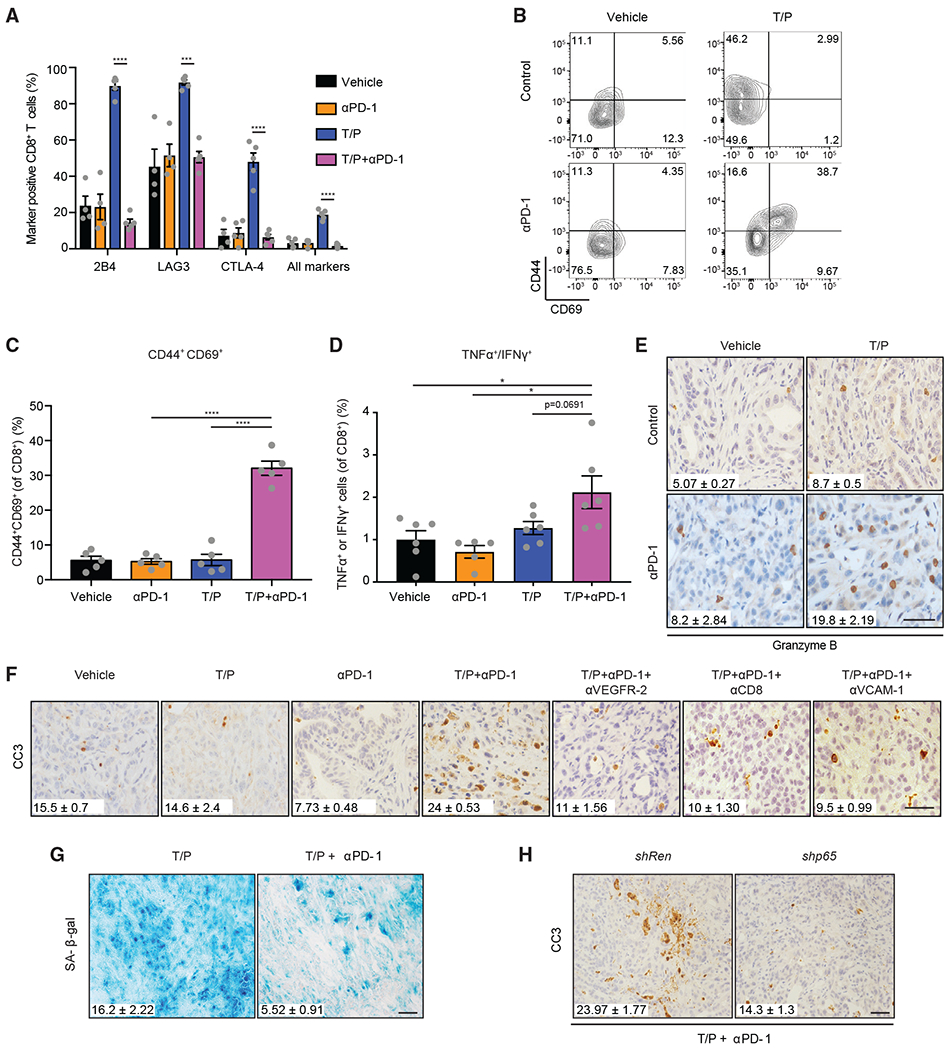
(A–D) Flow cytometry analysis of KPCmut cell transplant tumors following 2-week treatment with vehicle, trametinib (1 mg/kg), palbociclib (100 mg/kg), and/or a PD-1 blocking antibody (RMP1-14; 200 μg). (A) Exhaustion marker expression on CD8+ T cells (n = 4–5). Representative flow cytometry plots (B) and quantification (C) of CD69 and CD44 expression on CD8+ T cells (n = 5). (D) Percentage of CD8+ T cells expressing TNF-α and/or IFN-γ (n = 5–6).
(E) IHC staining and quantification of granyzme B+ cells in KPCmut organoid transplant tumors following treatment as in (A) (n = 2–3; T/P versus T/P/PD-1, p = 0.030; PD-1 versus T/P/PD-1, p = 0.041).
(F) IHC staining and quantification of CC3+ cells in KPCflox GEMM tumors treated for 2 weeks with vehicle, trametinib (1 mg/kg), palbociclib (100 mg/kg), and/or mAbs targeting PD-1 (RMP1-14; 200 μg), VEGFR-2 (DC101; 800 μg), CD8 (2.43; 200 μg), or VCAM-1 (M/K-2.7; 200 μg) (n = 2-3; T/P versus T/P/PD-1, p = 0.016; T/P/PD-1 versus T/P/PD-1/DC101, p = 0.001; T/P/PD-1 versus T/P/PD-1/CD8, p = 0.0001; T/P/PD-1 versus T/P/PD-1/VCAM-1, p = 0.005). Values for V and T/P-treated cohorts are the same displayed in Figure 3G.
(G) Staining and quantification of SA-β-gal+ area in KPCmut organoid transplant tumors treated with trametinib (1 mg/kg) and palbociclib (100 mg/kg) in the presence or absence of a PD-1 blocking antibody (RMP1-14; 200 μg) for 2 weeks (n = 3; p = 0.011).
(H) KPCmut organoid transplant tumors harboring Ren or p65 shRNAs were treated for 2 weeks as in (G). Quantification of CC3+ cells is shown (n = 3; p = 0.03).
One-way ANOVA (C and D). Error bars, mean ± SEM. ****p < 0.0001, ***p < 0.001, *p < 0.05. Scale bars, 50 μm.
Tumors isolated from mice treated with T/P and PD-1 blockade displayed increased apoptosis compared to anti-PD-1 therapy alone (Figure 6F). Activated T cells appeared to preferentially target senescent tumor cells, as T/P/PD-1-treated tumors showed a reduction in SA-β-gal positive cells compared to T/P treatment (Figure 6G). Both senescence-associated vascular remodeling and CD8+ T cell mobilization were required for these effects, because apoptosis produced by T/P/PD-1 treatment was abrogated by tumor specific suppression of p65, VEGFR-2 signaling disruption, VCAM-1 neutralization, and CD8 depletion (Figures 6F and 6H). Thus, PD-1 checkpoint blockade reawakens exhausted CD8+ T cells to trigger anti-tumor immunity following senescence induction.
Senescence-Associated Vascular Remodeling Potentiates Immune Checkpoint Blockade
The above results prompted us to assess the efficacy of T/P/PD-1 therapy in our preclinical murine PDAC models. Studies suggest that immune checkpoint blockade efficacy is partly dependent on mutations recognized as “non-self” by T cells (Samstein et al., 2019; Schumacher and Schreiber, 2015); accordingly, we observed a mutation burden consistent with that of human PDAC in our mouse models (Figure S7A). Thus, PDAC-bearing KPCmut organoid transplant or KPCflox GEMM mice were treated with T/P and/or anti-PD-1 therapy and monitored for changes in biological responses, tumor growth, and overall survival.
The anti-tumor effects of combining immune checkpoint blockade with the senescence-inducing T/P regimen went well beyond what was observed following standard-of-care gemcitabine (see Figure 3), or either T/P or anti-PD1 treatment alone. Two-week treatment with T/P/PD-1 produced areas of tumor destruction visible by gross histology and tumor regressions in 4/9 KPCflox GEMM and 10/10 KPCnut organoid transplant mice (Figures 7A–7D). By contrast, all tumors treated with anti-PD1 alone continued to progress after 2-week treatment (Figures 7C and 7D). These anti-tumor effects translated into increased survival, producing an over 5-fold increase in the median survival of KPCflox GEMM mice treated with T/P/PD-1 as compared to PD-1 alone and a number of long-term survivors in both models (Figures 7E and 7F). The anti-tumor effects of PD-1 checkpoint blockade were predicated on potent MEK inhibition, as administration of the T/P/PD-1 regimen at a suboptimal trametinib dose (0.3 mg/kg) that was insufficient to inhibit ERK phosphorylation or induce senescence and its vascular or T cell remodeling effects was not efficacious (Figures S7B–S7D). These data imply that senescence induction upon combined T/P treatment is necessary to potentiate PD-1 blockade in PDAC models.
Figure 7. Senescence-Associated Vascular Remodeling Potentiates Immune Checkpoint Blockade in PDAC.
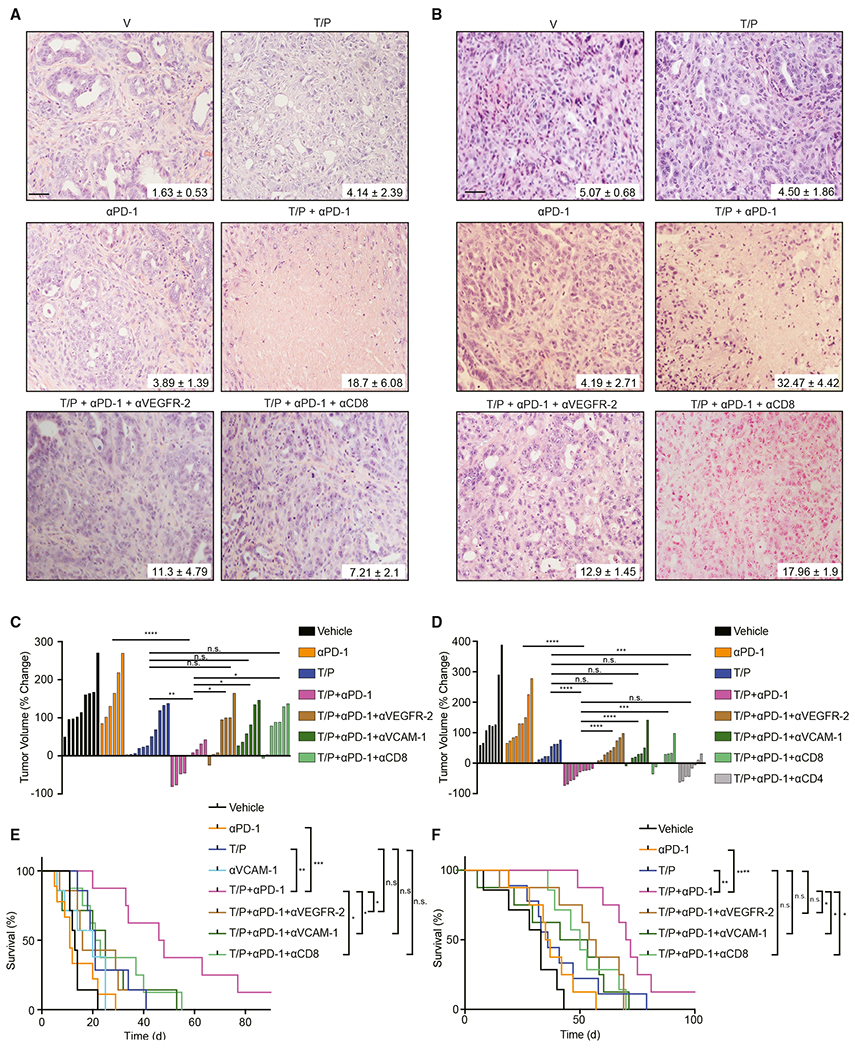
(A) H&E staining of KPCflox GEMM tumors treated for 2 weeks with vehicle, trametinib (1 mg/kg), palbociclib (100 mg/kg), and/or mAbs targeting PD-1 (RMP1-14; 200 μg), VEGFR-2 (DC101; 800 μg), or CD8 (2.43; 200 μg). Percent of tumor covered in necrosis is shown (n = 3; T/P versus T/P/PD-1, p = 0.08; PD-1 versus T/P/PD-1, p = 0.027).
(B) H&E staining of KPCmut organoid transplant tumors treated for 2 weeks as in (A). Percent of tumor covered in necrosis is shown (n = 3; T/P versus T/P/PD-1, p = 0.004; PD-1 versus T/P/PD-1, p = 0.019; T/P/PD-1 versus T/P/PD-1/DC101, p = 0.016; T/P/PD-1 versus T/P/PD-1/CD8, p = 0.09).
(C and D) Waterfall plot of the response of KPCflox GEMM (C) and KPCmut organoid transplant (D) tumors after 2 weeks of treatment with vehicle, trametinib (1 mg/kg), palbociclib (100 mg/kg), and/or mAbs targeting PD-1 (RMP1-14; 200 μg), VEGFR-2 (DC101; 800 μg), CD8 (2.43; 200 μg), CD4 (GK1.5; 200 μg), or VCAM-1 (M/K-2.7; 200 μg) (n ≥ 6). Values for V and T/P-treated cohorts are the same displayed in Figures 3C and 3E.
(E and F) Kaplan-Meier survival curves of KPCflox GEMM(E) and KPCmut organoid transplant (F) mice treated as in (D) (n ≥ 7). Values for V and T/P-treated cohorts are the same displayed in Figures 3D and 3F.
One-way ANOVA (C and D). Log-rank test (E and F). Error bars, mean ± SEM. ****p < 0.0001, ***p < 0.001, **p < 0.01, *p < 0.05. n.s., not significant. Scale bars, 50 μm.
See also Figure S7.
We also evaluated treatment responses in PDAC-bearing mice in which SASP was disabled by p65 shRNA, vascular remodeling was perturbed by VEGFR-2 or VCAM-1 antibodies, or either CD4+ or CD8+ T cells were depleted. p65, VEGFR-2, or VCAM-1 inhibition largely blocked the ability of T/P/PD-1 treatment to elicit tumor destruction and produce robust tumor regressions (Figures 7A–7F, S7E, and S7F). Synergy between T/P treatment and PD-1 blockade was dependent on CD8+, but not CD4+ T cells (Figures 7A–7F). Histological analysis of KPCflox GEMM tumors that relapsed after long-term T/P/PD-1 therapy consistently showed hypovascularization, as well as poor endothelial activation and T cell penetration, similar to those of vehicle-treated mice (Figures S7G–S7I). These data imply that senescence-inducing therapies can increase T cell infiltration and reactivity in previously immunologically “cold” tumors, thus sensitizing PDAC to immune checkpoint blockade.
DISCUSSION
The desmoplastic stroma of PDAC fosters a hypovascularized and immune suppressive TME that impedes the penetration of small molecule drugs and stifles anti-tumor immunity, leading to de novo resistance to chemotherapy and immune checkpoint blockade (Brahmer et al., 2012; Carmichael et al., 1996; Olive et al., 2009; Royal et al., 2010). Here, we show how molecularly targeted therapies that drive PDAC cells into senescence can engage a tumor suppressive program that remodels the TME and creates therapeutic vulnerabilities, at least in part, through SASP-facilitated vascular remodeling. On one hand, this response increases blood vessel density and permeability, leading to enhanced uptake and activity of the chemotherapeutic drug gemcitabine; on the other, it facilitates the tumor infiltration of CD8+T cells that, although exhausted, can be reawakened by checkpoint blockade. As a consequence, the addition of gemcitabine or anti-PD-1 therapy to the T/P regimen produces tumor cell death and sustained tumor regressions in otherwise highly refractory PDAC models.
The impact of therapy-induced senescence on PDAC vasculature function was unexpected. While the SASP can alter endothelial cell behavior in culture and in xenograft models, the biological impact of pro-angiogenic SASP factors on the TME has been hypothesized to be pro-oncogenic (Ancrile et al., 2007; Coppé et al., 2006; Mikuła-Pietrasik et al., 2016; Oubaha et al., 2016). However, in PDAC, these SASP factors produce the opposite outcome, leading to improved access of small molecules and immune cells into the tumor that ultimately enables its destruction. Mechanistically, SASP-facilitated vascular remodeling involves collaboration between pro-angiogenic (e.g., VEGF) and pro-inflammatory (e.g., CCL5, CXCL-1, and IL-6) SASP components, leading to increased blood vessel density and endothelial cell activation, respectively. While stromal sources of angiogenic or inflammatory cytokines may potentiate its effects, our results demonstrate that SASP secretion from tumor cells is essential for the observed phenotypes.
Neo-angiogenesis is typically considered a prerequisite for cancer progression and, as such, therapies that inhibit this process have been a focus of drug development efforts (Hanahan and Weinberg, 2000; Jain et al., 2006; Zirlik and Duyster, 2018). By contrast, owing to the hypovascularity of PDAC, studies suggest that therapies that improve, rather than inhibit, vascular function might establish therapeutic windows for treating this disease (Olive et al., 2009; Provenzano et al., 2012). One such approach involves disrupting stromal hedgehog signaling, which leads to increased vascular perfusion and drug accessibility by inhibiting myofibroblast activity (Olive et al., 2009). Yet, over time, depletion of key tumor suppressive stromal elements with this method culminates in tumor cell dedifferentiation and a more aggressive and metastatic disease (Rhim et al., 2014; Rosow et al., 2012). By contrast, the manner in which therapy-induced senescence increases tumor perfusion is distinct, producing a more functional vasculature without compromising tumor suppressive stromal components or promoting metastasis. Additionally, T/P-induced reduction in stromal HA content may relieve interstitial fluid pressures and contribute to enhanced vascular perfusion in our models (Provenzano et al., 2012).
Despite its limited activity, gemcitabine is part of the standard-of-care therapy for pancreatic cancer patients. While combinatorial approaches using gemcitabine are in pre-clinical and clinical use, the notion of combining cytostatic therapies with gemcitabine would not typically be pursued owing to the apparent requirement for DNA synthesis for gemcitabine-mediated toxicity (Plunkett et al., 1995). Yet, our data demonstrate that T/P therapy facilitates both gemcitabine uptake and its ability to promote tumor cell apoptosis, similar to what occurs following treatment with other agents that increase vascular perfusion in PDAC (Olive et al., 2009; Provenzano et al., 2012). We suspect that the efficacy of this three-drug combination is not a result of tumor-cell specific synergies, but instead arises from the improved ability of gemcitabine to target tumor cells that fail to senesce upon T/P treatment. Still, it remains possible that genomic instability resulting from senescence induction (Kotsantis et al., 2018; Woo and Poon, 2004), perhaps exacerbated by a defective p53-dependent G1 checkpoint, might also enhance gemcitabine cytotoxicity.
In addition to promoting uptake of soluble factors, SASP-facilitated vascular remodeling enables T cell penetration into PDAC and improves the efficacy of checkpoint blockade. Here, one critical outcome of SASP induction is increased endothelial cell expression of VCAM-1, a cell surface protein that stimulates lymphocyte adhesion and extravasation into tissues. Indeed, VCAM-1 is required for T cell infiltration and potentiation of PD-1 blockade following T/P therapy in our PDAC models. Collectively, these observations provide a compelling link between therapy-induced SASP, vascular remodeling, and immune cell infiltration, and add to a growing body of evidence that vascular normalization can enhance the efficacy of other T cell-directed immunotherapies (Buckanovich et al., 2008; Hamzah et al., 2008; Huang et al., 2012; Shrimali et al., 2010).
Previous work has established that targeted therapies, including CDK4/6 inhibitors, can cooperate with PD-1/PD-L1 blockade in other cancers (Deng et al., 2018; Ebert et al., 2016; Goel et al., 2017; Schaer et al., 2018). However, in contrast to our work, these studies employed immunologically “hot” and T cell “rich” cancer models that are typically responsive to checkpoint blockade. Moreover, focus of previous work has been on how these agents might increase T cell recognition or cytotoxicity rather than how T cells gain access to the tumor. Our study uses immunologically “cold” models of PDAC, a disease unresponsive to checkpoint blockade, to establish a mechanism for the latter effect, showing how T/P-induced senescence leads to endothelial activation and VCAM-1 upregulation that promotes T cell extravasation into tumors and sets the stage for efficient immunotherapy responses. Tumor cell autonomous effects may also play a role in stimulating T cell reactivity, and it is noteworthy that MHC-I upregulation following T/P treatment of PDAC cells is much greater than that produced by either agent alone.
The effects of the SASP on the TME can be context-dependent. Thus, while the most prominent effects of T/P therapy in PDAC are SASP-dependent vascular remodeling and T cell surveillance, the outcome of T/P-induced senescence in lung cancer models involves a SASP-facilitated NK cell surveillance program (Ruscetti et al., 2018). This tissue specificity cannot be explained by differences in tumor genotype (both studies used models driven by mutant KRAS and p53 alterations) or in VEGF secretion (that was induced in pancreas and lung cancer models). Instead, we hypothesize that these contextual differences arise from the tissue architecture of tumors arising in each organ: the lungs are generally NK cell-rich and lung tumors are highly vascularized; by contrast, the pancreas harbors few NK cells and PDAC tumors are avascular (Salmon et al., 2019). As such, each TME may be more or less susceptible to different SASP components. Regardless, in both models, pharmacological induction of senescence can evoke latent anti-tumor immunity.
We suspect the profound tissue remodeling observed following therapy-induced senescence reflects the reengagement of an innate tumor suppressive mechanism that participates in tissue regeneration. Numerous studies suggest that senescence coordinates tissue remodeling activities associated with wound repair and resolution that are critical for organ homeostasis (Demaria et al., 2014; Krizhanovsky et al., 2008; Lujambio et al., 2013; Mosteiro et al., 2016; Neves et al., 2015). In the presence of chronic tissue damage, hyperactivation of this wound-healing response without senescent cell clearance can be deleterious and even pro-oncogenic (Baker et al., 2016; Demaria et al., 2017; Schafer et al., 2017). However, when acutely activated in tumor cells, the senescence program recapitulates many aspects of this native wound resolution response, halting further tumor cell proliferation while simultaneously modulating multiple components of the tissue environment to promote homeostasis. As such, senescence induction may prove more effective at remodeling the TME than targeting individual tissue components. It will be interesting to compare and contrast the immune-enhancing effects of senescence-inducing therapies to agents that target specific immune suppressive factors in PDAC (Feig et al., 2013; Jiang et al., 2016; Panni et al., 2019).
Our data provide a clear rationale for combining senescence-inducing therapies with both chemotherapy and immunotherapy to cull heterogeneous tumor cell populations in PDAC and perhaps other cancers as well. Although well-tolerated in our mouse models, the potential toxicities of the three drug combinations (trametinib and palbociclib together with either gemcitabine or anti-PD-1) will need to be closely monitored when extending these preclinical findings to human clinical trials. In principle, the stability of the senescence phenotype following T/P treatment may enable treatment regimens where these agents can be given sequentially on alternating schedules instead of simultaneously and continuously. It is noteworthy that treatment of BRAF mutant melanoma patients with a combination of MEK and BRAF inhibitors together with PD-1 blockade is highly efficacious and can be tolerated using an appropriate regimen (Ribas et al., 2019). While the MEK and CDK4/6 inhibitor combination studied herein is a potent inducer of senescence in KRAS mutant cancers, other targeted and cytotoxic agents can also promote tumor cell senescence across a spectrum of cancer lineages and genotypic contexts (Ewald et al., 2010; Sieben et al., 2018). Consequently, our study provides one paradigm for combining such agents with immunomodulatory therapies to improve therapeutic outcomes.
STAR★METHODS
LEAD CONTACT AND MATERIALS AVAILABILITY
Further information and requests for resources and reagents should be directed to and will be fulfilled by the Lead Contact, Scott W. Lowe (lowes@mskcc.org).
All unique/stable reagents generated in this study are available from the Lead Contact with a completed Materials Transfer Agreement.
EXPERIMENTAL MODEL AND SUBJECT DETAILS
Cell and organoid culture and derivation
PANC-1 (human, male), PU-8988T (human, female), MiaPaca-2 (human, male), and 3B11 (murine, male) cells were purchased from the American Type Culture Collection (ATCC) or DSMZ. Murine KPCmut PDAC cell lines and organoids (male) were generated from PDAC arising in aged Pdx1-Cre;KrasLSL-G12D/+;Trp53R172H/wt (KPCmut) mice. Cells were grown in “complete DMEM” containing 10% FBS and 100 IU/ml penicillin/streptomycin (P/S). Cells and organoids were maintained in a humidified incubator at 37°C with 5% CO2. Only cell lines were used for in vitro studies. All cells and organoids used were negative for mycoplasma. All human cell lines were authenticated by their source repository.
To generate KPCmut PDAC cell lines, tumors arising in Pdx1-Cre; LSL-KrasG12D/+; LSL-p53R172H/wt (KPCmut) mice were minced with scissors and the dissociated in 1 mg/ml Collagenase type V (C9263; Sigma) and 2U/ml Dispase II (04942078001; Roche) diluted in Hanks Buffered Saline Solution (HBSS) (14025-076; Life technologies) at 37° C with mild agitation for up to 1 hour. The cell suspension was then plated on 10 cm2 culture dishes coated with 100 μg/ml collagen (PureCol) (5005; Advanced Biomatrix) and grown in complete DMEM. Primary cultures were passaged at least 3 times to remove fibroblast contamination. KPCmut PDAC cells were then transduced with a Luciferase (Luc)-GFP co-expression vector to visualize them in vivo. Luc-GFP constructs were cloned into MSCV-based vectors and retroviruses were packaged by co-transfection of Gag-Pol expressing 293 T cells with expression constructs and envelope vectors (VSV-G) using the calcium phosphate method. Following transduction, cells were purified by FACS sorting the GFP+ population on a FACSAria (BD Biosciences).
KPCmut PDAC organoids were generated by mincing and dissociating tumors arising in Pdx1-Cre; LSL-KrasG12D/+; LSL-p53R172H/wt (KPCmut) mice with collagenase and dispase as described above. Unfiltered, dissociated tissue was then seeded in growth factor-reduced (GFR) Matrigel (BD) and cultured in advanced DMEM/F12 supplemented with the following: 1% P/S, 2mM glutamine, 1X B27 supplement (12634-028; Invitrogen), 50ng/ml hEGF (PMG8043; Peprotech), 100ng/ml mNoggin (250-38; Peprotech), 100ng/ml hFGF10 (100-26; Peprotech), 10 nM hLeu-Gastrin I (G9145, Sigma), 1.25mM N-acetylcysteine (A9165; Sigma), 10mM Nicotinamide (N0636; Sigma), and R-spondin1 conditioned media (10% final). Organoids were passaged every 3-4 days.
Primary murine pancreatic fibroblasts from C57BL/6 mice were purchased from Cell Biologics, Inc. and grown in complete fibroblast media (M2267). To generate primary bone marrow-derived macrophages (BMDMs), bone marrow was flushed from the hind limbs of 9 week old female C57BL/6 mice under sterile conditions, passed through a 40 μm strainer and cultured in 30 mL Teflon Bags (PL-30; PermaLife) in DMEM supplemented with 10% FBS and 10 ng/ml of recombinant mouse CSF1 (R&D systems). Bone marrow cells were cultured for 7 days, refreshing CSF1-containing media every other day, after which they were referred to as BMDMs.
Animal Studies
All mouse experiments were approved by the Memorial Sloan Kettering Cancer Center (MSKCC) Internal Animal Care and Use Committee under MSKCC IACUC protocol 11-06-018. Mice were maintained under specific pathogen-free conditions, and food and water were provided ad libitum.
KPCflox PDAC GEMM
Trp53fl/fl, LSL-KrasG12D/+, and Pdx1-Cre strains on a C57BL/6 background were interbred to obtain Pdx1-Cre; LSL-KrasG12D/+; Trp53fl/wt (KPCflox) mice. Both male and female KPCflox mice ranging from 2.5 to 12 months of age were used for treatment studies upon confirmation of tumor development. Mice were monitored for tumor development by ultrasound, and enrolled and randomized into treatment groups once tumors reached 100-300 mm3. Ultrasound imaging was repeated every 2 weeks during treatment to assess changes in pancreas tumor burden. For immunohistochemical and flow cytometry analysis, mice were treated for 2 weeks with indicated drugs. Upon sacrifice pancreas tumor tissue was allocated for 10% formalin fixation, OCT frozen blocks, and snap frozen tissue, and the rest used to generate single cell suspensions for flow cytometry analysis.
KPCmut PDAC organoid transplant model
For orthotopic engraftment of KPCmut PDAC organoids derived from Pdx1-Cre; LSL-KRASG12D/+; Trp53R172H/wt (KPCmut) tumors, 8-10 week old C57BL/6 or NOD-scid IL2Rγnull (NSG) female mice (Jackson Laboratory) were first anesthetized using isoflurane and an incision was made in the left abdominal side. Organoids (approximately 1-3x10⁵ cells/mouse) were prepared from cultures. Organoid cultures were dissociated with TrypLE (ThermoFisher; 12604-021) and finally resuspended in 25 μL of growth factor reduced Matrigel (354230; Corning) diluted 1:1 with cold adDMEM F/12 media supplemented with 2mM glutamine. The organoid suspension was injected into the tail region of the pancreas using a Hamilton Syringe. Successful injection was verified by the appearance of a fluid bubble without signs of intraperitoneal leakage. The abdominal wall was sutured with absorbable Vicryl sutures (Ethicon), and the skin was closed with wound clips (CellPoint Scientific Inc.). Mice were monitored for tumor development by ultrasound (anywhere from 1.5-6 months post-transplantation), and enrolled and randomized into treatment groups once tumors reached 100-300 mm3. Ultrasound imaging was repeated every 2 weeks during treatment to assess changes in pancreas tumor burden. For immunohistochemical and flow cytometry analysis, mice were treated for 2 weeks with indicated drugs. Upon sacrifice pancreas tumor tissue was allocated for 10% formalin fixation, OCT frozen blocks, and snap frozen tissue, and the rest used to generate single cell suspensions for flow cytometry analysis.
KPCmut PDAC cell line transplant model
To rapidly generate orthotopic PDAC tumors in immunocompetent mice for immunophenotyping experiments, 5x10⁴ KPCmut PDAC cells expressing luciferase and GFP (LUC-GFP) were orthotopically transplanted into the pancreas of 8-10 week old C57BL/6 female mice as described above. Mice were monitored for tumor development (5-8 days post-transplantation) by bioluminescence imaging (BLI) on a Xenogen IVIS Spectrum imager (PerkinElmer) before being randomized into various study cohorts. For immunohistochemical and flow cytometry analysis, mice were treated for 2 weeks with indicated drugs. Upon sacrifice pancreas tumor tissue was allocated for 10% formalin fixation, OCT frozen blocks, snap frozen tissue, and the rest for flow cytometric analysis.
Patient-Derived Xenograft (PDX) models
5-7 week old female NOD-scid IL2Rγnull (NSG) mice were used for animal experiments with patient-derived xenografts (PDXs). PDAC PDXs used for preclinical studies were selected based upon presence of a robust stromal compartment and resistance to gemcitabine chemotherapy. MSK-PR07 is a PDAC PDX harboring mutations in KRAS (G12D) and p53 (L344Q) and derived from a patient treated with three rounds of chemotherapy: 1) gemcitabine and cisplatin, 2) FOLFIRINOX, and 3) gemcitabine and abraxane. MSK-PR05 is a PDAC PDX derived from a patient previously treated with gemcitabine, abraxane, and the HA degrading agent PEGPH20. Tumors were cut into pieces and inserted into a pocket in the subcutaneous space as previously described (Poirier et al., 2015). Following inoculation, mice were monitored daily, weighed twice weekly, and caliper measurements begun when tumors became visible. Tumor volume was calculated using the following formula: tumor volume = (D x d2)/2, in which D and d refer to the long and short tumor diameter, respectively. When tumors reached a size of 100-200 mm3, mice were randomized based on starting tumor volume (caliper measurements) and enrolled into treatment groups. Tumor size and mouse weights were recorded twice weekly. Experimental endpoints were achieved when tumors reached 2000 mm3 or became ulcerated.
METHOD DETAILS
Compounds
Trametinib (S2673) and palbociclib (S1116) were purchased from Selleck chemicals for in vitro studies. Drugs for in vitro studies were dissolved in DMSO (vehicle) to yield 10 mM stock solutions and stored at −80°C. For in vitro studies, growth media with or without drugs was changed every 2-3 days. For in vivo studies, trametinib (T-8123) and palbociclib (P-7744) were purchased from LC Laboratories. Trametinib was dissolved in a 5% hydroxypropyl methylcellulose and 2% Tween-80 solution (Sigma), and palbociclib in sodium lactate buffer (pH 4). Gemcitabine was purchased from the MSKCC pharmacy and diluted accordingly in saline.
Short-hairpin RNA (shRNA) knockdown
MiR30-based shRNAs targeting p65 and Renilla (as a control) were cloned into the XhoI EcoRI locus of the MSCV-based LMP vector (Chicas et al., 2010; Chien et al., 2011). Retroviruses were packaged by co-transfection of Gag-Pol expressing 293 T cells with expression constructs and envelope vectors (VSV-G) using the calcium phosphate method, and virus containing media applied to target KPCmut cells. Infected cells were selected with 1 μg/ml puromycin for 5 days. Knockdown was confirmed by qRT-PCR and immunohistochemistry (following transplantation into C57BL/6 mice).
Forp65 knockdown studies in KPCmut organoids, virus containing media was collected in AdDMEM supplemented with 1X P/S and 2mM glutamine and mixed 1:1 with full organoid media. Organoids were treated with virus overnight twice and subsequently selected for 1 week with 1 μg/ml puromycin. Knockdown was confirmed by immuhistochemistry following transplantation into C57BL/6 mice.
Preclinical drug studies
Mice were treated with vehicle, trametinib (1 mg/kg or 0.3 mg/kg body weight), and/or palbociclib (100 mg/kg body weight) per os for 4 consecutive days followed by 3 days off treatment. Gemcitabine (100 mg/kg body weight) was administered twice per week, or an α-PD-1 antibody (200 μg; RMP1-14, BioXcell) was given 3 times per week by intraperitoneal (IP) injection alone or in combination with trametinib and palbociclib treatment concurrently. Gemcitabine was also given on an alternating treatment schedule with T/P, where T/P was given on 4 consecutive days followed by 3 days off treatment for 1 week, followed by gemcitabine administration twice a week for 1 week. For PDX models propogated in NSG mice, gemcitabine was administered once per week. No obvious toxicities were observed in the vehicle- or drug-treated animals as assessed by changes in body weight (taking tumor size into account).
Neutralizing antibody studies
High doses of an α-VEGFR-2 blocking antibody (800 μg; DC101, BioXcell) were administered twice per week by IP injection to block neo-vascularization. For NKcell depletion, mice were injected IP with an α-NK1.1 antibody (250 μg; PK136, BioXcell) twice per week. For T cell depletion, mice were injected IP with either an a-CD4 (200 μg; GK1.5, BioXcell) or α-CD8 antibody (200 μg; 2.43, BioXcell) twice per week. Depletion of NK, CD4+, and CD8+ T cells was confirmed by flow cytometric and immunohistochemical analysis of pancreas tumor tissue. For neutralization of cell surface molecules that mediate immune-endothelial interactions, mice were injected IP with either an α-VCAM-1 (200 μg; M/K-2.7, BioXcell), α-PSGL-1 (50 μg; 4RA10, BioXcell), or α-ICAM-1 antibody (200 μg; YN1/1.7.4, BioXcell) twice per week. For neutralization of SASP factors, mice were injected IP with either an α-VEGFR2 (800 μg; DC101, BioXcell), α-IL-6 (200 μg; MP5-20F3, BioXcell), α-TGF-β (300 μg; 1D11.16.8, BioXcell), α-IL-1β (200 μg; B122, BioXcell), CCL-5 (50 μg; 53405, R&D systems), or CXCL-1 antibody (25 μg, 48415, R&D systems) twice per week.
Ultrasound Imaging
High-contrast ultrasound imaging was performed on a Vevo 2100 System with a MS250 13- to 24-MHz scanhead (VisualSonics) to stage and quantify pancreas tumor burden. Tumor volume was analyzed using Vevo LAB software.
Bioluminescence imaging
Bioluminescence imaging (BLI) was used to track luciferase expression in orthotopically transplanted KPCmut PDAC tumor cells expressing a LUC-GFP reporter. Mice were injected IP with luciferin (5 mg/mouse; Gold Technologies) and then imaged on a Xenogen IVIS Spectrum imager (PerkinElmer) 10-15 minutes later for 60 s. Quantification of luciferase signaling was analyzed using Living Image software (Caliper Life Sciences).
Tumor perfusion, permeability, and drug uptake assays
PDAC-bearing KPCmut organoid transplant and KPCflox GEMM mice were pretreated for 2 weeks with vehicle or combined trametinib (1 mg/kg body weight) and palbociclib (100 mg/kg body weight) per os for 4 consecutive days followed by 3 days off treatment. To assess vascular permeability following treatment, 1 mg of FITC-dextran (MW 2,000,000; Sigma-Aldrich) was administered intravenously in the lateral tail vein 30 minutes before sacrifice. Similarly, to measure vascular perfusion/patency, 100 μg of biotinylated tomato lectin (B1175; Vector Laboratories) was injected intravenously 1 hour before sacrifice. To assess hypoxia in PDAC tissue, 60 mg/kg hydoxyprobe (Hypoxyprobe; HP1-100 kit) was administered by IP injection 30 minutes prior to euthanasia.
To assess gemcitabine uptake into pancreas tumors, 14C-gemcitabine (specific activity 58.8 mCi/mmol; Moravek Biochemicals) was administered in sterile saline by IP injection at 2 μCi/animal. Animals were euthanized 2 hours after 14C-gemcitabine administration, and tumor tissue, as well as tissue from normal pancreas and other organs were collected for downstream analysis. Tumors were divided for scintillation counting and autoradiography. Fragments of tumor (approximately 100 mg) were weighed and dissolved in Solvable™ (Perkin Elmer, Waltham MA), followed by 100 mL hydrogen peroxide, and counted in 7 mL Ultima Gold™ (Perkin Elmer). Activity was expressed as disintegrations per minute (dpm)/milligram. Autoradiographs were obtained from flash-frozen tumor cryosections, exposed to GE storage phosphor screens for 7 days and read with the Typhoon FLA 7000 laser scanner (GE Healthcare Life Sciences, Pittsburgh, PA). Before exposure, slides were marked with nail polish containing a blue dye and 14C to permit registration of autoradiographic and microscopic images.
Flow cytometry
For in vivo sample preparation, tumors were isolated following removal of the spleen and normal pancreas tissue, and allocated for 10% formalin fixation, OCT frozen blocks, snap frozen tissue, and flow cytometry analysis following 2-week treatment. To prepare single cell suspensions for flow cytometry analysis, tumors were minced with scissors into small pieces and placed in 5ml of collagenase buffer (1x HBSS w/calcium and magnesium (GIBCO), 1 mg/ml Collagenase V (C9263; Sigma), and 0.1 mg/ml DNase I (DN25; Sigma)). Samples were then transferred to C tubes and processed using program 37C_m_TDK1_1 on a gentleMACS Octo dissociator with heaters (Miltenyi Biotec). Dissociated tissue was passaged through a 70 μm cell strainer and centrifuged at 1500 rpm x 5 minutes. Red blood cells were lysed with ACK lysis buffer (Quality Biological) for 5 minutes, and samples were centrifuged and resuspended in PBS supplemented with 2% FBS. Samples were blocked with anti-CD16/32 (FC block, BD Pharmigen) for 20 minutes and then incubated with the following antibodies for 30 minutes on ice: CD45 (30-F11), NK1.1 (PK136), CD3 (17A2), CD8 (53-6.7), CD4 (GK1.5), Gr-1 (RB6-8C5), PD-L1 (CD274;10F.9G2), CD31 (390), VCAM-1 (CD106;MVCAM.A), P-selectin (CD62P; RMP-1), CD69 (H1.2F3), CTLA-4 (CD152; UC10-4B9), 2B4 (CD244.2; m2B4 (B6)458.1), VLA-4 (CD49d; R1-2), F4/80 (BM8), PD-1 (CD279; RMP1-30), CD44 (IM7), CD86 (GL-1), CD206 (MMR), Ly6G (1A8) (Biolegend); CD11b (M1/70) (BD Biosciences); MHC-I (H-2kb; AF6-88.5.5.3), LAG-3 (eBioC9B7W) (eBioscience); and ICAM-1 (AB796) (R&D Systems). DAPI was used to distinguish live/dead cells, and tumor cells were gated as GFP+ in the KPCmut PDAC cell line transplant model where tumor cells harbor a LUC-GFP construct. Flow cytometry was performed on an LSRFortessa, and data were analyzed using FlowJo (TreeStar).
In vivo degranulation assay
Mice were injected intravenously with 250 μL of a solution containing 25 μg anti-CD107a PE (ID4B, Biolegend) in 1X PBS 3 hours before mice were euthanized. Pancreas tumor tissue was then isolated, dissociated, stained with cell surface antibodies, and analyzed by flow cytometry as described above.
Immunohistochemistry and immunofluorescence
Tissues were fixed overnight in 10% formalin, embedded in paraffin, and cut into 5 mm sections. Haematoxylin and eosin (H&E) and Masson’s trichrome staining were performed using standard protocols. For frozen sections, pancreata were directly embedded in OCT (VWR Chemicals, 361603E) and frozen on dry ice. For immunohistochemical and immunofluorescence analysis, sections were de-paraffinized, rehydrated, and boiled in a microwave for 15 minutes in 10 mM citrate buffer (pH 6.0) for antigen retrieval. Antibodies were incubated overnight at 4°C.
The following primary antibodies were used: pERKT202/Y204 (43 70), cleaved caspase-3 (CC3) (9664), PDGFRb (3169), NF-κB (p65;8242) (Cell Signaling); Ki67 (AB16667), CD31 (AB28364), α-smooth muscle actin (αSMA;AB5694), CD3 (AB5690), granzyme B (AB4059), LYVE1 (AB14917) (Abcam); pRBS807/S811 (Sc-16670) (Santa Cruz); NKp46 (AF2225), VCAM-1 (AF643), ICAM-1 (AF796) (R&D Systems); FOXP3 (14-5773-82), CD8 (14-0808-82) (eBioscience); mouse pan-endothelial cell antigen (MECA-32) (University of Iowa); P-selectin (LS-B3578) (LSBio); FAP (ABT11) (Millipore); CD31 (DIA-310) (Dianova); biotinylated hyaluronic acid binding protein (HABP) (AMS.HKD-BC41; AMSBIO); and cytokeratin 19 (CK19; TROMA-III) (DSHB).
HRP-conjugated secondary antibodies (Vectastain Elite ABC HRP Kits) were applied for 30 minutes and visualized with DAB (Vector Laboratories; SK-4100), or secondary Alexa Fluor 488 or 594 dye-conjugated antibodies (Life Technologies) applied for 1 hour at room temperature. Fluorescence antibody-labeled slides were mounted with Prolong Gold Antifade mountant (Prolong Molecular Probes; P36934) after counterstaining with DAPI.
Analysis of protein adducts of reductively activated pimonidazole were identified through immunohistochemistry in fixed tissues with a monoclonal antibody against hypoxyprobe-1 according to the manufacturer’s protocol (Hypoxyprobe; HP1-100 kit). To assess lectin perfusion, PDAC tissue sections isolated from mice injected with biotinylated tomato lectin (B1175; Vector Laboratories) were stained with a fluorescein-conjugated streptavidin (SA-5001: Vector Laboratories) for 30 minutes and processed as described above.
SA-β-gal staining
SA-β-gal staining was performed at pH 6.0 for human cells and 5.5 for mouse cells and tissue. Fresh frozen sections of pancreas tumor tissue, or adherent cells plated in 6-well plates and treated for 8 days in culture with vehicle (DMSO), trametinib (25nM), and/or palbociclib (500nM), were fixed with 0.5% Gluteraldehyde in PBS for 15 min, washed with PBS supplemented with 1mM MgCl2, and stained for 5–8 hours in PBS containing 1 mM MgCl2, 1mg/ml X-Gal, and 5 mM each of Potassium ferricyanide and Potassium ferrocyanide. Tissue sections were counterstained with eosin. 5 high power fields per well/section were counted and averaged.
Conditioned Media collection
PDAC cells were plated in 6-well plates and treated for 6 days in the presence or absence of trametinib (25nM) and/or palbociclib (500nM). On day 6, 2 mL of serum-free or complete DMEM was added to each well and cells were incubated an additional 48 hours in the presence or absence of drugs. Conditioned media was then collected and the cells were trypsinized and counted using a cellometer (Nexcelom Biosciences). After normalizing the concentration of the conditioned media by the cell count, conditioned media from vehicle- or T/P-pretreated KPCmut PDAC tumor cells was then applied to endothelial cells, fibroblasts, and bone marrow-derived macrophages to assess changes in growth, or used for downstream cytokine array analysis.
Cytokine array
Conditioned media samples (collected in complete DMEM) from treated PDAC cell lines or primary pancreatic murine fibroblasts (plated in triplicate) were normalized based on cell number by diluting with complete DMEM. Aliquots (50 μl) of the conditioned media were analyzed using multiplex immunoassays designed for human (Human Cytokine/Chemokine Array 42-Plex Discovery Assay) or mouse (Mouse Cytokine/Chemokine Array 31-Plex or MMP Discovery Array 5-Plex Discovery Assay) from Eve Technologies. Biological replicates were averaged to determine cytokine levels. Heatmaps display relative cytokine expression values normalized to vehicle-treated samples.
In vitro cell growth assays
KPCmut tumor cells were treated with vehicle or combined trametinib (25nM) and palbociclib (500nM) for 6 days, and conditioned serum-free DMEM was collected as described above. Filtered conditioned media (CM) or basal serum-free media was then applied to various primary and established cell lines. To measure endothelial cell and fibroblast growth, 5,000 3B11 murine endothelial cells and 10,000 primary murine pancreatic fibroblasts were plated in 24-well dishes. Cells were counted daily in quadruplicate using a Guava Easycyte (Millipore) and media changed every 3 days. To analyze the impact on macrophage growth, 10,000 bone marrow-derived macrophages (BMDMs) were plated in 96 well dishes and, one day thereafter, were exposed to CM or basal serum-free media diluted 1:2 in DMEM containing 10% FBS and 10 ng/mL Csf1. Cell viability was assessed using the CellTiter-Glo Viability Assay (Promega) according to the manufacturer’s protocol.
In vitro endothelial tube formation assay
3B11 endothelial cells were plated in 48 well dishes coated with a 150 μL layer of Cultrex reduced growth factor basement membrane extract (3533-005-02; R&D Systems) and cultured in basal or serum-free conditioned DMEM media for 8 hours. Images of tube structures were captured on a INCell 6000 high-content imager (GE Healthcare Life Sciences) at 10x magnification.
T cell functionality assays
Spleens were harvested from female OT-1 mice (Jackson laboratory), mechanically disrupted by passing them through a 70 μm cell strainer, and centrifuged at 1500 rpm x 5 minutes. Red blood cells were lysed with ACK lysis buffer (Quality Biological) for 5 minutes. Total splenocytes or CD8+ T cells FACS sorted on a Sony MA900 were then activated with CD3/CD28 Dynabeads (one bead/T cell, Thermo Fisher) and cultured in presence of IL-2 (2 ng/ml; Biolegend), IL-7 (2.5 ng/ml; Peprotech) and IL-15 (50 ng/ml; Peprotech) in complete RPMI media supplemented with 10% FBS and 100 IU/ml penicillin/streptomycin for four to six days prior to co-culture assays with PDAC cells.
To generate KPCmut PDAC cells expressing chicken ovalbumin (KPCmut-OVA), KPCmut PDAC cells were transduced with a pCDH-derived lentiviral vector expressing amino acids 48-386 of the chicken ovalbumin protein under the control of a minimal CMV promoter and a blasticidin resistance cassette under the control of an EF1-α promoter. Lentiviruses were packaged by co-transfection of 293 T cells with the expression construct, envelope vector (VSV-G), and lenti Gag-Pol vector using the calcium phosphate method. Selection of OVA-expressing tumor cells was performed with blasticidin (10 μg/ml; Thermo Fisher) over 3 days.
For analysis of expression of cytokines and activation markers on CD8+ T cells, total splenocytes were co-cultured for 4 hours with KPCmut or KPCmut-OVA PDAC tumor cells (pretreated with vehicle or combined trametinib (25nM) and palbociclib (500nM) (T/P) for 8 days) at a 1:1 effector to target (E:T) ratio in complete RPMI. To functionally block MHC-I activity, T cells were also co-cultured with tumor cells in the presence of a H-2kb blocking antibody (40 μg/ml; Y-3, BioXcell). Asa positive control forT cell activation, cells were treated for 4 hours with PMA(20 ng/ml, sigma aldrich) and Ionomycin (1 μg/ml, stem cell technologies). Co-culture experiments were performed either in the absence (surface staining) or in the presence (intracellular cytokine staining) of GolgiStop (BD Biosciences). Cell surface staining was performed with CD8 (53-6.7), CD44 (IM7) and CD69 (H1.2F3) antibodies (Biolegend) for those cells that were not pretreated with GolgiStop. GolgiStop-pretreated cells were first stained with CD8 (53-6.7) antibody, then intracellular staining was performed using the Foxp3/transcription factor staining buffer set (eBioscience), where cells were fixed, permeabilized, and then stained with IFN-γ (XMG1.2; TONBO Biosciences) and TNF-α (MP6-XT22; eBiosciences) antibodies. Expression of cytokines and activation markers was evaluated by gating on CD8+ T cells. Flow cytometry was performed on an LSRFortessa, and data were analyzed using FlowJo (TreeStar).
To assess the functionality of PDAC-infiltrating lymphocytes ex vivo, PDAC tumors isolated from KPCmut organoid transplant mice treated for two weeks with vehicle, combined trametinib (1 mg/kg body weight) and palbociclib (100 mg/kg), and/or an α-PD-1 antibody (200 μg; RMP1-14, BioXcell) were dissociated into single cell suspensions, incubated for 4 hours with PMA (20 ng/ml, sigma aldrich) and Ionomycin (1 μg/ml, stem cell technologies), and stained with CD8, IFN-γ, and TNF-α antibodies for flow cytometry analysis as above.
qRT-PCR
For analysis of macrophage polarization following T/P treatment, total RNA was extracted from CD45+CD11b+Gr-1−F4/80+ macrophages (sorted on a FACSAria (BD Biosciences)) isolated from KPCmut transplant PDAC tumors treated for 2 weeks with vehicle or combined trametinib (1 mg/kg body weight) and palbociclib (100 mg/kg) using TRIzol RNA Isolation Reagents (Invitrogen). Total RNA was also extracted from indicated KPCmuU PDAC cell lines following 8 day treatment with vehicle or trametinib (25nM) and palbociclib (500nM) in culture using the RNeasy Mini Kit (QIAGEN). Complementary DNA (cDNA) was obtained using the TaqMan reverse transcription reagents (Applied Biosystems). Real-time PCR was performed in duplicate or triplicate using SYBR Green PCR Master Mix (Applied Biosystems) on the ViiA 7 Real-Time PCR System (Invitrogen). 36B4 served as an endogenous normalization control.
High throughput RNA-sequencing (RNA-seq) analysis
For RNA-seq analysis of the transcriptional profiles of tumor cells from KPCmut transplant PDAC tumors in mice treated for 2 weeks with vehicle or combined trametinib (1 mg/kg body weight) and palbociclib (100 mg/kg), total RNA was extracted from GFP+ tumor cells (sorted on a FACSAria (BD Biosciences)) using the RNeasy Mini Kit (QIAGEN). Purified polyA mRNA was subsequently fragmented, and first and second strand cDNA synthesis performed using standard Illumina mRNA TruSeq library preparation protocols. Double stranded cDNA was subsequently processed for TruSeq dual-index Illumina library generation. For sequencing, pooled multiplexed libraries were run on a HiSeq 2500 machine on RAPID mode. Approximately 10 million 76bp single-end reads were retrieved per replicate condition. Resulting RNA-Seq data was analyzed by removing adaptor sequences using Trimmomatic (Bolger et al., 2014), aligning sequencing data to GRCh37.75(hg19) with STAR (Dobin et al., 2013), and genome wide transcript counting using HTSeq (Anders et al., 2015) to generate a RPKM matrix of transcript counts. Genes were identified as differentially expressed using R package DESeq2 with a cutoff of absolute log2FoldChange ≥ 1 and adjusted p value < 0.05 between experimental conditions (Love et al., 2014). Functional enrichments of these differential expressed genes were performed with enrichment analysis tool Enrichr (Kuleshov et al., 2016) and the retrieved combined score (log(p value) * z-score) was displayed.
To assess expression of antigen presentation and processing genes in human PDAC cell lines treated with vehicle (DMSO), trametinib (25nM), and/or palbociclib (500nM) for 8 days in culture, we interrogated a previously published RNA-seq dataset from Ruscetti et al. (2018) (GEO: GSE110397). Heatmaps display the fold change in RPKM expression values normalized to vehicle-treated samples.
Clustering and Gene Set Enrichment Analysis (GSEA)
Principal component analysis was performed using the DESeq2 package in R. Gene expressions of RNA-Seq data were clustered using hierarchical clustering based on one minus pearson correlation test. For pathway enrichment analysis, the weighted GSEA Preranked mode was used on a set of curated signatures in the molecular signatures database (MSigDB v6.2) (https://www.broadinstitute.org/gsea/msigdb/index.jsp). From 17,810 signatures, signatures with 15-500 genes were only considered for the further analyses. From the results, enriched signatures with an adjusted p value less than 0.05 were considered as statistically significant.
Whole exome sequencing (WES)
WES was conducted on genomic DNA (gDNA) isolated from PDAC tumors harvested at survival endpoint from KPCmut organoid transplant and KPCflox GEMM mice. gDNA was also isolated from peripheral blood of a non-tumor bearing C57/BL6 mouse to generate a baseline reference sequence. gDNA was isolated using the DNeasy Blood &Tissue Kit (QIAGEN) and WES was conducted and sequenced by BGI. The data was then processed through the Illumina (HiSeq) Exome Variant Detection Pipeline for detecting variants by the Bioinformatics Core at MSKCC. First, the FASTQ files were processed to remove any adaptor sequences at the end of the reads using cutadapt (v1.6). The files were then mapped using the BWA mapper (bwa mem v0.7.12). After mapping the SAM files were sorted and read group tags added using the PICARD tools. After sorting in coordinate order the BAMs were processed with PICARD MarkDuplicates. The marked BAM files were then processed using the GATK toolkit (v3.2) according to the best practices for tumor normal pairs. They were first realigned using ABRA (v 0.92) and then the base quality values recalibrated with the BaseQRecalibrator. Somatic variants were then called in the processed BAMs using muTect (v1.1.7) for SNV and the Haplotype caller from GATK with a custom post-processing script to call somatic indels. Mutations that occurred more than once among all in vivo mouse PDAC tumor samples, but did not appear in vitro prior to transplantation, were removed. Based on the information provided by Agilent SureSelect XT Mouse All Exon Kit, the total exome coverage was about 49.6MB. This coverage length was used to calculate mutations per MB and compared with publicly available mutational data downloaded from (Alexandrov et al., 2013).
QUANTIFICATION AND STATISTICAL ANALYSIS
Histological and Image Analysis
To measure endothelial tube formation in vitro, four fields per well were analyzed and grouped by well using Cell Profiler. In order to outline the whole cell/tube profile, the image was first processed using the EnhanceEdges function, followed by Smooth filters. The subsequent image was then thresholded to produce an outline object for the tube formation within each field. This object mask was then transformed with the skeletonize mask function and measurements on this skeleton used to determine tube length.
Quantification of the number of CD31+ blood vessels (mean vessel density), SA-β-gal+ senescent cells, Ki67+ proliferating cells, CC3+ dead/dying cells, CD3+ and CD8+ T cells, and other immune and stromal cell types was performed on 5 high power 20x fields per section that were counted and averaged. The distance between blood vessels and tumor cells was determined for 20 randomly chosen blood vessels, and the distance to the four nearest tumors cells was measured and averaged using ImageJ software. Assessment of stromal reactivity was performed by scoring the number and intensity of the pixels by color deconvolution using Aperio software (IHC score) on trichrome, αSMA, and HA-stained sections.
Metastatic burden in the lungs and liver, as well as necrotic areas in primary PDAC lesions, were quantified from low magnification (1x) H&E-stained whole tissue sections. Tumor necrosis was assessed by the percentage of total tumor area covered in necrotic tissue on H&E-stained sections using ImageJ software.
To quantify colocalization of various markers with blood vessels, slides were first scanned with Pannoramic 250 Flash scanner (3DHistech, Hungary) using 20x/0.8NA objective lens. Regions of interest around the tissues were then drawn and exported as .tif files from these scans using Caseviewer (3DHistech, Hungary.) These images were then analyzed using ImageJ/FIJI (NIH, USA) where a median filter, thresholding, and watershedding were used to segment the nuclei in the DAPI channel. These segmented nuclei were then used to determine percent overlap between the different combinations of markers with their respective thresholds in order to quantify colocalization.
To assess lectin perfusion, PDAC tissue sections were co-stained with CD31, and the percentage of lectin+ blood vessels was quantified. Hypoxia was assessed as the percentage of tumor tissue containing activated pimonidazole using ImageJ software. Vascular permeability was assessed by percentage of total tumor area that was FITC-dextran positive on fresh frozen sections.
Statistical analysis
Statistical significance between groups was calculated by two-tailed Student’s t test unless specified otherwise in the figure legend. Data are expressed as mean ± SEM. Group size was determined on the basis of the results of preliminary experiments and no statistical method was used to predetermine sample size. The indicated sample size (n) represents biological replicates. Group allocation and outcome assessment were not performed in a blinded manner. All samples that met proper experimental conditions were included in the analysis. Survival was measured using the Kaplan-Meier method. Statistical significance was determined by one- and two-way ANOVA, Student’s t test, and log-rank test using Prism 6 software (GraphPad Software) as indicated. Significance was set at p < 0.05.
DATA AND CODE AVAILABILITY
The accession number for the RNA-seq data reported in this paper is GEO: GSE141684. The access number for the whole exome sequencing data reported in this paper is NCBI BioProject: PRJNA607826.
Supplementary Material
KEY RESOURCES TABLE
| REAGENT or RESOURCE | SOURCE | IDENTIFIER |
|---|---|---|
| Antibodies | ||
| See Table S1 for Antibody information | N/A | N/A |
| Biological Samples | ||
| Pancreatic cancer PDX: MSK-PR07 | MSKCC/This paper | N/A |
| Pancreatic cancer PDX: MSK-PR05 | MSKCC/This paper | N/A |
| Chemicals, Peptides, and Recombinant Proteins | ||
| Trametinib (in vitro) | Selleck chemicals | Cat#S2673 |
| Palbociclib (in vitro) | Selleck chemicals | Cat#S1116 |
| Trametinib (in vivo) | LC Laboratories | Cat#T-8123 |
| Palbociclib (in vivo) | LC Laboratories | Cat#P-7744 |
| Gemcitabine | MSKCC Pharmacy | Cas#:122111-03-9 |
| 14C-Gemcitabine | Moravek Biochemicals | Cat#MC 2246 |
| Recombinant mouse IL-2 | Biolegend | Cat#575402 |
| Recombinant human IL-7 | Peprotech | Cat#200-07 |
| Recombinant human IL-15 | Peprotech | Cat#200-15 |
| Matrigel | Corning | Cat#354230 |
| Solvable | Perkin Elmer | Cat#6NE9100 |
| Ultima Gold | Perkin Elmer | Cat#6013321 |
| Collagenase type V | Sigma | Cat#C9263 |
| Culturex reduced growth factor basement membrane extract | R&D systems | Cat#3533-005-02 |
| B27 supplement | Invitrogen | Cat#12634-028 |
| hEGF | Peprotech | Cat#PMG8034 |
| mNoggin | Peprotech | Cat#250-38 |
| hFGF10 | Peprotech | Cat#100-26 |
| hLeu-Gastrin I | Sigma | Cat#G9145 |
| N-acetylcysteine | Sigma | Cat#A9165 |
| Nicotinamide | Sigma | Cat#N0636 |
| Dynabeads Mouse T-Activator CD3/CD28 | Thermo Fisher Scientific | Cat#11452D |
| PMA | Sigma | Cat#P8139 |
| Ionomycin | Stem cell technologies | Cat#73724 |
| GolgiStop | BD bioscience | Cat#554724 |
| Trizol | Invitrogen | Cat#15596026 |
| Biotinylated tomato lectin | Vector Laboratories | Cat#B1175 |
| FITC-dextran (MW 2,000,000) | Sigma-Aldrich | Cat#52471 |
| Pimonidazole | Hypoxyprobe | Cat#HP1-1000Kit |
| Critical Commercial Assays | ||
| Human Cytokine/Chemokine Array 42-Plex Discovery Assay | Eve Technologies | Cat#HD42 |
| Mouse Cytokine/Chemokine Array 31-Plex | Eve Technologies | Cat#MD31 |
| CellTiter-Glo Viability Assay | Promega | Cat#G924A |
| eBioscience Foxp3 / Transcription Factor Staining Buffer Set | eBioscience | Cat#00-5523-00 |
| TaqMan reverse transcription reagent | Thermo Fisher | Cat#N8080234 |
| SYBR Green PCR master Mix | Thermo Fisher | Cat#4309155 |
| Deposited Data | ||
| RNA sequencing data | This paper | GEO: GSE141684 |
| RNA sequencing data | Ruscetti et al., 2018 | GEO: GSE110397 |
| Mouse whole exome sequencing | This paper | NCBI BioProject: PRJNA607826 |
| Experimental Models: Cell Lines | ||
| PANC-1 (human) | ATCC | Cat#CRL-1469; RRID: CVCL_0480 |
| PU-8988T (human) | DSMZ | Cat#ACC-162; RRID:CVCL_1847 |
| MiaPaca-2 (human) | ATCC | Cat#CRL-1420; RRID:CVCL_0428 |
| 3B11 (murine) | ATCC | Cat#CRL-2160; RRID:CVCL_5487 |
| Pdx1-Cre; LSL-KrasG12D/+; LSL-p53R172H/wt (KPCmut) PDAC cells/organoids (murine) | This paper | N/A |
| Primary pancreatic fibroblasts from C57BL/6 mice | Cell Biologics, Inc. | Cat#C57-6201 |
| Primary BMDM (Bone marrow-derived macrophages) from C57BL/6 mice | This paper | N/A |
| Experimental Models: Organisms/Strains | ||
| Mouse: C57BL/6 | Jackson laboratory | Cat#JAX:000664; RRID:IMSR_JAX:000664 |
| Mouse: NOD-scid IL2Rγnull: NOD.Cg-Prkdcscid Il2rgtm1Wjl/SzJ | Jackson laboratory | Cat#JAX:005557; RRID:IMSR_JAX:005557 |
| Mouse: C57BL/6-Tg(TcraTcrb)1100Mjb/J | Jackson laboratory | Cat#JAX:003831; RRID:IMSR_JAX:003831 |
| Mouse: LSL-K-ras G12D: B6.129S4-Krastm4Tyj/J | Jackson laboratory | Cat#JAX:008179; RRID:IMSR_JAX:008179 |
| Mouse: Pdx1-Cre: B6.FVB-Tg(Pdx1-cre) 6Tuv/J | Jackson laboratory | Cat#JAX:014647: RRID:IMSR_JAX:014647 |
| Mouse: LSL-p53R172H: p53LSL.R172H 129svj | Jackson laboratory | Cat#JAX:008652; RRID:IMSR_JAX:008652 |
| Mouse: p53flox: B6.129P2-Trp53tm1Brn/J | Jackson laboratory | Cat#JAX:008462; RRID:IMSR_JAX:008462 |
| Oligonucleotides | ||
| shRNA sequence: Renilla: TAGATAAGCATTATAATTCCT | Chicas et al., 2010 | N/A |
| shRNA sequence: p65: TATAGCTTCAGGGTACTCCATC | Chien et al., 2011 | N/A |
| qPCR primer: p65 left: CTCAACTTCTGTCCCCAAGC | This paper | N/A |
| qPCR primer: p65 right: GAGGTACCATGGCTGAGGAA | This paper | N/A |
| qPCR primer: 36B4 left: GCTCCAAGCAGATGCAGCA | Morris et al., 2019 | N/A |
| qPCR primer: 36B4 right: CCGGATGTGAGGCAGCAG | Morris et al., 2019 | N/A |
| See Table S2 for additional qPCR primers | N/A | N/A |
| Recombinant DNA | ||
| Plasmid: MSCV-Luciferase-IRES-GFP | This paper | N/A |
| Plasmid: LMP-shRNA | Chicas et al., 2010 | N/A |
| Software and Algorithms | ||
| Vevo LAB software | VisualSonic | VevoLab |
| Living Image software | Caliper Life Science | Cat#128113; RRID:SCR_014247 |
| STAR | Dobin et al., 2013 | RRID:SCR_015899; |
| featureCounts | Liao et al., 2014 | RRID:SCR_012919; http://bioinf.wehi.edu.au/featureCounts/ |
| R | N/A | https://www.r-project.org |
| cutadapt | Martin, 2011 | RRID:SCR_011841; http://gensoft.pasteur.fr/docs/cutadapt/1.6/guide.html |
| BWA | Li and Durbin, 2009 | RRID:SCR_010910; http://bio-bwa.sourceforge.net |
| PICARD | N/A | RRID:SCR_006525; http://broadinstitute.github.io/picard/index.html |
| GATK | McKenna et al., 2010 | RRID:SCR_001876; https://gatk.broadinstitute.org/ |
| ABRA | Mose et al., 2014 | RRID:SCR_003277; https://github.com/mozack/abra |
| muTect | Cibulskis et al., 2013 | RRID:SCR_000559; https://software.broadinstitute.org/cancer/cga/mutect |
| DESeq2 | Love et al., 2014 | RRID:SCR_015687; https://bioconductor.org/packages/release/bioc/html/DESeq2.html |
| Trimmomatic | Bolger et al., 2014 | RRID:SCR_011848; http://www.usadellab.org/cms/?page=trimmomatic |
| HTSeq | Anders et al., 2015 | RRID:SCR_005514; https://htseq.readthedocs.io/en/release_0.11.1/ |
| Enrichr | Kuleshov et al., 2016 | RRID:SCR_001575; http://amp.pharm.mssm.edu/Enrichr |
| Other | ||
| Vevo 2100 System ultrasound | VisualSonic | RRID:SCR_015816 |
| Xenogen IVIS Spectrum imager | PerkinElmer | Cat#124262 |
| Typhoon FLA 7000 laser scanner | GE healthcare | Cat#28-9558-09 |
| Gentle MACS Octo dissociator with heaters | Miltenyi Biotech | Cat#130-096-427 |
| Guava Easycyte | Millipore | Cat#0500-4008 |
| ViiA 7 Real-Time PCR System | Invitrogen | Cat#4453536 |
Highlights.
Therapy-induced senescence in PDAC triggers SASP-dependent vascular remodeling
SASP-mediated vascularization facilitates chemotherapy uptake and efficacy
SASP-mediated endothelial activation drives T cell infiltration into PDAC lesions
Senescence-inducing treatment potentiates PD-1 blockade in PDAC models
ACKNOWLEDGMENTS
We thank K.L. Pitter, O. Grbovic-Huezo, and T. Tammela for sharing antibodies; the Molecular Cytology Core at MSKCC for immunofluorescence analysis and quantification; N. Socci and the Bioinformatics Core at MSKCC for assistance with whole-exome sequencing analysis; L. Zamechek, S. Tian, K. Rybczyk, A. Tehuitzil, A. Wuest, and M. Chalarca for technical assistance; A. Schietinger and T. Tammela for helpful suggestions and comments on the manuscript; and other members of the Lowe laboratory for insightful discussions. We thank Mr. William H. Goodwin, Mrs. Alice Goodwin, and the Commonwealth Foundation for Cancer Research for research support. We acknowledge support from the American Cancer Society (ACS) (PF-16-115-01-TBG to M.R., PF-14-066-01-TBE to J.P.M., and GC230452 to D.A.H.), NWO (Rubicon Fellowship 452182318 to R.M.), the German Research Foundation (to J. Leibold), the Alan and Sandra Gerry Metastasis and Ecosystem Center (to J. Leibold), the Blavatnik Family Foundation (to J. Li), the NSF (1752506 to D.A.H.), the Pershing Square Sohn Cancer Research Alliance (to D.A.H.), the Experimental Therapeutics Center at MSKCC (to D.A.H.), the V Foundation (to B.Z.S.), the Abramson Family Cancer Research Institute (toB Z.S.), the Herrick Foundation endowed chair (to C.J.S.), and the American Lebanese Syrian-Associated Charities of St. Jude Children’s Research Hospital (to C.J.S.). This work was also supported by a Research Investigator award from the Lustgarten Foundation (to S.W.L.), the NCI (CA013106 to S.W.L., K99 CA241110 to M.R., T32 CA062948 and F31 CA 232665 to R.S., and R01 CA215719 to D.A.H.), the NIH (U54 OD020355 to S.W.L. and E.d.S., R01 CA194321 to J.R., K12 CA184746 to P.B.R., and CA229803 to B.Z.S.), a pilot grant from the MSKCC-Parker Institute for Cancer Immunotherapy (to S.W.L.), and a MSKCC support grant (P30 CA008748 to S.W.L.). S.W.L. is the Geoffrey Beene Chair for Cancer Biology and an investigator in the Howard Hughes Medical Institute.
Footnotes
SUPPLEMENTAL INFORMATION
Supplemental Information can be found online at https://doi.org/10.1016/j.cell.2020.03.008.
DECLARATION OF INTERESTS
P.B.R. is a consultant for EMD Serono. D.A.H. is a cofounder of LipidSense, Inc., a cofounder and officer with equity interest in Goldilocks Therapeutics Inc., and a member of the scientific advisory board of Concarlo Holdings, LLC. B.Z.S. is an advisorto iTeosTherapeutics and receives research funding from Boehringer Ingelheim. S.W.L. is a founder and scientific advisory board member of Blueprint Medicines, ORIC Pharmaceuticals, and Geras Bio and received an award and honorarium from Eli Lilly and Company. M.R., J.P.M., R.M., J. Leibold, C.J.S., and S.W.L. have filed a U.S. patent application (Ser. No. 62/694,519) related to this work.
REFERENCES
- Alexandrov LB, Nik-Zainal S, Wedge DC, Aparicio SA, Behjati S, Biankin AV, Bignell GR, Bolli N, Borg A, Børresen-Dale AL, et al. ; Australian Pancreatic Cancer Genome Initiative; ICGC Breast Cancer Consortium; ICGC MMML-Seq Consortium; ICGC PedBrain (2013). Signatures of mutational processes in human cancer. Nature 500, 415–421. [DOI] [PMC free article] [PubMed] [Google Scholar]
- Ancrile B, Lim KH, and Counter CM (2007). Oncogenic Ras-induced secretion of IL6 is required fortumorigenesis. Genes Dev. 21, 1714–1719. [DOI] [PMC free article] [PubMed] [Google Scholar]
- Anders S, Pyl PT, and Huber W (2015). HTSeq-a Python framework to work with high-throughput sequencing data. Bioinformatics 31, 166–169. [DOI] [PMC free article] [PubMed] [Google Scholar]
- Baker DJ, Childs BG, Durik M, Wijers ME, Sieben CJ, Zhong J, Saltness RA, Jeganathan KB, Verzosa GC, Pezeshki A, et al. (2016). Naturally occurring p16(Ink4a)-positive cells shorten healthy lifespan. Nature 530, 184–189. [DOI] [PMC free article] [PubMed] [Google Scholar]
- Bardeesy N, Aguirre AJ, Chu GC, Cheng KH, Lopez LV, Hezel AF, Feng B, Brennan C, Weissleder R, Mahmood U, et al. (2006). Both p16(Ink4a) and the p19(Arf)-p53 pathway constrain progression of pancreatic adenocarcinoma in the mouse. Proc. Natl. Acad. Sci. USA 103, 5947–5952. [DOI] [PMC free article] [PubMed] [Google Scholar]
- Blando J, Sharma A, Higa MG, Zhao H, Vence L, Yadav SS, Kim J, Sepulveda AM, Sharp M, Maitra A, et al. (2019). Comparison of immune infiltrates in melanoma and pancreatic cancer highlights VISTA as a potential target in pancreatic cancer. Proc. Natl. Acad. Sci. USA 116, 1692–1697. [DOI] [PMC free article] [PubMed] [Google Scholar]
- Boj SF, Hwang CI, Baker LA, Chio II, Engle DD, Corbo V, Jager M, Ponz-Sarvise M, Tiriac H, Spector MS, et al. (2015). Organoid models of human and mouse ductal pancreatic cancer. Cell 160, 324–338. [DOI] [PMC free article] [PubMed] [Google Scholar]
- Bolger AM, Lohse M, and Usadel B (2014). Trimmomatic: a flexible trimmer for Illumina sequence data. Bioinformatics 30, 2114–2120. [DOI] [PMC free article] [PubMed] [Google Scholar]
- Brahmer JR, Tykodi SS, Chow LQ, Hwu WJ, Topalian SL, Hwu P, Drake CG, Camacho LH, Kauh J, Odunsi K, et al. (2012). Safety and activity of anti-PD-L1 antibody in patients with advanced cancer. N. Engl. J. Med 366, 2455–2465. [DOI] [PMC free article] [PubMed] [Google Scholar]
- Brea EJ, Oh CY, Manchado E, Budhu S, Gejman RS, Mo G, Mondello P, Han JE, Jarvis CA, Ulmert D, et al. (2016). Kinase Regulation of Human MHC Class I Molecule Expression on Cancer Cells. Cancer Immunol. Res 4, 936–947. [DOI] [PMC free article] [PubMed] [Google Scholar]
- Buckanovich RJ, Facciabene A, Kim S, Benencia F, Sasaroli D, Balint K, Katsaros D, O’Brien-Jenkins A, Gimotty PA, and Coukos G (2008). Endothelin B receptor mediates the endothelial barrier to T cell homing to tumors and disables immune therapy. Nat. Med 14, 28–36. [DOI] [PubMed] [Google Scholar]
- Caldwell ME, DeNicola GM, Martins CP, Jacobetz MA, Maitra A, Hruban RH, and Tuveson DA (2012). Cellular features of senescence during the evolution of human and murine ductal pancreatic cancer. Oncogene 31, 1599–1608. [DOI] [PMC free article] [PubMed] [Google Scholar]
- Carmichael J, Fink U, Russell RC, Spittle MF, Harris AL, Spiessi G, and Blatter J (1996). Phase II study of gemcitabine in patients with advanced pancreatic cancer. Br. J. Cancer 73, 101–105. [DOI] [PMC free article] [PubMed] [Google Scholar]
- Carrière C, Gore AJ, Norris AM, Gunn JR, Young AL, Longnecker DS, and Korc M (2011). Deletion of Rb accelerates pancreatic carcinogenesis by oncogenic Kras and impairs senescence in premalignant lesions. Gastroenterology 141, 1091–1101. [DOI] [PMC free article] [PubMed] [Google Scholar]
- Chauhan VP, Martin JD, Liu H, Lacorre DA, Jain SR, Kozin SV, Stylianopoulos T, Mousa AS, Han X, Adstamongkonkul P, et al. (2013). Angiotensin inhibition enhances drug delivery and potentiates chemotherapy by decompressing tumour blood vessels. Nat. Commun 4, 2516. [DOI] [PMC free article] [PubMed] [Google Scholar]
- Chicas A, Wang X, Zhang C, McCurrach M, Zhao Z, Mert O, Dickins RA, Narita M, Zhang M, and Lowe SW (2010). Dissecting the unique role of the retinoblastoma tumor suppressor during cellular senescence. Cancer Cell 17, 376–387. [DOI] [PMC free article] [PubMed] [Google Scholar]
- Chien Y, Scuoppo C, Wang X, Fang X, Balgley B, Bolden JE, Premsrirut P, Luo W, Chicas A, Lee CS, et al. (2011). Control of the senescence-associated secretory phenotype by NF-kB promotes senescence and enhances chemosensitivity. Genes Dev. 25, 2125–2136. [DOI] [PMC free article] [PubMed] [Google Scholar]
- Cibulskis K, Lawrence MS, Carter SL, Sivachenko A, Jaffe D, Sougnez B , Gabriel S, Meyerson M, Lander ES, and Getz G (2013). Sensitive detection of somatic point mutations in impure and heterogeneous cancer samples. Nat. Biotechnol 31, 213–219. [DOI] [PMC free article] [PubMed] [Google Scholar]
- Clark CE, Hingorani SR, Mick R, Combs C, Tuveson DA, and Vonderheide RH (2007). Dynamics of the immune reaction to pancreatic cancer from inception to invasion. Cancer Res. 67, 9518–9527. [DOI] [PubMed] [Google Scholar]
- Collins MA, Bednar F, Zhang Y, Brisset JC, Galbán S, Galbán CJ, Rakshit S, Flannagan KS, Adsay NV, and Pasca di Magliano M (2012a). Oncogenic Kras is required for both the initiation and maintenance of pancreatic cancer in mice. J. Clin. Invest 122, 639–653. [DOI] [PMC free article] [PubMed] [Google Scholar]
- Collins MA, Brisset JC, Zhang Y, Bednar F, Pierre J, Heist KA, Galbiin CJ, Galban S, and di Magliano MP (2012b). Metastatic pancreatic cancer is dependent on oncogenic Kras in mice. PLoS ONE 7, e49707. [DOI] [PMC free article] [PubMed] [Google Scholar]
- Coppé JP, Kauser K, Campisi J, and Beauséjour CM (2006). Secretion of vascular endothelial growth factor by primary human fibroblasts at senescence. J. Biol. Chem 281, 29568–29574. [DOI] [PubMed] [Google Scholar]
- Coppé JP, Patil CK, Rodier F, Sun Y, Muñoz DP, Goldstein J, Nelson PS, Desprez PY, and Campisi J (2008). Senescence-associated secretory phenotypes reveal cell-nonautonomous functions of oncogenic RAS and the p53 tumor suppressor. PLoS Biol. 6, 2853–2868. [DOI] [PMC free article] [PubMed] [Google Scholar]
- Coppé JP, Desprez PY, Krtolica A, and Campisi J (2010). The senescence-associated secretory phenotype: the dark side of tumor suppression. Annu. Rev. Pathol 5, 99–118. [DOI] [PMC free article] [PubMed] [Google Scholar]
- Demaria M, Ohtani N, Youssef SA, Rodier F, Toussaint W, Mitchell JR, Laberge RM, Vijg J, Van Steeg H, Dolle ME, et al. (2014). An essential role for senescent cells in optimal wound healing through secretion of PDGF-AA. Dev. Cell 31, 722–733. [DOI] [PMC free article] [PubMed] [Google Scholar]
- Demaria M, O’Leary MN, Chang J, Shao L, Liu S, Alimirah F, Koenig K, Le C, Mitin N, Deal AM, et al. (2017). Cellular Senescence Promotes Adverse Effects of Chemotherapy and Cancer Relapse. Cancer Discov 7, 165–176. [DOI] [PMC free article] [PubMed] [Google Scholar]
- Deng J, Wang ES, Jenkins RW, Li S, Dries R, Yates K, Chhabra S, Huang W, Liu H, Aref AR, et al. (2018). CDK4/6 Inhibition Augments Anti-tumor Immunity by Enhancing T-cell Activation. Cancer Discov. 8, 216–233. [DOI] [PMC free article] [PubMed] [Google Scholar]
- Dobin A, Davis CA, Schlesinger F, Drenkow J, Zaleski C, Jha S, Batut P, Chaisson M, and Gingeras TR (2013). STAR: ultrafast universal RNA-seq aligner. Bioinformatics 29, 15–21. [DOI] [PMC free article] [PubMed] [Google Scholar]
- Ebert PJR, Cheung J, Yang Y, McNamara E, Hong R, Moskalenko M, Gould SE, Maecker H, Irving BA, Kim JM, et al. (2016). MAP Kinase Inhibition Promotes T Cell and Anti-tumor Activity in Combination with PD-L1 Checkpoint Blockade. Immunity 44, 609–621. [DOI] [PubMed] [Google Scholar]
- Ewald JA, Desotelle JA, Wilding G, and Jarrard DF (2010). Therapy-induced senescence in cancer. J. Natl. Cancer Inst 102, 1536–1546. [DOI] [PMC free article] [PubMed] [Google Scholar]
- Faget DV, Ren Q, and Stewart SA (2019). Unmasking senescence: context-dependent effects of SASP in cancer. Nat. Rev. Cancer 19, 439–453. [DOI] [PubMed] [Google Scholar]
- Feig C, Jones JO, Kraman M, Wells RJ, Deonarine A, Chan DS, Connell CM, Roberts EW, Zhao Q, Caballero OL, et al. (2013). Targeting CXCL12 from FAP-expressing carcinoma-associated fibroblasts synergizes with anti-PD-L1 immunotherapy in pancreatic cancer. Proc. Natl. Acad. Sci. USA 110, 20212–20217. [DOI] [PMC free article] [PubMed] [Google Scholar]
- Goel S, DeCristo MJ, Watt AC, BrinJones H, Sceneay J, Li BB, Khan N, Ubellacker JM, Xie S, Metzger-Filho O, et al. (2017). CDK4/6 inhibition triggers anti-tumour immunity. Nature 548, 471–475. [DOI] [PMC free article] [PubMed] [Google Scholar]
- Hamzah J, Jugold M, Kiessling F, Rigby P, Manzur M, Marti HH, Rabie T, Kaden S, Grone HJ, Hammerling GJ, et al. (2008). Vascular normalization in Rgs5-deficient tumours promotes immune destruction. Nature 453, 410–414. [DOI] [PubMed] [Google Scholar]
- Hanahan D, and Weinberg RA (2000). The hallmarks of cancer. Cell 100, 57–70. [DOI] [PubMed] [Google Scholar]
- Herreros-Villanueva M, Hijona E, Cosme A, and Bujanda L (2012). Mouse models of pancreatic cancer. World J. Gastroenterol 18, 1286–1294. [DOI] [PMC free article] [PubMed] [Google Scholar]
- Hingorani SR, Petricoin EF, Maitra A, Rajapakse V, King C, Jacobetz MA, Ross S, Conrads TP, Veenstra TD, Hitt BA, et al. (2003). Preinvasive and invasiveductal pancreaticcancerand its earlydetection inthemouse. Cancer Cell 4, 437–450. [DOI] [PubMed] [Google Scholar]
- Huang Y, Yuan J, Righi E, Kamoun WS, Ancukiewicz M, Nezivar J, Santosuosso M, Martin JD, Martin MR, Vianello F, et al. (2012). Vascular normalizing doses of antiangiogenic treatment reprogram the immunosuppressive tumor microenvironment and enhance immunotherapy. Proc. Natl. Acad. Sci. USA 109, 17561–17566. [DOI] [PMC free article] [PubMed] [Google Scholar]
- Huang Y, Kim BYS, Chan CK, Hahn SM, Weissman IL, and Jiang W (2018). Improving immune-vascular crosstalk for cancer immunotherapy. Nat. Rev. Immunol 18, 195–203. [DOI] [PMC free article] [PubMed] [Google Scholar]
- Hunt BJ, and Jurd KM (1998). Endothelial cell activation. A central pathophysiological process. BMJ 316, 1328–1329. [DOI] [PMC free article] [PubMed] [Google Scholar]
- Jain RK, Duda DG, Clark JW, and Loeffler JS (2006). Lessons from phase III clinical trialson anti-VEGFtherapyforcancer. Nat. Clin. Pract. Oncol 3, 24–40. [DOI] [PubMed] [Google Scholar]
- Jiang H, Hegde S, Knolhoff BL, Zhu Y, Herndon JM, Meyer MA, Nywening TM, Hawkins WG, Shapiro IM, Weaver DT, et al. (2016). Targeting focal adhesion kinase renders pancreatic cancers responsive to checkpoint immunotherapy. Nat. Med 22, 851–860. [DOI] [PMC free article] [PubMed] [Google Scholar]
- Kang TW, Yevsa T, Woller N, Hoenicke L, Wuestefeld T, Dauch D, Hohmeyer A, Gereke M, Rudalska R, Potapova A, et al. (2011). Senescence surveillance of pre-malignant hepatocytes limits liver cancer development. Nature 479, 547–551. [DOI] [PubMed] [Google Scholar]
- Kapoor A, Yao W, Ying H, Hua S, Liewen A, Wang Q, Zhong Y, Wu CJ, Sadanandam A, Hu B, et al. (2014). Yap1 activation enables bypass of oncogenic Kras addiction in pancreatic cancer. Cell 158, 185–197. [DOI] [PMC free article] [PubMed] [Google Scholar]
- Kotsantis P, Petermann E, and Boulton SJ (2018). Mechanisms of Oncogene-Induced Replication Stress: Jigsaw Falling into Place. Cancer Discov. 8, 537–555. [DOI] [PMC free article] [PubMed] [Google Scholar]
- Kraman M, Bambrough PJ, Arnold JN, Roberts EW, Magiera L, Jones JO, Gopinathan A, Tuveson DA, and Fearon DT (2010). Suppression of antitumor immunity by stromal cells expressing fibroblast activation protein-alpha. Science 330, 827–830. [DOI] [PubMed] [Google Scholar]
- Krizhanovsky V, Yon M, Dickins RA, Hearn S, Simon J, Miething C, Yee H, Zender L, and Lowe SW (2008). Senescence of activated stellate cells limits liver fibrosis. Cell 134, 657–667. [DOI] [PMC free article] [PubMed] [Google Scholar]
- Kuilman T, and Peeper DS (2009). Senescence-messaging secretome: SMS-ing cellular stress. Nat. Rev. Cancer 9, 81–94. [DOI] [PubMed] [Google Scholar]
- Kuleshov MV, Jones MR, Rouillard AD, Fernandez NF, Duan Q, Wang Z, Koplev S, Jenkins SL, Jagodnik KM, Lachmann A, et al. (2016). Enrichr: a comprehensive gene set enrichment analysis web server 2016 update. Nucleic Acids Res. 44 (W1), W90–7. [DOI] [PMC free article] [PubMed] [Google Scholar]
- Lee JJ, Perera RM, Wang H, Wu DC, Liu XS, Han S, Fitamant J, Jones PD, Ghanta KS, Kawano S, et al. (2014). Stromal response to Hedgehog signaling restrains pancreatic cancer progression. Proc Natl Acad Sci USA, E3091–E3100. [DOI] [PMC free article] [PubMed] [Google Scholar]
- Lesina M, Wormann SM, Morton J, Diakopoulos KN, Korneeva O, Wimmer M, Einwachter H, Sperveslage J, Demir IE, Kehl T, et al. (2016). RelA regulates CXCL1/CXCR2-dependent oncogene-induced senescence in murine Kras-driven pancreatic carcinogenesis. J. Clin. Invest 126, 2919–2932. [DOI] [PMC free article] [PubMed] [Google Scholar]
- Li H, and Durbin R (2009). Fast and accurate short read alignment with Burrows-Wheeler transform. Bioinformatics 25, 1754–1760. [DOI] [PMC free article] [PubMed] [Google Scholar]
- Liao Y, Smyth GK, and Shi W (2014). featureCounts: an efficient general purpose program for assigning sequence reads to genomic features. Bioinformatics 30, 923–930. [DOI] [PubMed] [Google Scholar]
- Ligorio M, Sil S, Malagon-Lopez J, Nieman LT, Misale S, Di Pilato M, Ebright RY, Karabacak MN, Kulkarni AS, Liu A, et al. (2019). Stromal Microenvironment Shapesthe Intratumoral Architecture of Pancreatic Cancer. Cell 178, 160–175 e127. [DOI] [PMC free article] [PubMed] [Google Scholar]
- Lorenzon P, Vecile E, Nardon E, Ferrero E, Harlan JM, Tedesco F, and Dobrina A (1998). Endothelial cell E- and P-selectin and vascular cell adhesion molecule-1 function as signaling receptors. J. Cell Biol 142, 1381–1391. [DOI] [PMC free article] [PubMed] [Google Scholar]
- Love MI, Huber W, and Anders S (2014). Moderated estimation of fold change and dispersion for RNA-seq datawith DESeq2. Genome Biol. 15, 550. [DOI] [PMC free article] [PubMed] [Google Scholar]
- Lujambio A, Akkari L, Simon J, Grace D, Tschaharganeh DF, Bolden JE, Zhao Z, Thapar V, Joyce JA, Krizhanovsky V, and Lowe SW (2013). Non-cell-autonomous tumor suppression by p53. Cell 153, 449–460. [DOI] [PMC free article] [PubMed] [Google Scholar]
- Manchado E, Weissmueller S, Morris JP 4th, Chen CC, Wullenkord R, Lujambio A, de Stanchina E, Poirier JT, Gainor JF, Corcoran RB, et al. (2016).Acombinatorial strategy fortreating KRAS-mutant lung cancer. Nature 534, 647–651. [DOI] [PMC free article] [PubMed] [Google Scholar]
- Martin M (2011). Cutadapt removes adapter sequences from high-throughput sequencing reads. EMBnet.journal 17, 10–12. [Google Scholar]
- McKenna A, Hanna M, Banks E, Sivachenko A, Cibulskis K, Kernytsky A, Garimella K, Altshuler D, Gabriel S, Daly M, and DePristo MA (2010). The Genome Analysis Toolkit: a MapReduce framework for analyzing next-generation DNA sequencing data. Genome Res. 20, 1297–1303. [DOI] [PMC free article] [PubMed] [Google Scholar]
- Meylan E, Dooley AL, Feldser DM, Shen L, Turk E, Ouyang C, and Jacks T (2009). Requirement for NF-kappaB signalling in a mouse model of lung adenocarcinoma. Nature 462, 104–107. [DOI] [PMC free article] [PubMed] [Google Scholar]
- Mikuła-Pietrasik J, Sosińska P, Naumowicz E, Maksin K, Piotrowska H, Woźniak A, Szpurek D, and Książek K (2016). Senescent peritoneal mesothelium induces a pro-angiogenic phenotype in ovarian cancer cells in vitro and in a mouse xenograft model in vivo. Clin. Exp. Metastasis 33, 15–27. [DOI] [PMC free article] [PubMed] [Google Scholar]
- Morris JP 4th, Wang SC, and Hebrok M (2010). KRAS, Hedgehog, Wnt and the twisted developmental biology of pancreatic ductal adenocarcinoma. Nat. Rev. Cancer 10, 683–695. [DOI] [PMC free article] [PubMed] [Google Scholar]
- Morris JP 4th, Yashinskie JJ, Koche R, Chandwani R, Tian S, Chen CC, Baslan T, Marinkovic ZS, Sánchez-Rivera FJ, Leach SD, et al. (2019). α-Ketoglutarate links p53 to cell fate during tumour suppression. Nature 573, 595–599. [DOI] [PMC free article] [PubMed] [Google Scholar]
- Morton JP, Timpson P, Karim SA, Ridgway RA, Athineos D, Doyle B, Jamieson NB, Oien KA, Lowy AM, Brunton VG, et al. (2010). Mutant p53 drives metastasis and overcomesgrowth arrest/senescence in pancreatic cancer. Proc. Natl. Acad. Sci. USA 107, 246–251. [DOI] [PMC free article] [PubMed] [Google Scholar]
- Mose LE, Wilkerson MD, Hayes DN, Perou CM, and Parker JS (2014). ABRA: improved coding indel detection via assembly-based realignment. Bioinformatics 30, 2813–2815. [DOI] [PMC free article] [PubMed] [Google Scholar]
- Mosteiro L, Pantoja C, Alcazar N, Marión RM, Chondronasiou D, Rovira M, Fernandez-Marcos PJ, Murñoz-Martin M, Blanco-Aparicio C, Pastor J, et al. (2016). Tissue damage and senescence provide critical signals for cellular reprogramming in vivo. Science 354, aaf4445. [DOI] [PubMed] [Google Scholar]
- Muller WA (2009). Mechanisms of transendothelial migration of leukocytes. Circ. Res 105, 223–230. [DOI] [PMC free article] [PubMed] [Google Scholar]
- Nandi A, Estess P, and Siegelman M (2004). Bimolecular complex between rolling and firm adhesion receptors required for cell arrest; CD44 association with VLA-4 in T cell extravasation. Immunity 20, 455–465. [DOI] [PubMed] [Google Scholar]
- Narita M, Nuñez S, Heard E, Narita M, Lin AW, Hearn SA, Spector BL, Hannon GJ, and Lowe SW. (2003). Rb-mediated heterochromatin formation and silencing of E2F target genes during cellular senescence. Cell 113, 703–716. [DOI] [PubMed] [Google Scholar]
- Neves J, Demaria M, Campisi J, and Jasper H (2015). Of flies, mice, and men: evolutionarily conserved tissue damage responses and aging. Dev. Cell 32, 9–18. [DOI] [PMC free article] [PubMed] [Google Scholar]
- Öhlund D, Handly-Santana A, Biffi G, Elyada E, Almeida AS, Ponz-Sarvise M, Corbo V, Oni TE, Hearn SA, Lee EJ, et al. (2017). Distinct populations of inflammatory fibroblasts and myofibroblasts in pancreatic cancer. J. Exp. Med 214, 579–596. [DOI] [PMC free article] [PubMed] [Google Scholar]
- Okumura S, and Jänne PA (2014). Molecular pathways: the basis for rational combination using MEK inhibitors in KRAS-mutant cancers. Clin. Cancer Res 20, 4193–4199. [DOI] [PubMed] [Google Scholar]
- Olive KP, Jacobetz MA, Davidson CJ, Gopinathan A, McIntyre D, Honess D, Madhu B, Goldgraben MA, Caldwell ME, Allard D, et al. (2009). Inhibition of Hedgehog signaling enhances delivery of chemotherapy in a mouse model of pancreatic cancer. Science 324, 1457–1461. [DOI] [PMC free article] [PubMed] [Google Scholar]
- Oubaha M, Miloudi K, Dejda A, Guber V, Mawambo G, Germain MA, Bourdel G, Popovic N, Rezende FA, Kaufman RJ, et al. (2016). Senescence-associated secretory phenotype contributes to pathological angiogenesis in retinopathy. Sci. Transl. Med 8, 362ra144. [DOI] [PubMed] [Google Scholar]
- Panni RZ, Herndon JM, Zuo C, Hegde S, Hogg GD, Knolhoff BL, Breden MA, Li X, Krisnawan VE, Khan SQ, et al. (2019). Agonism of CD11b reprograms innate immunityto sensitize pancreatic cancerto immunotherapies. Sci. Transl. Med 11, eaau9240. [DOI] [PMC free article] [PubMed] [Google Scholar]
- Plunkett W, Huang P, Xu YZ, Heinemann V, Grunewald R, and Gandhi V (1995). Gemcitabine: metabolism, mechanisms of action, and self-potentiation. Semin. Oncol 22 (4, Suppl 11), 3–10. [PubMed] [Google Scholar]
- Poirier JT, Gardner EE, Connis N, Moreira AL, de Stanchina E, Hann CL, and Rudin CM (2015). DNA methylation in small cell lung cancer defines distinct disease subtypes and correlateswith high expression of EZH2. Oncogene 34, 5869–5878. [DOI] [PMC free article] [PubMed] [Google Scholar]
- Provenzano PP, Cuevas C, Chang AE, Goel VK, Von Hoff DD, and Hingorani SR (2012). Enzymatic targeting of the stroma ablates physical barriers to treatment of pancreatic ductal adenocarcinoma. Cancer Cell 21, 418–429. [DOI] [PMC free article] [PubMed] [Google Scholar]
- Rhim AD, Oberstein PE, Thomas DH, Mirek ET, Palermo CF, Sastra SA, Dekleva EN, Saunders T, Becerra CP, Tattersall IW, et al. (2014). Stromal elements act to restrain, rather than support, pancreatic ductal adenocarcinoma. Cancer Cell 25, 735–747. [DOI] [PMC free article] [PubMed] [Google Scholar]
- Ribas A, and Wolchok JD (2018). Cancer immunotherapy using checkpoint blockade. Science 359, 1350–1355. [DOI] [PMC free article] [PubMed] [Google Scholar]
- Ribas A, Lawrence D, Atkinson V, Agarwal S, Miller WH Jr., Carlino MS, Fisher R, Long GV, Hodi FS, Tsoi J, et al. (2019). Combined BRAF and MEK inhibition with PD-1 blockade immunotherapy in BRAF-mutant melanoma. Nat. Med 25, 936–940. [DOI] [PMC free article] [PubMed] [Google Scholar]
- Rosow DE, Liss AS, Strobel O, Fritz S, Bausch D, Valsangkar NP, Alsina J, Kulemann B, Park JK, Yamaguchi J, et al. (2012). Sonic Hedgehog in pancreatic cancer: from bench to bedside, then back to the bench. Surgery 152 (3, Suppl 1), S19–S32. [DOI] [PMC free article] [PubMed] [Google Scholar]
- Royal RE, Levy C, Turner K, Mathur A, Hughes M, Kammula US, Sherry RM, Topalian SL, Yang JC, Lowy I, and Rosenberg SA (2010). Phase 2 trial of single agent Ipilimumab (anti-CTLA-4) for locally advanced or metastatic pancreatic adenocarcinoma. J. Immunother 33, 828–833. [DOI] [PMC free article] [PubMed] [Google Scholar]
- Ruscetti M, Leibold J, Bott MJ, Fennell M, Kulick A, Salgado NR, Chen CC, Ho YJ, Sanchez-Rivera FJ, Feucht J, et al. (2018). NK cell-mediated cytotoxicity contributes to tumor control by a cytostatic drug combination. Science 362, 1416–1422. [DOI] [PMC free article] [PubMed] [Google Scholar]
- Salmon H, Remark R, Gnjatic S, and Merad M (2019). Host tissue determinants of tumour immunity. Nat. Rev. Cancer 19, 215–227. [DOI] [PMC free article] [PubMed] [Google Scholar]
- Samstein RM, Lee CH, Shoushtari AN, Hellmann MD, Shen R, Janjigian YY, Barron DA, Zehir A, Jordan EJ, Omuro A, et al. (2019).Tumor mutational load predicts survival after immunotherapy across multiple cancer types. Nat. Genet 51, 202–206. [DOI] [PMC free article] [PubMed] [Google Scholar]
- Schaer DA, Beckmann RP, Dempsey JA, Huber L, Forest A, Amaladas N, Li Y, Wang YC, Rasmussen ER, Chin D, et al. (2018). The CDK4/6 Inhibitor Abemaciclib Induces a T Cell Inflamed Tumor Microenvironment and Enhances the Efficacy of PD-L1 Checkpoint Blockade. Cell Rep. 22, 2978–2994. [DOI] [PubMed] [Google Scholar]
- Schafer MJ, White TA, Iijima K, Haak AJ, Ligresti G, Atkinson EJ, Oberg AL, Birch J, Salmonowicz H, Zhu Y, et al. (2017). Cellular senescence mediates fibrotic pulmonary disease. Nat. Commun 8, 14532. [DOI] [PMC free article] [PubMed] [Google Scholar]
- Schumacher TN, and Schreiber RD (2015). Neoantigens in cancer immunotherapy. Science 348, 69–74. [DOI] [PubMed] [Google Scholar]
- Serrano M, Lin AW, McCurrach ME, Beach D, and Lowe SW (1997). Oncogenic ras provokes premature cell senescence associated with accumulation of p53 and p16INK4a. Cell 88, 593–602. [DOI] [PubMed] [Google Scholar]
- Sharpe AH, and Pauken KE (2018). The diversefunctions of the PD1 inhibitory pathway. Nat. Rev. Immunol 18, 153–167. [DOI] [PubMed] [Google Scholar]
- Shrimali RK, Yu Z, Theoret MR, Chinnasamy D, Restifo NP, and Rosenberg SA (2010). Antiangiogenic agents can increase lymphocyte infiltration into tumor and enhance the effectiveness of adoptive immunotherapy of cancer. Cancer Res. 70, 6171–6180. [DOI] [PMC free article] [PubMed] [Google Scholar]
- Sieben CJ, Sturmlechner I, van de Sluis B, and van Deursen JM (2018). Two-Step Senescence-Focused Cancer Therapies. Trends Cell Biol. 28, 723–737. [DOI] [PMC free article] [PubMed] [Google Scholar]
- Siegel RL, Miller KD, and Jemal A (2019). Cancer statistics, 2019. CA Cancer J. Clin 69, 7–34. [DOI] [PubMed] [Google Scholar]
- Steele CW, Karim SA, Leach JDG, Bailey P, Upstill-Goddard R, Rishi L, Foth M, Bryson S, McDaid K, Wilson Z, et al. (2016). CXCR2 Inhibition Profoundly Suppresses Metastases and Augments Immunotherapy in Pancreatic Ductal Adenocarcinoma. Cancer Cell 29, 832–845. [DOI] [PMC free article] [PubMed] [Google Scholar]
- Sun C, Hobor S, Bertotti A, Zecchin D, Huang S, Galimi F, Cottino F, Prahallad A, Grernrum W, Tzani A, et al. (2014). Intrinsic resistance to MEK inhibition in KRAS mutant lung and colon cancer through transcriptional induction of ERBB3. Cell Rep. 7, 86–93. [DOI] [PubMed] [Google Scholar]
- Sun C, Mezzadra R, and Schumacher TN (2018). Regulation and Function of the PD-L1 Checkpoint. Immunity 48, 434–452. [DOI] [PMC free article] [PubMed] [Google Scholar]
- Tasdemir N, Banito A, Roe JS, Alonso-Curbelo D, Camiolo M, Tschaharganeh DF, Huang CH, Aksoy O, Bolden JE, Chen CC, et al. (2016). BRD4 Connects Enhancer Remodeling to Senescence Immune Surveillance. Cancer Discov. 6, 612–629. [DOI] [PMC free article] [PubMed] [Google Scholar]
- Vonderheide RH, and Bayne LJ (2013). Inflammatory networks and immune surveillance of pancreatic carcinoma. Curr. Opin. Immunol 25, 200–205. [DOI] [PMC free article] [PubMed] [Google Scholar]
- Woo RA, and Poon RY (2004). Activated oncogenes promote and cooperate with chromosomal instability for neoplastic transformation. Genes Dev. 18, 1317–1330. [DOI] [PMC free article] [PubMed] [Google Scholar]
- Wu NZ, Klitzman B, Dodge R, and Dewhirst MW (1992). Diminished leukocyte-endothelium interaction in tumor microvessels. Cancer Res. 52, 4265–4268. [PubMed] [Google Scholar]
- Xue W, Zender L, Miething C, Dickins RA, Hernando E, Krizhanovsky V, Cordon-Cardo C, and Lowe SW (2007). Senescence and tumour clearance is triggered by p53 restoration in murine liver carcinomas. Nature 445, 656–660. [DOI] [PMC free article] [PubMed] [Google Scholar]
- Zirlik K, and Duyster J (2018). Anti-Angiogenics: Current Situation and Future Perspectives. Oncol. Res. Treat 41, 166–171. [DOI] [PubMed] [Google Scholar]
Associated Data
This section collects any data citations, data availability statements, or supplementary materials included in this article.
Supplementary Materials
Data Availability Statement
The accession number for the RNA-seq data reported in this paper is GEO: GSE141684. The access number for the whole exome sequencing data reported in this paper is NCBI BioProject: PRJNA607826.