
Figure 2. SASP Factors Contribute to Vascular Remodeling in PDAC.
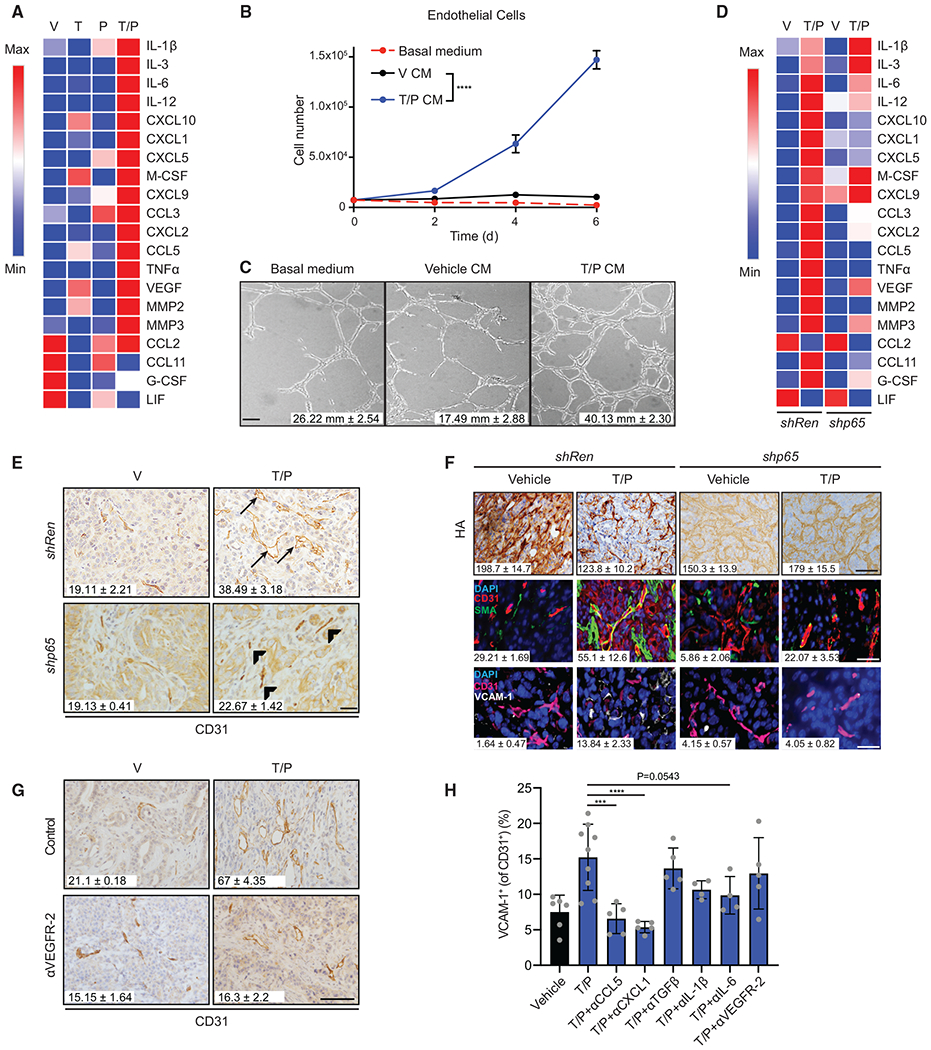
(A) Heatmap of cytokine array results from KPCmut cells following 8-day treatment with trametinib (25 nM) and/or palbociclib (500 nM). Data presented as mean of three biological replicates.
(B) Cell growth analysis of 3B11 cells cultured in serum-free (basal) or conditioned media (CM) from KPCmut cells treated as in (A) (n = 3).
(C) Endothelial tube formation analysis of 3B11 cells cultured in CM from (B). Quantification of total tube length is shown (n = 2; V versus T/P, p = 0.01).
(D) Heatmap of cytokine array results from KPCmut cells harboring control Renilla (Ren) or p65 shRNAs and treated as in (A). Data presented as mean of three biological replicates.
(E) IHC staining and quantification of blood vessels per field in KPCmut organoid transplant tumors harboring Ren or p65 shRNAs and treated for 2 weeks with vehicle or trametinib (1 mg/kg) and palbociclib (100 mg/kg) (n = 3; Ren T/P versus p65 T/P, p = 0.003). Arrowhead, collapsed vessel; arrow, visible lumen.
(F) IHC and IF staining of tumor samples in (E). Quantification of HA staining and αSMA and VCAM-1 colocalization with blood vessels are shown (n = 2–3; Ren V versus Ren T/P, p ≤ 0.05; Ren T/P versus p65 T/P, p ≤ 0.05).
(G) IHC staining and quantification of blood vessels per field in KPCmut organoid transplant tumors treated for 2 weeks with vehicle, trametinib (1 mg/kg), palbociclib (100 mg/kg), and/or a VEGFR-2 blocking antibody (DC101; 800 μg) (n = 3; T/P versus T/P+DC101, p = 0.003).
(H) Flow cytometry analysis of VCAM-1 expression on endothelial cells in KPCmut cell transplant tumors treated with vehicle, trametinib (1 mg/kg), palbociclib (100 mg/kg), and/or monoclonal antibodies (mAbs) targeting CCL5 (MAB478; 50 μg), CXCL1 (MAB453; 25 μg), TGF-β (1D11; 300 μg), IL-1β (B122; 200 μg), IL-6 (MP5-20F3; 200 μg), or VEGFR-2 (DC101; 800 μg) for 2 weeks (n ≥ 4).
Two-way ANOVA (B). One-way ANOVA (F and H). Error bars, mean ± SEM. ****p < 0.001, ***p < 0.01, Scale bars, 50 μm.
See also Figures S2 and S3.