
Figure 4. The SASP Promotes T Cell Infiltration via Endothelial Activation.
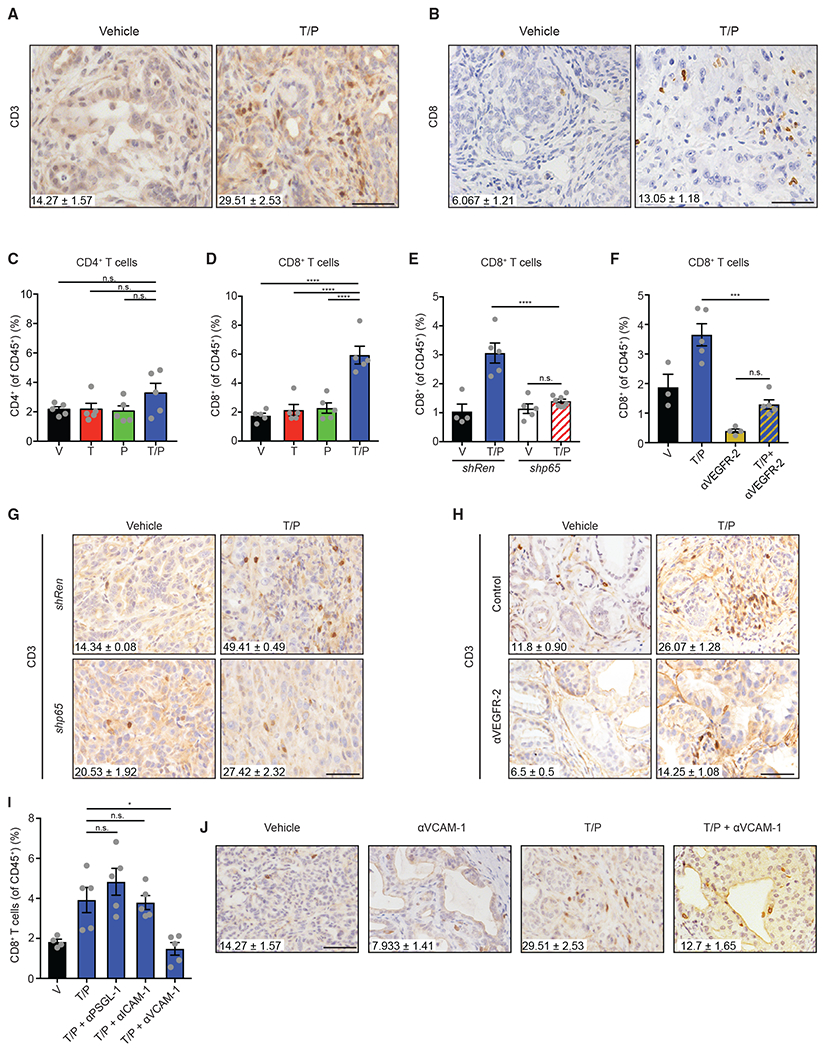
(A and B) IHC staining and quantification of intratumoral total (A) and CD8+ (B) T cells per field in KPCflox GEMM tumors treated with vehicle or trametinib (1 mg/kg) and palbociclib (100 mg/kg) for 2 weeks (n = 3; p < 0.01).
(C and D) Flow cytometry analysis of CD4+ (C) and CD8+ (D) T cells in KPCmut cell transplant tumors following 2-week treatment with vehicle, trametinib (1 mg/kg), and/or palbociclib (100 mg/kg) (n = 5).
(E) Flow cytometry analysis of CD8+ T cells in KPCmut cell transplant tumors harboring control Ren or p65 shRNAs and treated as in (A) (n = 4–7).
(F) Flow cytometry analysis of CD8+ T cells in KPCmut cell transplant tumors treated with vehicle, trametinib (1 mg/kg), palbociclib (100 mg/kg), and/or a VEGFR-2 blocking antibody (DC101; 800 μg) for 2 weeks (n = 3–5).
(G) IHC staining and quantification of intratumoral T cells per field in KPCmut organoid tumors harboring Ren or p65 shRNAs and treated as in (A) (n = 2–3; Ren T/P versus p65 T/P, p = 0.0001).
(H) IHC staining and quantification of intratumoral T cells per field in KPCflox GEMM tumors treated as in (F) (n = 2–3; T/P versus T/P/DC101, p = 0.007).
(I) Flow cytometry analysis of CD8+ T cells in KPCmut cell transplant tumors following 2-week treatment with vehicle, trametinib (1 mg/kg), palbociclib (100 mg/kg), and/or neutralizing mAbs targeting PSGL-1 (4RA10; 50 μg), ICAM-1 (YN1/1.7.4; 200 μg), or VCAM-1 (M/K-2.7; 200 μg) (n = 4–5).
(J) IHC staining and quantification of intratumoral T cells per field in KPCflox GEMM tumors treated with vehicle, trametinib (1 mg/kg), palbociclib (100 mg/kg), and/or a VCAM-1 neutralizing antibody (M/K-2.7; 200 μg) for 2 weeks (n ≥ 3; T/P versus T/P/VCAM-1, p = 0.008). Values for V and T/P-treated cohorts are the same displayed in (A).
One-way ANOVA (C–F and I). Error bars, mean ± SEM. ****p < 0.001, ***p < 0.01, *p < 0.05. n.s., not significant. Scale bars, 50 μm.
See also Figure S5.