
Figure 7. Senescence-Associated Vascular Remodeling Potentiates Immune Checkpoint Blockade in PDAC.
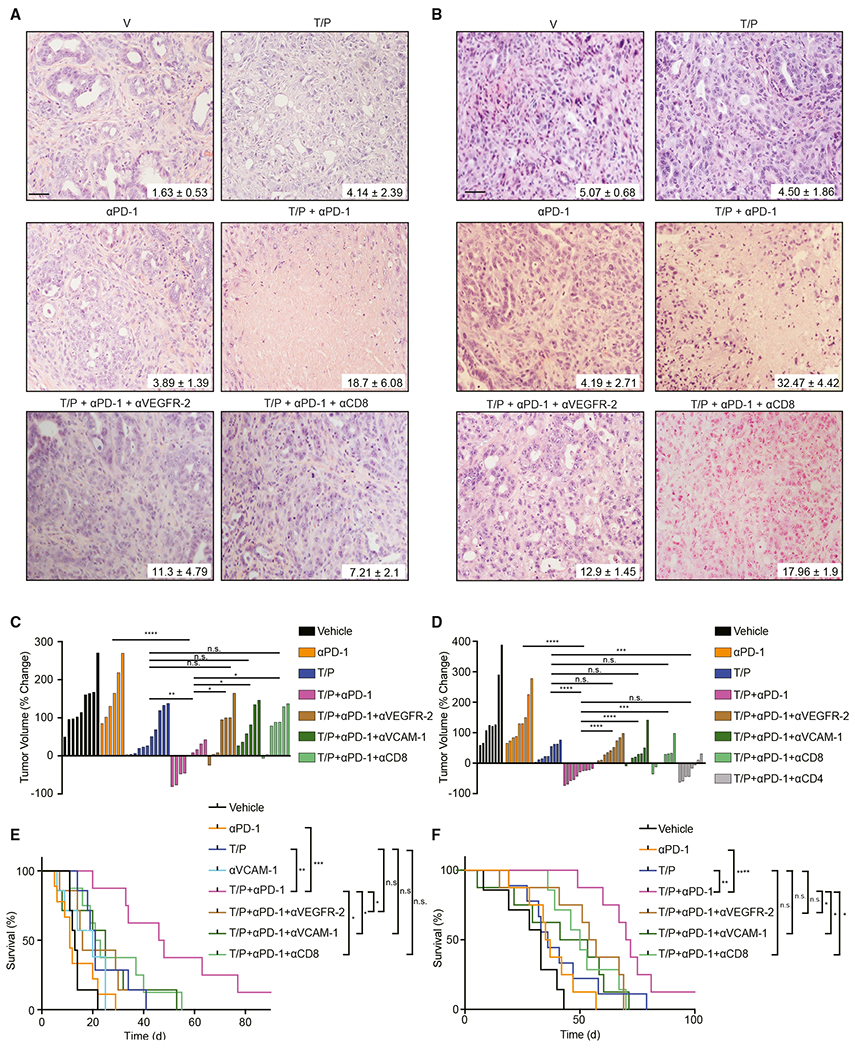
(A) H&E staining of KPCflox GEMM tumors treated for 2 weeks with vehicle, trametinib (1 mg/kg), palbociclib (100 mg/kg), and/or mAbs targeting PD-1 (RMP1-14; 200 μg), VEGFR-2 (DC101; 800 μg), or CD8 (2.43; 200 μg). Percent of tumor covered in necrosis is shown (n = 3; T/P versus T/P/PD-1, p = 0.08; PD-1 versus T/P/PD-1, p = 0.027).
(B) H&E staining of KPCmut organoid transplant tumors treated for 2 weeks as in (A). Percent of tumor covered in necrosis is shown (n = 3; T/P versus T/P/PD-1, p = 0.004; PD-1 versus T/P/PD-1, p = 0.019; T/P/PD-1 versus T/P/PD-1/DC101, p = 0.016; T/P/PD-1 versus T/P/PD-1/CD8, p = 0.09).
(C and D) Waterfall plot of the response of KPCflox GEMM (C) and KPCmut organoid transplant (D) tumors after 2 weeks of treatment with vehicle, trametinib (1 mg/kg), palbociclib (100 mg/kg), and/or mAbs targeting PD-1 (RMP1-14; 200 μg), VEGFR-2 (DC101; 800 μg), CD8 (2.43; 200 μg), CD4 (GK1.5; 200 μg), or VCAM-1 (M/K-2.7; 200 μg) (n ≥ 6). Values for V and T/P-treated cohorts are the same displayed in Figures 3C and 3E.
(E and F) Kaplan-Meier survival curves of KPCflox GEMM(E) and KPCmut organoid transplant (F) mice treated as in (D) (n ≥ 7). Values for V and T/P-treated cohorts are the same displayed in Figures 3D and 3F.
One-way ANOVA (C and D). Log-rank test (E and F). Error bars, mean ± SEM. ****p < 0.0001, ***p < 0.001, **p < 0.01, *p < 0.05. n.s., not significant. Scale bars, 50 μm.
See also Figure S7.