

Summary
Objective
To examine whether the promotion of water intake could reduce sugar‐sweetened beverage (SSB) consumption or purchases independent of interventions that target SSBs.
Methods
Seven databases were systematically searched. Included studies used water promotion as the primary intervention; used a controlled trial, single group pre‐post, or prospective cohort study design; included a measure of SSB consumption or purchase; enrolled human participants of any age who lived in high‐income or middle‐income countries; contained original data; and appeared in a peer‐reviewed English‐language article published from 1 January 2000 to January 4, 2019. The search yielded 7068 publications, from which 108 were chosen for full‐text review. Seventeen were included in this review.
Results
Nine of the 17 studies were randomized controlled trials, six were nonrandomized controlled trials, and 2 were single‐group pre‐post studies. Participants were primarily children and adolescents. Interventions included water provision, education or promotion activities. Ten of 17 studies were at low or some/moderate risk of bias. Seven studies showed a statistically significant decrease in SSB consumption of which only 2 were at low or some/moderate risk of bias.
Conclusions
This review found limited evidence that interventions aimed solely at increasing water consumption reduce SSB intake. Further research is needed to investigate whether interventions that combine water promotion and SSB reduction strategies could be synergistic for reducing SSB intake.
Keywords: water promotion, sugar‐sweetened beverage, sugar‐sweetened beverage consumption reduction
1. INTRODUCTION
Excessive consumption of sugar‐sweetened beverages (SSBs) is associated with an increased risk of weight gain, obesity, type 2 diabetes, cardiovascular disease, and tooth decay.1, 2, 3, 4, 5 Consumption of SSBs in the United States, while decreasing since its peak in 2000, remains at historically high and unhealthy levels.6 Two‐thirds of children and half of adults consume at least one SSB daily.7, 8 Consumption is higher among low‐income groups and minority groups in the United States.9
Interventions to address this important public health issue include implementing SSB taxes; limiting availability in schools, cafeterias, restaurants, and public places; adding warning and nutrition labels; conducting mass education campaigns; and providing individual education and counseling.10 Interest in promoting water consumption as an additional approach to SSB reduction has recently emerged, anticipating that increased water intake will lead to lower intake of SSBs through a substitution effect.11
Two reviews of clinical trials and observational studies suggested that substituting water for SSBs is associated with lower energy intake and weight loss.12, 13 Zheng et al concluded that substitution of water or low‐calorie beverages for SSBs was associated with less long‐term energy intake and weight gain.12 Daniels et al found that the most compelling evidence for water substitution was from studies in which adults consumed either water or SSBs before a meal. Water consumption was significantly associated with lower total energy intake.13 These reviews did not compare strategies to increase water consumption nor the effects of higher water intake on SSB consumption. Two reviews identified interventions that were effective in either increasing water or decreasing SSB intake. 14, 15 Interventions directed at water, such as providing nutritional counseling and education or improving access to water, had modest effects on increasing water intake among children age 0 to 5 years (+ 67 mL/d, and + 0.5‐3.5 oz/d). Interventions directed at SSBs, such as behavior change modeling, decreased SSB consumption (−76 mL/d in children).14, 15 These reviews did not address the question of whether promoting water consumption, independent of interventions focused on SSBs, reduces SSB consumption.
This systematic review examined whether promoting water consumption reduces purchase and/or consumption of SSBs. If water promotion is an effective SSB reduction strategy, it would be a welcome addition to the SSB reduction toolkit. If not, then resources should be directed toward implementing more effective interventions.
2. METHODS
The review protocol, developed prior to starting this systematic review, is available on the Healthy Food America website.16
2.1. Eligibility criteria
Studies were included if they (a) used a randomized controlled trial (RCT), nonrandomized controlled trial (NRCT), single group pre‐post, or prospective cohort study design; (b) implemented water promotion as the primary intervention); (c) included a measure of SSB consumption or purchase; (d) took place in high‐income or middle‐income countries as defined by Organization for Economic Co‐operation and Development, (e) enrolled human participants of any age; (f) contained original data (when the same data were found in multiple publications, the article with the largest sample size was selected); and (g) appeared in a peer‐reviewed English‐language journal article published since January 1, 2000 to January 4, 2019.17 Studies that had at least one intervention component (eg, education sessions, signage) that discouraged participants from drinking SSBs were excluded (in cases where the extent of SSB intervention was unclear, an attempt was made to contact authors).
2.2. Search strategy and databases
A medical librarian searched seven electronic databases in accordance with the National Academy of Medicine systematic reviews standards: PubMed, Embase, PsycInfo, CINAHL Complete, Cochrane Central Register of Controlled Trials, CAB Direct, and Web of Science.18 The search strategy (Appendix S1) was peer‐reviewed by a medical librarian and a subject‐matter expert and incorporated controlled vocabulary terms and keywords appropriate to each database to represent the concepts of drinking water; sweetened beverages; and clinical, controlled, or longitudinal studies.
2.3. Study selection
Covidence was used to manage the title, abstract, and full‐text screening of the articles.19 Two investigators (S.D. and J.K.) independently reviewed titles and abstracts of articles to select those for full‐text review based on described eligibility criteria and then independently reviewed selected articles to determine which to include in the review. After each phase, the reviewers resolved conflicts by consensus.
2.4. Data extraction
Each of the two reviewers used a customized, pilot‐tested Microsoft Excel spreadsheet to extract half of the studies and subsequently validated extractions performed by the other reviewer. Conflicts were resolved through consensus.
2.5. Primary outcomes and additional information extracted
The primary outcome was SSB consumption or purchases. The preferred measures were the difference in differences between intervention and control group mean daily volume of SSBs consumed or purchased (controlled difference), single group pre‐post difference (uncontrolled difference), or odds ratio. If none of these was reported, the measure reported by the included study was used.
Additional variables were extracted consistent with systematic review guideline recommendations including (a) Study: author; publication year; country; project name; sponsorship; setting; intervention dates; and authors’ statement of objectives, conclusions, limitations, and suggestions for future research; (b) Population: inclusion/exclusion criteria, participant demographic information, participation rate, completion rate; (c) Interventions: components, duration (the maximum length of time a participant could be exposed to the intervention); (d) Comparator: interventions received by the comparison group; (e) Timing of data collection; (f) Design: study design, consumption or purchase measures (SSB and water), follow‐up duration; (g) Analysis: analytic model and adjustments for confounding, approach to missing data, statistical power.20, 21, 22
Measures of purchases or consumption were converted into mL/day when possible. When 95% confidence intervals (CIs) were not presented, they were computed if available data permitted. When population characteristics were presented for intervention arms but not the total study population, they were computed using the proportions and numbers in each arm. Nine authors were contacted for further information, and responses were received from two Additional information was obtained as needed from companion publications or online study descriptions.
2.6. Appraisal of study quality
The Cochrane Collaborative Risk of Bias 2.0 and Risk Of Bias In Nonrandomized Studies‐I tools were used to assess risk of bias (low, some/moderate, high/serious, or critical) for randomized and nonrandomized studies, respectively.23, 24 Studies that lacked a comparison group were assigned a high/serious risk of bias rating. The two reviewers independently assessed the risk of bias of each study and resolved differences through consensus.
2.7. Synthesizing the results
Studies were divided into those that did and did not significantly (P < .05, adjusted for multiple comparisons) affect SSB consumption. Study characteristics were qualitatively assessed to determine whether they were more or less common among statistically significant studies relative to insignificant ones (eg, whether a specific intervention setting was more common among significant studies). In addition, this review summarizes the characteristics of higher quality studies, defined as those with low or some/moderate risk of bias.
3. RESULTS
The initial literature search retrieved 7068 publications. After removal of duplicate publications, 3652 remained for title and abstract screening (Figure 1). One hundred and eight were selected for full‐text review, and 17 articles were included in this review.25, 26, 27, 28, 29, 30, 31, 32, 33, 34, 35, 36, 37, 38, 39, 40, 41Figure 1 describes reasons for exclusion. Of note, 22 studies were excluded because they included a SSB reduction intervention.
Figure 1.
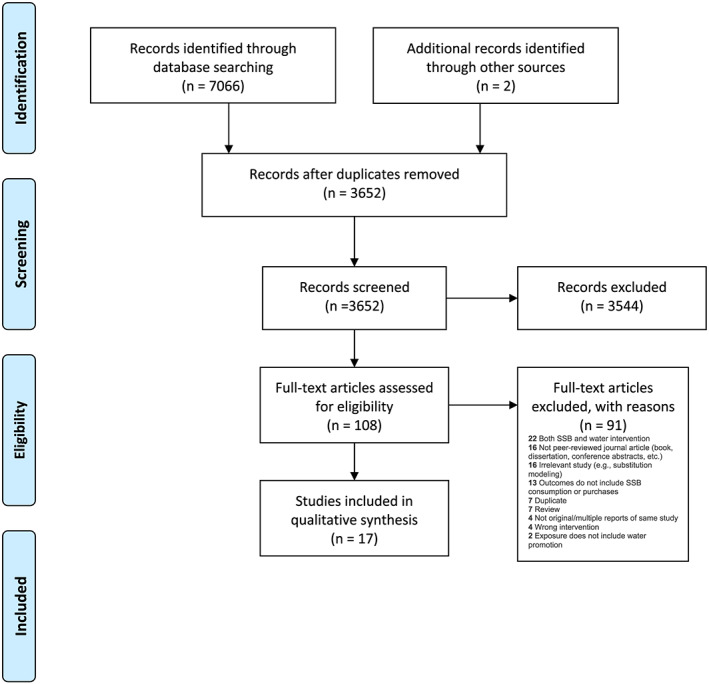
Study selection flow diagram
Study design, participant characteristics, intervention types, settings, definition of SSB, and outcome measures (most often volume consumed per day or week, but also calories per day, drinking more than a few sips, number of glasses, participants observed consuming, and volume sold per day or week) varied substantially across studies. Due to this heterogeneity, studies were synthesized qualitatively rather than with a meta‐analysis.
Table 1 describes the included studies. Nine of the studies were RCTs.25, 26, 27, 28, 29, 30, 31, 32, 33 Of these, four were cluster RCTs.28, 29, 30, 31, 32, 33 Six were NRCTs.35, 36, 37, 38, 39 Of these, two used a cluster design.35, 36 Two were single‐group pre‐post studies.40, 41 Eight studies were conducted in Europe, six in the United States, two in Australia, and one in the Caribbean. Intervention settings included schools (9), homes (3), supermarkets (2), other child‐focused settings such as preschools (2), and community‐wide (2). Intervention duration varied from 3 weeks to 3.5 years, with a median of 3 months. Studies were published between 2005 and 2018, of which 11 appeared within the past 5 years. Five studies noted industry funding.27, 35, 36, 37, 40
Table 1.
Study overview and characteristics
| Study | Water Intervention | Study Design and Risk of Bias | Sponsor | Population | Sample Size (Total) | Extent of Implementation | Water Outcome | Sugar‐Sweetened Beverage Outcome |
|---|---|---|---|---|---|---|---|---|
|
Author Year Country |
Source of water Water promotion method Duration Additional details |
Type Armsa Risk of biasb |
Age: range, (mean) Race/nativity: categories SES Gender: % female Other notable characteristics |
Baseline Completed (%completed) |
Measure (DIDc intervention vs control group, or within group post/pre difference, or OR) Value, (CI), P value If adjusted: covariates |
Measure (DID intervention vs control group, or within group post/pre difference, or OR) Value, (CI), P value If adjusted: covariates |
||
| Randomized controlled trial study design | ||||||||
|
Ball 201525 Australia |
Supermarket bottled water: 20% discount Newsletters, online forum, online dietitian consultant in two arms (factorial design) 3 months |
RCT, four‐arm factorial Arms: Intervention group 1: price reduction Intervention group 2: behavior change Intervention group 3: price + behavior Control Low |
National Health and Medical Research Council |
18‐60 y (Mean 43.7) 71.4% Australian born 44.4% live in low‐SES area Annual household income: 24% $A0‐51 999 25.1% $A52 000‐103 999 26.7% > $A104 000 24.2% Undisclosed 100% female |
624 574 (92.0%) |
NR |
Purchase, Consumption (DID [mL/week]) Purchase: price: 203.6 (−87.3, 494.5), P = .170 behavior: 20.0 (−276.0, 316.0), P = .895 both: 31.2 (−255.9, 318.4), P = .831 Consumption:34.0 (−299.0, 367.0), P = .841 98.3 (−259.5, 456.1), P = .59 354.6 (−29.4, 738.5), P = .07 Adjusted for participant catchment area, age, country of birth, marital status, household income, number of children living at home |
Purchase, Consumption (DID [mL/week]) Purchase: price: 386.2 (−52.1, 824.5), P = .084 behavior: 173.0 (−206.4, 552.3), P = .371 both: 881.4 (−686.6, 2449.5), P = .271 Consumption: 73.4 (0.7, 146.2), P = .048 114.5 (24.8, 204.2), P = .012 30.0 (−17.8, 77.7), P = .219 Adjusted for the same covariates |
|
Kenney 201529 United States |
Cup dispensers installed next to school cafeteria water fountains Education and posters 3 weeks |
Cluster RCT Low |
Centers for Disease Control and Prevention, anonymous donation in memory of Melvin R. Seiden |
NR 23% Non‐Hispanic Black 40% Hispanic 24% Non‐ Hispanic White 9% Asian 2% Multiracial 60% Low income school enrollment 52% Female |
NR | Mean duration of the signage component: 20.2 days (range 16 to 23), cup component 15.4 days, (range of 5 to 22). At 2 schools, posters required replacement. Two schools reported problems with stocking the cups consistently. |
Observed consumption (DID [cafeteria‐provided water consumption/student/lunch period, ounces]) 0.58 oz, (0.27, 0.90), P < . 001 Students who take free water during lunch period (DID, [% students]) 9.4%, (4.4, 14.4), P < .001 |
Observation (DID [% students with SSB at lunch table]) −3.3%, (−5.7, −1.0), P < .001 |
|
Geliebter 201326 United States |
Bottled water in supermarket: 50% discount List of discounted products to discount group List of healthy food items to control group 8 weeks |
RCT Some |
Robert Wood Johnson Foundation, Columbia University Institute for Social and EconomicResearch and Policy |
21‐65 y (Mean 37.5) 56% White 19% African American 9% Asian 13% Hispanic 2% Other 2% NR NR 70% female |
67 57 (85.1%) |
NR |
Purchases (DID [dollars/week]), Consumption (DID [grams/day]) No significant group‐by‐time interaction for either purchases (F(2,90) = 2.2, P = .11) nor consumption (F(2,76) = 0.034, P = .97) of discounted noncaloric beverages (Note: means and CI NR) |
Consumption (DID [kcal/day from all caloric beverages]) No significant effect group‐by‐time interaction (F(2,76) = 1.3, P = .28) (Note: means and CI NR) |
|
Patel 201630 United States |
Water dispenser or cooler in school cafeterias with cups Signage, schoolwideaudio announcements, parent newsletter, prizes for students 6 weeks |
Cluster RCT Arms: Intervention group 1: water cooler + cups Intervention group 2: water dispenser + cups Control Some |
Robert Wood Johnson FoundationHealthy Eating Research Program, National Institutes of Health |
Grades 6‐8 (Mean 12.6) 56% Latino/Hispanic 20% African American 16% Asian/Pacific Islander 18% Other NR 53% female |
12 middle schools (605 students) 595 (98.0%) |
NR |
Consumption (OR, DID [% students reporting intake of more than a few sips at lunch]) Dispenser to control: OR = 3.1, (1.4,6.7), P = .004; DID =18.9% Cooler to control: OR = 1.7, (0.8,3.7), P = .17; DID = 10.7% Any intervention to control: OR = 2.3, (1.2,4.5), P = .02; DID = 14.9% Adjusted OR for sociodemographic characteristics: age, sex, race/ethnicity, language spoken at home, and US‐born status |
Consumption (OR, DID [% students reporting intake of more than a few sips at lunch]) Dispenser to control: 1.2, (0.6,2.4), P = .71; DID = 0.6% Cooler to control: 1.1, (0.5, 2.3), P = .78; DID = 1.0% Any intervention to control: 1.1, (0.6,2.1), P = .70: DID = 0.8% OR adjusted for the same covariates |
|
Piernas 201327 United States |
Bottled water provided at monthly meetings Monthly group education sessions: substitute ≥2 servings/d (≥200 kcal) of caloric sweetened beverages with either water (water group) or diet beverages 6 months |
RCT Arms: Intervention group 1: water Intervention group 2: diet beverage Control Some |
Nestle Waters USA, Robert Wood Johnson Foundation, National Institutes of Health |
18‐65 y (Mean 42.3) 40% White 57% African American 5% Other % Education: 7% High school or less 41% Some college 55% College graduate plus 84% Female |
318 234 (73.6%) |
Water group attended 5.2 monthly sessions and diet beverage group 5.4 monthly sessions. |
Consumption (within group changes and DID [mL/day]) Within group changes: water group: 883.5, (CI NR), P < .001 diet beverage group: −79.2, (CI NR), NR Unadjusted across group (water vs diet beverage) change: mean NR, (CI NR), P < .001 Energy, age, and sex adjusted mixed‐effect models for the same outcomes yielded similar results |
Consumption (within group changes and DID [mL/day]) Within group changes: water group: 328.3, (CI NR), P < .001 diet beverage group: 376.0, (CI NR), P < 001 Unadjusted across group change (water vs diet beverage): mean NR, (CI NR), P = .44 Adjusted for same covariates |
|
Pinket 201632 6 European countries |
Water drinking stations at kindergartens, preschools, day care Educational activities for preschoolers, practicing behaviors in class, educational materials for parents 24 weeks |
Cluster RCT Some |
European Commission |
3.5‐5.5y (Mean 4.7) NR Education: 38.5% mothers' education <14 years 48.5% female |
NR (target: 6500) NR |
Mean implementation score for kindergartens was 16.3 (maximum of 30). Mean implementation score for parents/caregivers was 9.5 (maximum of 18). |
Consumption (DID, [mL/day]) 11, (CI NR), P > .01 Adjusted for age, sex, SES, and country |
Consumption (DID, [mL/day]) Prepackaged juice: −23.5, (CI NR), P < .001 soda: −4.9 mL/day (CI NR), P > .01(non‐significant) Adjusted for the same covariates |
|
van de Gaar 201431 Netherlands |
Free water at school, water break during physical education Events, posters, activities, bottles 12 months |
Cluster RCT Some |
ZonMw–Netherlands Organization for Health Research and Development |
Range 6‐12 y, (Mean NR) 34.7% Dutch 48% Non‐Dutch (Turkish/Moroccan) 20% Missing Parent education: 2.5% Unknown 45.0% Low 52.6% High 56.7% Female |
4 primary schools (1175 students) 356 (parent reported data) 387 (child reported data) At least one complete case analysis could be performed for 1009 children (78.3%) |
NR |
Consumption (DID [mL/day]) Parent report 30, (−0.40, 0.80), NR (no P value reported) Child report 10, (−0.40, 070), NR (no P value reported) Adjusted for baseline intake and school‐pair, grade, gender, ethnic background and weight status of the child, and educational level of the caregiver |
Consumption (DID [mL/day and servings per day] or OR) Parent report: −190 mL/day (−280, −100) SSB servings/day (no): −0.54 (−0.82, −0.26)OR: % SSB every day: 0.79 (0.47, 1.34) Child report: 40 mL/day (−100, 190) SSB servings/day (no): 0.05 (−0.36, 0.47) OR: % SSB every day: 1.32 (0.78, 2.24) Observation (% brought SSB to school [OR]) 0.51 (0.36, 0.72) Adjusted for same covariates |
|
Waters 201733 Australia |
Upgraded water taps, provide water at lunch in schools Parent education, water bottles, school policies 3.5 years |
Cluster RCT Some |
Victorian State Government |
5‐12 y NR SES: parent education ≤ grade 10 11.6% maternal 13.5% paternal NR |
24 schools/3167 children 22 schools (91.7%)/2806 children (88.6%) (Note: data collected cross‐sectionally) |
Principals reported 9/12 intervention schools had healthy eating policy (5 of these rated as widely or consistently implemented). 3/12 had written canteen policy. |
Consumption (OR [≥ 2 glasses water/day]) OR: 1.41 (0.78‐2.3), P = .3 Observation (OR [water in lunchbox/canteen order]) 1.71 (1.05‐2.78), P = .03 Adjusted for proportion at baseline, child age and sex, household socioeconomic position, and ethnicity (only English spoken at home). |
Soft drink consumption (OR [% with any consumption on given day]) OR 0.89 (0.60‐1.32), P = .55 Adjusted for the same covariates |
|
Franken 201828 Aruba |
Peer influencers (PIs) promote water consumption PIs received reusable water bottle 8 weeks |
Cluster RCT High |
University of Aruba, European Research Council |
10‐14 y (Mean 11.4) NR NR 52% female |
453 377 (83%) |
NR |
Consumption (DID [glasses/day]) 0.12 (−0.23,0.47), P = .50 |
Consumption (DID [glasses/day]) −0.12 (−0.24, 0.00), P = .04 |
| Nonrandomized controlled trial study design | ||||||||
|
Muckelbauer 200935 Germany |
Water fountain in schools Water bottle, help students fill bottles, education 10 months |
Cluster NRCT Moderate |
German Federal Ministry of Food, Agriculture, and Consumer Protection,Association of the German Gas and Water Industries |
2 and 3rd grades (Mean 8.3) 44% with migrant background Schools located in deprived areas 49.7% female |
32 elementary schools (3190 students) 2950 (92.3%) |
94% of the teachers implemented >1 of the 4 classroom lessons, 85% implemented >2, 16% implemented all. 68% implemented >1 booster session, and 24% of continued them throughout intervention. Daily provision of drinking water in 71% of classes. |
Consumption (DID [glasses/day]) 1.1 glasses/day, (0.7‐1.4), P < .001 Adjusted for immigrational background |
Soft drink consumption (DID [glasses/day]) Value NR, P = .406 (mean and CI NR) Adjusted for same covariate |
|
Patel 201138 United States |
Water dispenser in school cafeterias Reusable water bottles, promotional activities (prizes, art contest, announcements), education. In week 4, added paper cups next to dispensers 5 weeks |
NRCT Moderate |
National Center for Minority Health and Health Disparities, Robert Wood Johnson Clinical Scholars Program |
Range NR (Mean 12.8) 53% Hispanic 22% Asian/Pacific Islander 10% African American 10% Other 63% National School Lunch Program eligibility 55% Female |
405 364 (89.9%) |
NR |
Consumption (OR, DID [% drank water from specified source]): any source: OR = 1.76, (1.2,2.57), P = .003; DID = 9.4% school fountain: OR = 1.45, (1.05, 1.99), P = .02; DID = 8.6% other tap water source: OR = 1.59, (0.93,2.73), P = .09; DID = 3.0% bottled water: OR = 1.03, (0.75,1.41), P = .87; DID = −1.8% reusable water bottle: OR = 1.99, (1.23,3.20), P = .005; DID = 7.8% (note: DID calculated for this review, CI and P value not available) Adjusted OR for intervention status, pre‐intervention consumption of drinking water at school, age, sex, race/ethnicity, primary language spoken at home, and National School Lunch Program eligibility |
Consumption (OR, DID [% drank specified SSB]): soda: OR = 0.89, (0.66,1.2), P = .46; DID = −7.2% sports drink OR = 1.31, (0.97,1.75), P = .08; DID = 6.9% Adjusted for same covariates |
|
De Bourdeaudhuij 201534 8 European countries |
Fountains at schools (with paper cups provided), playgrounds, and public places; encourage water at dinner table; use water bottle during school day Posters in store windows, classroom activities, school paper, kid‐created ads, water drinking “moments” at school during physical education and classes (Note: sites chose which, if any, interventions above to implement) 2 years |
Cluster NRCT Serious |
European Union |
2‐9.9 y (Mean 6.0) 16.2% one parent born abroad 0.3% both parents unemployed or on welfare 49.1% female |
16 288 11 101 (68%) |
Intervention was not delivered with high fidelity, eg, in Belgium much of the program was not received by families. |
Consumption (DID [freq/week pooled across 8 countries]) Boys: Adjusted DID: F = 0.03, no CI, P = .866 (time × condition interaction) (value of adjusted DID not reported) Unadjusted DID (calculated from Table 1): 0.05 times per week Girls: Adjusted DID: F = 1.51, no CI, P = .220 (time × condition interaction) (value of adjusted DID not reported) Unadjusted DID (calculated from Table 1): 0.43 times per week Adjusted for age and parental education level |
Consumption [DID (freq/week pooled across 8 countries]) Boys: DID (adjusted): F = 0.74, no CI, P = .388 (time × condition interaction) (value of adjusted DID not reported) Unadjusted DID (calculated from table 1): −0.16 times per week Girls: DID (adjusted): F = 0.18, no CI, P = .670 (time × condition interaction) (value of adjusted DID not reported) Unadjusted DID (calculated from Table 1): −0.07 times per weekAdjusted for same covariates |
|
Franks 201736 Poland |
63 bottles of water delivered to home Online education sessions and forum for parents 3 weeks for each of two intervention phases |
NRCT with sequential intervention phases Arms: Phase 1: control, information, information + water Phase 2: control, discussion forum Serious |
Danone Research, London School of Economics |
3‐6 y (Mean 4.4) NR NR 50% female |
439 334 (76.1%) |
NR |
Consumption (DID [mL/day]) Information + water provision (at end of this 3‐week intervention) 183.9, SE = 26.8, (131.4, 236.4), P = .0001 Online groups (at end of this 3‐week intervention, in arm that previously received info + water) 136.5, SE = 40.6, (56.9,216.1) P = .001 |
Consumption (within in group change [mL/day]) (note: baseline to one year after enrollment [other time periods not presented nor was DID intervention vs control reported) info + water + groups −171.66, SD = 325 (−246.73‐96.59), P < .0001 control −85.96, SD = 238.46 (−145.80, −26.11), P < .0001 |
|
Loughridge 200537 United Kingdom |
Water cooler in schools Posters and education in school assembly and classes, promotional bottles and pencils in one arm 1 month |
NRCT Arms: Intervention group 1: water and promotion Intervention group 2: water only Control Serious |
Van den Bergh Foods Ltd |
11‐18 y (Mean NR) NR 26% Eligible for free lunch Secondary schools from the most deprived areas NR |
2965 NR |
NR |
Water provided (within group difference [mL/student/school day]) water and promotion group to control: ~117 water and promotion group to water group: ~110 |
Sales (within group difference [mL/student/school day]) water and promotion group to control: ~−15 water and promotion group to water group: ~−5 |
|
Visscher 201039 Netherlands |
Water cooler in schools Free water bottles 16 weeks |
NRCT Serious |
The Ministry of Health of the Netherlands |
12‐19 y (Mean 14) NR NR NR |
5866 NR |
Water coolers worked throughout intervention. 20% of students used water cooler on given day. After 1 week, pupils did not use the water bottles. | NR |
Sales (within group, [mL/pupil/day]) Intervention school 1: −4.4 mL/day Intervention school 2: 1.3 mL/day Intervention school 3: −8.2 mL/day Control school 1: baseline: 0.5 mL/day Control school 2: no follow up data Control school 3: −22.5 mL/day No statistical testing, did not report results pooled across schools |
| Single group pre‐post study design | ||||||||
|
Andersen 201640 Denmark |
Bottled water provided to participants None 12 weeks |
Single group pre‐post (nested in a 4‐arm RCT) High |
The Danish Dairy Board and the Danish Agency for Science, Technology, and Innovation |
12‐15 y (Mean 13.2) NR NR 64% female BMI > 25 kg/m2 |
193 173 (89.6%) |
NR but noted participants drank 95% of water as recorded in self‐report diary. |
Consumption (within group change [mL/day]) 950 (no statistical test reported, reported as participants received 1 L/day and on average consumed 95%) |
Consumption (within group change [g/kg/day]) −2.59, (CI NR), P < .01 |
|
Beets 201441 United States |
Encourage bringing water from home to summer camp Incentives for children (eg, movie tickets, extra swim time), parental and staff education (guide to healthy lunchbox, weekly emails) 11 weeks |
Single group cross‐sectional pre‐post with two post observations High |
National Institutes of Health |
4‐12 y (Mean 7.8) 46% white non‐Hispanic NR 47% female |
Approximately 550 children and 12‐15 staff at 4 camps at each wave (cross‐sectional repeated measures) | 69% of parents aware of program and 75% of staff indicated being trained. |
Children or staff observed bringing to camp (Cross‐sectional difference [absolute percent]) Children: 7.5%, (−4.0,19.0), NR Staff: −5.8%, (−18.2, 7.2), NR |
Children or staff observed bringing to camp (Cross‐sectional difference [absolute percent]) Children soda/pop: −2.5%, (−4.0, −1.0), P < .01 sports: −0.9%, (−5.1, 3.3), NR energy: −0.3, (−0.6, 0.0), NR Staff soda/pop: −10.0%, (−14.5, −5.5), P < .01 sports: −12.1%, (−14.5, −5.5), P < .01 energy: 0 (none observed) |
Table 1. Abbreviations: BMI, body mass index; CI, confidence interval; DID, difference in differences; NR, not reported; NRCT, nonrandomized controlled trial; OR, odds ratio; PIs, peer influencers; RCT, randomized controlled trial; SD, standard deviation, SE, standard error; SES, socioeconomic status; SSB, sugar‐sweetened beverage.
If more than one arm.
Tools used: None if single group study. A single group pre‐post design was classified as high risk of bias based on this criterion alone.
Risk of Bias 2.0 (RoB2.0) for randomized studies.
Risk of Bias In Nonrandomized Studies‐I (ROBINS‐I) for nonrandomized studies.
Detailed information in Table 2.
DID between intervention and control group mean daily volume of water and SSBs consumed or purchased (controlled difference) and single group pre‐post difference (uncontrolled difference).
Participants were primarily children ages 2 to 18 years (14 studies) while three studies enrolled adults.25, 26, 27 Nine studies reported at least one marker of socioeconomic status (SES) and people of low SES comprised at least one‐third of participants in five of these nine studies. Nine studies described the race or nativity of participants and eight of these had 40% or more nonmajority participants.
The most common interventions were water provision, education, and promotion activities (Table 1), and most studies used two or more types of interventions (11 out of 17). 29, 30, 31, 32, 33, 34, 35, 36, 38, 39, 41 Thirteen studies provided water through installation of water dispensers or delivery of bottled water, and some also included ancillary items (eg, cups or water bottles).27, 29, 30, 31, 32, 33, 34, 35, 36, 37, 38, 39, 40 Thirteen studies offered educational and promotional activities at individual, institutional, or community levels such as electronic or printed materials and newsletters, online forums and education sessions, dietitian coaching, prizes and incentives, classroom activities, or posters.25, 27, 29, 30, 31, 32, 33, 34, 35, 36, 37, 38, 41 Eleven studies included both provision and education or promotion.27, 29, 30, 31, 32, 33, 34, 35, 36, 37, 38 Two supermarket‐based studies discounted the price of bottled water (by 20%‐50%), one study used peer influence, and two studies were multilevel, multicomponent community obesity prevention initiatives.
Among all 17 studies, seven showed a statistically significant decrease in SSB consumption/purchase (Table 1).27, 28, 29, 31, 36, 40, 41 Three of these studies described a statistically significant SSB decrease relative to a comparison group.28, 29, 31 The other four studies reported only within‐group significant changes.27, 36, 40, 41 The magnitude of SSB reduction in the seven statistically significant studies included 47.7 mL/day to 190 mL/day, 2.59 g/kg/day, 0.12 “glass” per day, or a 2.5% to 3.3% reduction in proportion of children observed with SSBs in school or camp.
Out of 17 studies, two had low risk of bias. 23, 27 Another eight were at some/moderate risk.24, 25, 28, 29, 30, 31, 33, 36 A final group of seven had high/serious risk of bias (Table 2). 26, 32, 34, 35, 37, 38, 39 Of the 10 studies with low or moderate/some risk of bias, two showed both statistically significant decreases in SSB consumption/purchases and increases in water.27, 29 One reported a decline only in SSBs.31 Three others showed an increase only in water.30, 35, 38 The three studies that reported a decrease in SSBs were heterogeneous in the interventions they employed. One provided free bottled water as a replacement for SSBs.25 Another used posters and signs to promote water consumption and provided cup dispensers next to school cafeteria water fountains.27 The third launched a school‐based water promotion campaign.29 While these 10 studies were not at high/serious risk of bias overall, some forms of bias were present. Sources of bias in the randomized studies included lack of blinding of the participants and outcome assessors as well as incomplete outcome data collection (Figure 2). Sources of bias in the nonrandomized studies included confounding, missing data, and deviations from intended intervention (Figure 3). In addition, they shared other limitations, especially the measurement of SSB consumption.
Table 2.
Quality assessment of 17 included studies a
| Risk of Bias 2.0 for Randomized Studies | ||||||||
|---|---|---|---|---|---|---|---|---|
| Study | Random Sequence Generation (Selection Bias) | Allocation Concealment (Selection Bias) | Blinding of Participants and Personnel (Performance Bias) | Blinding of Outcome Assessment (Detection Bias) | Incomplete Outcome Data | Selective Reporting | Other Bias | Overall Bias |
| Ball 201525 | Low | Low | Low | Low | Low | Low | Low | Low |
| Kenney29 2015 | Low | Low | Low | Some | High | Low | Low | Low |
|
Geliebter 201326 |
Low | Low | Some | Some | Low | Low | Some | Some |
| Patel30 2016 | Low | Some | High | High | Some | Low | Low | Some |
| Piernas 201327 | Low | Low | High | Some | High | Low | Some | Some |
| Pinket32 2016 | Some | Some | High | Some | High | Low | Some | Some |
| van de Gaar 201431 | Some | Low | High | High | Low | Low | Some | Some |
| Waters 201733 | Low | Low | Some | Some | High | Low | Some | Some |
| Franken28 2018 | High | Some | Some | Some | Low | High | Some | High |
| Risk of Bias In Nonrandomized Studies‐I for Nonrandomized Studies | ||||||||
|---|---|---|---|---|---|---|---|---|
| Study | Bias Due to Confounding | Bias in Selection of Participants Into the Study | Bias in Classification of Interventions | Bias Due to Deviations from Intended Interventions | Bias Due to Missing Data | Bias in Measurement of Outcomes | Bias in Selection of the Reported Result | Overall Bias |
| Muckelbauer200935 | Moderate | Low | Low | Moderate | Serious | Moderate | Low | Moderate |
| Patel 201138 | Moderate | Low | Low | Moderate | Moderate | Moderate | Low | Moderate |
| De Bourdeauhuij 201534 | Moderate | Low | Low | Serious | Serious | Moderate | Low | Serious |
| Franks 201736 | Serious | Low | Low | Serious | Serious | Moderate | Low | Serious |
| Loughridge 200537 | Serious | Low | Low | Serious | Moderate | Moderate | Low | Serious |
| Visscher 201039 | Critical | Low | Low | Low | Low | Low | Low | Serious |
Figure 2.
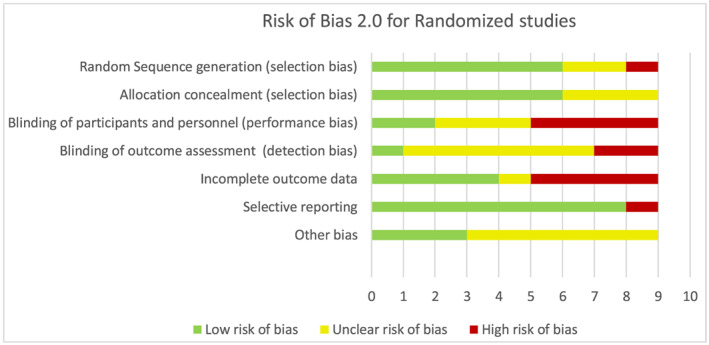
Risk of bias 2.0 for randomized studies
Figure 3.
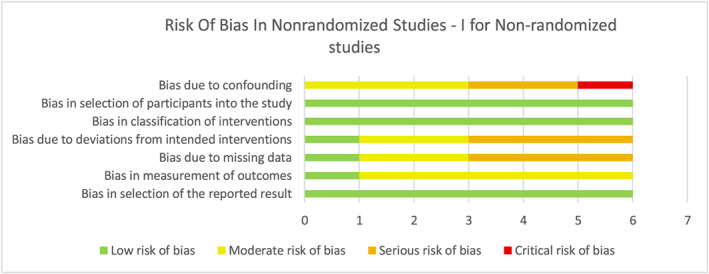
Risk of bias in nonrandomized studies‐I for nonrandomized studies
On a qualitative basis, certain study characteristics appeared associated with reduced SSB purchases or intake. Studies that included water provision, education or promotion, or some combination reported decreased SSB intake more often than water price discounting and community intervention studies, which had no effects (Table 1). Also, the intervention site appeared to be related to the impact on SSB intake (Table 1). All three home‐based studies decreased SSB intake.27, 36, 40
We did not observe a pattern with respect to age (child vs adult), SES (too few studies reported), race/nativity (too few studies reported), duration of intervention (0 months‐1.9 months vs 2 months‐5.9 months vs 6+ months), source of SSB data (questionnaire vs diary; 24‐hour recall vs purchases vs direct observation), and study sponsorship.
Six of the 17 studies increased water intake significantly. 27, 29, 30, 35, 36, 38 Among these, three observed significant decreases in SSB consumption.27, 29, 36 Two of these studies provided bottled water at home and reported relatively large increases in daily water consumption.27, 36 One installed water cup dispensers in schools.29 All three of the studies without an effect on SSBs installed water dispensers (coolers, fountains, etc.) and promoted water in schools and observed only small changes in water consumption.30, 35, 38 Among the 10 studies with low or some/moderate risk of bias, five increased water and two of these reported reductions in SSBs.
4. DISCUSSION
This systematic review of 17 studies found little evidence that interventions aimed at increasing water intake consistently reduce the purchase or consumption of SSBs. The most common interventions were provision of water and water education or promotion activities. Of the 10 studies with low or moderate/some risk of bias, two showed both statistically significant decreases in SSB consumption and increases in water, one reported a decline only in SSBs, and three noted an increase only in water. Among all of the 17 included studies, seven reported a statistically significant decrease in SSB consumption/purchases, although only three of them included a comparison group.
Two previous reviews have summarized the effectiveness of water promotion and SSB reduction interventions. Neither described the effects of the water promotion interventions on SSB consumption, independent of co‐interventions targeting SSBs. Vargas‐Garcia reported on 40 studies with interventions to increase water and/or decrease SSB consumption.14 Eleven of these studies measured water intake, and it was possible to do a meta‐analysis of the seven that included children. In these studies, the interventions increased water intake. However, because six of these seven studies included a SSB intervention, this analysis did not address the question of this review. Cradock recently summarized the evidence from 25 studies aimed at increasing water consumption among children ages 0 to 5 years. 15 Of the 19 studies that positively impacted water consumption, three focused solely on water interventions, too small a number to draw any conclusions about effects on SSBs. Two of these studies showed a decrease in SSB consumption.
This review differs from the Cradock and Vargas‐Garcia reviews in several ways.14, 15 First, this review focused on whether water promotion, absent any SSB co‐intervention, can reduce SSB intake. Second, it included only studies that reported on both water and SSB purchases or intake. Third, it included all age ranges while the review by Cradock focused on children.
If the hypothesis that water promotion decreases SSB intake by increasing water consumption which then leads to SSB reduction through a substitution effect is correct, the expectation is that SSB reduction would be observed primarily in studies that increased water intake. However, the results of this review did not confirm this expectation. Out of six studies that increased water, only three decreased SSB consumption. 27, 29, 36 On the other hand, three studies were identified that decreased SSB consumption despite failing to increase water intake. 28, 31, 41 These studies did not have SSB reduction components, making the mechanism by which they affected SSBs uncertain. In addition, two of them were at high risk of bias. Franken et al posited that “children understand the implicitly promoted message that SSB consumption is in fact unhealthy.”28 The intervention described by Beets et al increased fruit and vegetable consumption, and the authors speculated that the added produce displaced SSBs from the diet.41 In conclusion, SSB consumption did not consistently decrease when water consumption increased and the association of changes in water and SSB intake was inconsistent across studies.
Among the studies in this review, home‐based interventions that included home water delivery were more frequent among studies that reported significant SSB decreases compared with those that did not. This finding suggests that an individually focused, more intensive, and costly intervention may be needed for water promotion to affect SSB intake. Provision of water and water education or promotion activities appeared to decrease SSB intake, compared with lowering the price of water or multicomponent community interventions with a water promotion element.
The included studies had several limitations. They did not define SSBs uniformly. While all definitions included soda, the inclusion or exclusion of other beverages (eg, sports drinks, energy drinks, fruit drinks/cordials, 100% fruit juices, sweetened flavored water, teas, coffee, dairy, or alcohol) differed or was not specifically reported.
Outcome measures for both SSBs and water were not consistent nor optimal. The metric for beverage outcomes was most often volume consumed per day or week, but studies also used calories per day, drinking more than a few sips, number of glasses, participants observed consuming, and volume sold per day or week. Measures in some studies lacked precision, and data were often obtained through lower‐quality methods such as limited food frequency questionnaires and observed consumption. Several studies limited assessment of intake to beverages consumed at the intervention setting and thus did not assess effects on total daily consumption. These limitations may have contributed to the inconsistent effects of water intervention on SSB outcomes that we observed.
Most studies had some/moderate or serious/high risk of bias. Half of the studies did not employ a randomized study design. The most frequent study limitations that contributed to increased risk of bias included lack of blinding, inadequate control for confounding, missing data, and deviations from intended interventions. Many of the nonrandomized studies did not adjust for potential confounding factors.
Most studies were of short duration, and few included postintervention follow‐up to assess durability of intervention effect. In some cases, interventions were incompletely or inconsistently implemented, and most studies did not report on the extent and fidelity of implementation.
Nearly all studies focused on children in educational settings. Thus, there is limited information available on the value of water promotion for reducing SSB intake among adults or in other settings. There were insufficient data to make clear conclusions about comparative effectiveness across different population subgroups. However, studies took place in many countries and included diverse participants, suggesting that findings may be generalizable.
This review is subject to several limitations. Only high‐income or middle‐income countries were included, as they have higher levels of SSB consumption relative to low‐income countries. Grey literature was not searched given the focus on peer‐reviewed publications. A positive study was defined as one that found a statistically significant decrease in SSB consumption or purchases either in comparison to a control group (difference in differences) or in a pre‐post analysis of a single intervention group. While it would have been preferable to include only the former, the limited number of available studies required the use of a more liberal definition. Additionally, the limitation of using statistical significance as the criterion for a positive study is well‐recognized. Finally, some of studies may have been underpowered for detecting changes in water or SSB consumption. Only two studies described a power calculation for water and one for SSBs.29, 30, 31 Overall, studies based power calculations on other outcomes (eg, weight) or did not report a power calculation. In addition, among studies using a clustered design, few described a power calculation that accounted for clustering (eg, used intraclass correlation coefficient).
This review has several strengths. It is the first systematic review to our knowledge that examines whether water promotion, in and of itself, can reduce SSB intake and what intervention characteristics are associated with lower SSB intake. Review guidelines from the Cochrane Collaborative and the National Academies of Medicine were followed.21, 22 Studies were identified using a strategy designed by a medical librarian which was peer‐reviewed and employed inclusive search criteria. Two reviewers independently reviewed studies for selection, extracted data, and rated risk of bias using standard Cochrane tools.
Further research is needed to evaluate the hypothesis that water promotion can decrease SSB consumption, whether independently or synergistically with strategies that directly target SSBs. A randomized controlled trial that uses a factorial design to examine the independent and combined effects of water promotion and SSB reduction strategies on both water and SSB consumption and/or purchases would be a useful addition to the literature. Such a study should include rigorous dietary assessment methods with standard consumption measures that allow for the examination of substitution effects so that impacts on total 24‐hour beverage consumption and possibly overall diet quality can be determined, along with objective measures such as sales data. Ideally, the intervention duration would be least 6 months, and the evaluation would assess postintervention sustainability of any observed effects.
Given the lack of evidence that water promotion alone can decrease SSB consumption, it is prudent to deploy strategies that focus directly on SSBs to reduce SSB consumption. There is evidence that interventions that directly target SSBs (education, decreasing access, and increasing price) reduce SSB consumption.42, 43, 44, 45, 46, 47 Water promotion may have other benefits unrelated to SSB reduction. 11, 46
FUNDING SOURCE
This review was supported in part by Healthy Eating Research, a national program of the Robert Wood Johnson Foundation. The funders played no role in review design; collection, analysis, interpretation of data; writing of the report; or in the decision to submit the paper for publication.
CONFLICT OF INTEREST
The authors declare they have no conflicts of interest.
Supporting information
Appendix S1. Systematic review search strategies for seven databases
ACKNOWLEDGEMENTS
Kelsey Vercammen (Department of Epidemiology, Harvard T.H. Chan School of Public Health) and Carol Mita (Reference Librarian, Countway Library of Medicine, Harvard Medical School) provided peer review of the literature search strategy.
A systematic review of the effectiveness of promoting water intake to reduce sugar‐sweetened beverage consumption. Obes Sci Pract. 2020;6:229–246. 10.1002/osp4.397
REFERENCES
- 1. Luger M, Lafontan M, Bes‐Rastrollo M, Winzer E, Yumuk V, Farpour‐Lambert N. Sugar‐sweetened beverages and weight gain in children and adults: a systematic review from 2013 to 2015 and a comparison with previous studies. Obes Facts. 2017;10:674‐693. 10.1159/000484566 [DOI] [PMC free article] [PubMed] [Google Scholar]
- 2. Malik VS, Popkin BM, Bray GA, Despres JP, Willett WC, Hu FB. Sugar‐sweetened beverages and risk of metabolic syndrome and type 2 diabetes: a meta‐analysis. Diabetes Care. 2010;33:2477‐2483. 10.2337/dc10-1079 [DOI] [PMC free article] [PubMed] [Google Scholar]
- 3. Yang Q, Zhang Z, Gregg EW, Flanders WD, Merritt R, Hu FB. Added sugar intake and cardiovascular diseases mortality among US adults. JAMA Intern Med. 2014;174:516‐524. 10.1001/jamainternmed.2013.13563 [DOI] [PMC free article] [PubMed] [Google Scholar]
- 4. Bernabe E, Vehkalahti MM, Sheiham A, Aromaa A, Suominen AL. Sugar‐sweetened beverages and dental caries in adults: a 4‐year prospective study. J Dent. 2014;42:952‐958. 10.1016/j.jdent.2014.04.011 [DOI] [PubMed] [Google Scholar]
- 5. Bleich SN, Vercammen KA. The negative impact of sugar‐sweetened beverages on children's health: an update of the literature. BMC obesity. 2018;Feb 20;5:6 10.1186/s40608-017-0178-9 [DOI] [PMC free article] [PubMed] [Google Scholar]
- 6. Keybridge . 2025 Beverage Calories Initiative: Report on 2017 Progress toward National Calorie Goal. 2018. http://keybridgedc.com/wp-content/uploads/2018/08/BCI-2017-National-Progress-Report.pdf.
- 7. Rosinger A, Herrick K, Gahche J, Park S. Sugar‐sweetened beverage consumption among U.S. adults, 2011‐2014. Centers for Disease Control and Prevention; 2017. No. 270. https://www.cdc.gov/nchs/data/databriefs/db270.pdf.
- 8. Rosinger A, Herrick K, Gahche J, Park S. Sugar‐sweetened beverage consumption among U.S. youth, 2011‐2014. Centers for Disease Control and Prevention; 2017. No. 271. https://www.cdc.gov/nchs/data/databriefs/db271.pdf.
- 9. Park S, Xu F, Town M, Blanck HM. Prevalence of sugar‐sweetened beverage intake among adults—23 states and the District of Columbia, 2013. MMWR Morb Mortal Wkly Rep. 2016;65:169‐174. 10.15585/mmwr.mm6507a1 [DOI] [PubMed] [Google Scholar]
- 10. von Philipsborn P, Stratil JM, Burns J, Busert LK, Pfadenhauer LM, Polus S, Holzapfel C, Hauner H, Rehfuess E. Environmental interventions to reduce the consumption of sugar‐sweetened beverages and their effects on health. Cochrane Database of Systematic Reviews 2019, Issue 6. Art. No.: CD012292. DOI: 10.1002/14651858.CD012292.pub2. [DOI] [PMC free article] [PubMed]
- 11. Popkin BM, D'Anci KE, Rosenberg IH. Water, hydration, and health. Nutr Rev. 2010;68:439‐458. 10.1111/j.1753-4887.2010.00304.x [DOI] [PMC free article] [PubMed] [Google Scholar]
- 12. Zheng M, Allman‐Farinelli M, Heitmann BL, Rangan A. Substitution of sugar‐sweetened beverages with other beverage alternatives: a review of long‐term health outcomes. J Acad Nutr Diet. 2015;115:767‐779. 10.1016/j.jand.2015.01.006 [DOI] [PubMed] [Google Scholar]
- 13. Daniels MC, Popkin BM. Impact of water intake on energy intake and weight status: a systematic review. Nutr Rev. 2010;68:505‐521. 10.1111/j.1753-4887.2010.00311.x [DOI] [PMC free article] [PubMed] [Google Scholar]
- 14. Vargas‐Garcia EJ, Evans CEL, Prestwich A, Sykes‐Muskett BJ, Hooson J, Cade JE. Interventions to reduce consumption of sugar‐sweetened beverages or increase water intake: evidence from a systematic review and meta‐analysis. Obesity reviews: an Official Journal of the International Association for the Study of Obesity. 2017;18:1350‐1363. 10.1111/obr.12580 [DOI] [PubMed] [Google Scholar]
- 15. Cradock AL, Poole MK, Agnew KE, et al. A systematic review of strategies to increase drinking water access and consumption among 0‐ to 5‐year olds. Obes Rev. 2019. Sep;20:1262‐1286. 10.1111/obr.12833 [DOI] [PubMed] [Google Scholar]
- 16. Dibay Moghadam S, Krieger, JW . Water review for sugar‐sweetened beverage reduction research team search strategy. 2018; http://www.healthyfoodamerica.org/water_and_sugary_drinks_report
- 17. DAC List of ODA Recipients. http://www.oecd.org/dac/financing-sustainable-development/development-finance-standards/DAC_List_ODA_Recipients2018to2020_flows_En.pdf
- 18. Institute of Medicine . Finding what works in health care: standards for systematic reviews. Washington, DC: The National Academies Press; 2011. [PubMed] [Google Scholar]
- 19. Covidence systematic review software, Veritas Health Innovation, Melbourne, Australia. Available at www.covidence.org. [Google Scholar]
- 20. Riva JJ, Malik KM, Burnie SJ, Endicott AR, Busse JW. What is your research question? An introduction to the PICOT format for clinicians. J Can Chiropr Assoc. 2012;56:167‐171. [PMC free article] [PubMed] [Google Scholar]
- 21. Higgins JPT, Green S. Cochrane Handbook for Systematic Reviews of Interventions Version 5.1.0 The Cochrane Collaboration; 2011.
- 22. National Academies of Medicine . Standards for Systematic Reviews. Washington (DC): National Academies Press (US); 2011. [Google Scholar]
- 23. Sterne JAC, Savović J, Page MJ, et al. RoB 2: a revised tool for assessing risk of bias in randomised trials. BMJ 2019;366: l4898 10.1136/bmj.l4898 [DOI] [PubMed] [Google Scholar]
- 24. Sterne JA, Hernan MA, Reeves BC, et al. ROBINS‐I: a tool for assessing risk of bias in non‐randomised studies of interventions. BMJ (Clinical research ed). 2016;355:i4919 10.1136/bmj.i4919 [DOI] [PMC free article] [PubMed] [Google Scholar]
- 25. Ball K, McNaughton SA, Le HN, et al. Influence of price discounts and skill‐building strategies on purchase and consumption of healthy food and beverages: outcomes of the Supermarket Healthy Eating for Life randomized controlled trial. Am J Clin Nutr. 2015;101:1055‐1064. https://doi:10.3945/ajcn.114.096735 [DOI] [PubMed] [Google Scholar]
- 26. Geliebter A, Ang I, Bernales‐Korins M, et al. Supermarket discounts of low‐energy density foods: effects on purchasing, food intake, and body weight. Obesity. 2013;21:E542‐E548. 10.1002/oby.20484 [DOI] [PubMed] [Google Scholar]
- 27. Piernas C, Tate D, Wang X, Popkin B. Does diet‐beverage intake affect dietary consumption patterns? Results from the Choose Healthy Options Consciously Everyday (CHOICE) randomized clinical trial1‐3. Am J Clin Nutr. 2013;97:604‐611. 10.3945/ajcn.112.048405 [DOI] [PMC free article] [PubMed] [Google Scholar]
- 28. Franken SCM, Smit CR, Buijzen M. Promoting water consumption on a Caribbean Island: an intervention using children's social networks at schools. Int J Environ Res Public Health. 2018;15(4):713 Pii:E713 10.3390/ijerph15040713. [DOI] [PMC free article] [PubMed] [Google Scholar]
- 29. Kenney EL, Gortmaker SL, Carter JE, Howe MC, Reiner JF, Cradock AL. Grab a cup, fill it up! An intervention to promote the convenience of drinking water and increase student water consumption during school lunch. Am J Public Health. 2015;105:1777‐1783. 10.2105/AJPH.2015.302645 [DOI] [PMC free article] [PubMed] [Google Scholar]
- 30. Patel AI, Grummon AH, Hampton KE, Oliva A, McCulloch CE, Brindis CD. A Trial of the Efficacy and Cost of Water Delivery Systems in San Francisco Bay Area Middle Schools, 2013. Prev Chronic Dis. 2016;13:160108 10.5888/pcd13.160108 [DOI] [PMC free article] [PubMed] [Google Scholar]
- 31. van de Gaar VM, Jansen W, van Grieken A, Borsboom G, Kremers S, Raat H. Effects of an intervention aimed at reducing the intake of sugar‐sweetened beverages in primary school children: a controlled trial. The international journal of behavioral nutrition and physical activity. 2014;11:98 10.1186/s12966-014-0098-8 [DOI] [PMC free article] [PubMed] [Google Scholar]
- 32. Pinket AS, Van Lippevelde W, De Bourdeaudhuij I, et al. Effect and process evaluation of a cluster randomized control trial on water intake and beverage consumption in preschoolers from six European countries: the ToyBox‐Study. PLoS ONE. 2016;11:e0152928 10.1371/journal.pone.0152928 [DOI] [PMC free article] [PubMed] [Google Scholar]
- 33. Waters E, Gibbs L, Tadic M, et al. Cluster randomised trial of a school‐community child health promotion and obesity prevention intervention: findings from the evaluation of fun 'n healthy in Moreland! BMC Public Health. 2017;18:92 10.1186/s12889-017-4625-9 [DOI] [PMC free article] [PubMed] [Google Scholar]
- 34. De Bourdeaudhuij I, Verbestel V, De Henauw S, et al. Behavioural effects of a community‐oriented setting‐based intervention for prevention of childhood obesity in eight European countries. Main results from the IDEFICS study. Obes Rev. 2015;16:30‐40. 10.1111/obr.12347 [DOI] [PubMed] [Google Scholar]
- 35. Muckelbauer R, Libuda L, Clausen K, Toschke A, Reinehr T, Kersting M. Promotion and provision of drinking water in schools for overweight prevention: randomized, controlled cluster trial. Pediatrics. 2009;123:e661‐e667. 10.1542/peds.2008-2186 [DOI] [PubMed] [Google Scholar]
- 36. Franks B, Lahlou S, Bottin JH, Guelinckx I, Boesen‐Mariani S. Increasing water intake in pre‐school children with unhealthy drinking habits: a year‐long controlled longitudinal field experiment assessing the impact of information, water affordance, and social regulation. Appetite. 2017;116:205‐214. 10.1016/j.appet.2017.04.019 [DOI] [PubMed] [Google Scholar]
- 37. Loughridge J, Barratt J. Does the provision of cooled filtered water in secondary school cafeterias increase water drinking and decrease the purchase of soft drinks? J Hum Nutr Diet. 2005;18:281‐286. 10.1111/j.1365-277X.2005.00622.x [DOI] [PubMed] [Google Scholar]
- 38. Patel AI, Bogart LM, Elliott MN, et al. Increasing the availability and consumption of drinking water in middle schools: a pilot study. Prev Chronic Dis. 2011;8(3):A60 http://www.cdc.gov/pcd/issues/2011/may/10_0105.htm. Accessed January 2, 2020. [PMC free article] [PubMed] [Google Scholar]
- 39. Visscher TL, van Hal WC, Blokdijk L, Seidell JC, Renders CM, Bemelmans WJ. Feasibility and impact of placing water coolers on sales of sugar‐sweetened beverages in Dutch secondary school canteens. Obes Facts. 2010;3:109‐115. 10.1159/000300848 [DOI] [PMC free article] [PubMed] [Google Scholar]
- 40. Andersen LB, Arnberg K, Trolle E, et al. The effects of water and dairy drinks on dietary patterns in overweight adolescents. Int J Food Sci Nutr. 2016;67:314‐324. 10.3109/09637486.2016.1150435 [DOI] [PubMed] [Google Scholar]
- 41. Beets MW, Tilley F, Weaver RG, Turner‐McGrievy GM, Moore JB. Increasing fruit, vegetable and water consumption in summer day camps—3‐year findings of the healthy lunchbox challenge. Health Educ Res. 2014;29:812‐821. 10.1093/her/cyu026 [DOI] [PMC free article] [PubMed] [Google Scholar]
- 42. Vercammen KA, Frelier JM, Lowery CM, Moran AJ, Bleich SN. Strategies to reduce sugar‐sweetened beverage consumption and increase water access and intake among young children: perspectives from expert stakeholders. Public Health Nutr. 2018;21:3440‐3449. 10.1017/S1368980018002604 [DOI] [PMC free article] [PubMed] [Google Scholar]
- 43. Silver LD, Ng SW, Ryan‐Ibarra S, et al. Changes in prices, sales, consumer spending, and beverage consumption one year after a tax on sugar‐sweetened beverages in Berkeley, California, US: a before‐and‐after study. PLoS Med. 2017;14:e1002283 10.1371/journal.pmed.1002283 [DOI] [PMC free article] [PubMed] [Google Scholar]
- 44. Colchero MA, Rivera‐Dommarco J, Popkin BM, Ng SW. In Mexico, evidence of sustained consumer response two years after implementing a sugar‐sweetened beverage tax. Health affairs (Project Hope). 2017;36:564‐571. 10.1377/hlthaff.2016.1231 [DOI] [PMC free article] [PubMed] [Google Scholar]
- 45. Long MW, Gortmaker SL, Ward ZJ, et al. Cost effectiveness of a sugar‐sweetened beverage excise tax in the U.S. Am J Prev Med. 2015;49:112‐123. 10.1016/j.amepre.2015.03.004 [DOI] [PMC free article] [PubMed] [Google Scholar]
- 46. Kirkpatrick SI, Raffoul A, Maynard M, Lee KM, Stapleton J. Gaps in the evidence on population interventions to reduce consumption of sugars: a review of reviews. Nutrients. 2018;10:1036 pii: E1036. 10.3390/nu10081036 [DOI] [PMC free article] [PubMed] [Google Scholar]
- 47. Schwartz MB, Schneider GE, Choi YY, et al. Association of a community campaign for better beverage choices with beverage purchases from supermarkets. JAMA Intern Med. 2017;177:666‐674. https://doi:10.1001/jamainternmed.2016.9650 [DOI] [PMC free article] [PubMed] [Google Scholar]
Associated Data
This section collects any data citations, data availability statements, or supplementary materials included in this article.
Supplementary Materials
Appendix S1. Systematic review search strategies for seven databases