Abstract
Histamine plays a major role in the mediation of allergic reactions such as peripheral inflammation. This classical monoamine is also a neurotransmitter involved in the central nervous system but its role in this context is poorly understood. Studying histamine neurotransmission is important due to its implications in many neurological disorders. The sensitivity, selectivity and high temporal resolution of fast scan cyclic voltammetry (FSCV) offer many advantages for studying electroactive neurotransmitters. Histamine has previously been studied with FSCV; however, the lack of a robust Faradaic electrochemical signal makes it difficult to selectively identify histamine in complex media, as found in vivo. In this work, we optimize an electrochemical waveform that provides a stimulation-locked and unique electrochemical signal towards histamine. We describe in vitro waveform optimization and a novel in vivo physiological model for stimulating histamine release in the mouse premammillary nucleus via stimulation of the medial forebrain bundle. We demonstrate that a robust signal can be used to effectively identify histamine and characterize its in vivo kinetics.
Introduction
The central nervous system holds four aminergic systems: dopamine, serotonin, norepinephrine and histamine. These messengers are in an intricate chemical interplay with one another and other neurotransmitters to precisely modulate many aspects of brain function. It is critical to understand the fundamental neurochemistry of these four modulatory systems to better prevent, diagnose and treat brain disorders and diseases. Fast scan cyclic voltammetry (FSCV) at carbon fiber microelectrodes (CFMs) is a uniquely powerful method for in vivo analysis. CFMs are biocompatible, cause negligible damage to brain tissue and, because of their kinetically favorable surface kinetics, provide real-time output of electroactive neurotransmitters.
Over the past three decades the dopaminergic system has been extensively studied using FSCV leading to breakthroughs in understanding dopaminergic mechanisms in the brain.1–3 More recently, FSCV has been developed for the detection of serotonin and norepinephrine4,5 and many important aspects of the two neurotransmitters are thus being unearthed.6–10 Histamine is also an electroactive amine, and there have been previous reports on histamine induced FSCV signals in mast cells,11–13 brain tissue slice preparations14 and in vivo,15 however mechanistic studies on histamine are limited. This is primarily because histamine electrochemistry is complex, and FSCV induced histamine signals are often interpreted via changes in the capacitative current on the electrode surface. This approach is fully quantitative, however many analytes induce a capacitative change at the electrode surface limiting selectivity and rendering in vivo studies very difficult.
Faradaic electrochemistry more selectively identifies analytes because of the unique potential position of redox peaks.16 In this paper, we discuss the relevance of histamine adsorption to capacitative currents at CFMs. We describe a novel FSCV waveform that generates a robust oxidation peak in response to histamine. We show in vitro that histamine can be detected selectively and with high sensitivity. Finally, we report and verify a robust histamine signature in the mouse premammillary nucleus (PM) in response to medial forebrain bundle (MFB) stimulation.
Our novel FSCV waveform for histamine provides a tool that will enable the same level of investigation for histamine as other, more established brain amines. Histamine’s role in the brain, in particular with respect to disorders in which it is implicated (e.g. Alzheimer’s disease), can thus be systematically studied.
Experimental section
Chemicals and reagents
Standard solutions were prepared by dissolving histamine dihydrochloride, dopamine hydrochloride, serotonin hydrochloride and adenosine hydrochloride (Sigma-Aldrich, Co., MO, USA) respectively in Tris-buffer containing 15 mM H2NC-(CH2)(OH)3·HCl, 140 mM NaCl, 3.25 mM KCl, 1.2 mM CaCl2, 1.25 mM NaH2PO4·H2O, 1.2 mM MgCl2 and 2.0 mM Na2SO4 at pH = 7.4 in deionized water (EMD Chemicals Inc., NJ, USA).
Carbon-fiber microelectrodes (CFMs)
CFMs were fabricated with 7 μm diameter carbon-fibers (Good-fellow Corporation, PA, USA) aspirated into glass capillaries (0.6 mm external diameter, 0.4 mm internal diameter, A-M systems, Inc., Sequim, WA). A carbon-glass seal was formed via a vertical micropipette puller (Narishige Group, Tokyo, Japan). The exposed length of the carbon fiber was trimmed to 150 μm under an optical microscope. Microelectrodes were electro-plated with Nafion as described previously.4
Data collection/analysis
Waveform generation was via a PCIe-6341 DAC/ADC Card (National Instruments, Austin, TX). The output current was measured by using a Chem-Clamp potentiostat (Dagan Corporation, MN). Custom built software was employed to drive the hardware, collect data and perform analysis including background subtraction, signal averaging and digital filtering (Knowmad Technologies LLC, Tucson, AZ). All potentials are quoted with respect to Ag/AgCl reference electrodes, which were fabricated via electrodeposition of Cl− by holding a silver wire (A-M systems, WA) at 4.0 V for 5 seconds in 1 M HCl. All data with error bars represent the standard error of the mean (SEM). Statistical differences were determined using one-tailed Student’s t-tests on paired datasets (p < 0.05 was taken as statistically different).
Langmuir adsorption isotherms
A CFM was placed in histamine solution of standard concentration and an optimized histamine waveform was applied. An electronic relay (ADG-419, Analog Devices) was used to switch between the applied waveform and a constant potential (−0.5 V) for 10 seconds to allow histamine adsorption at the electrode surface and reach equilibrium. After 10 seconds, the waveform was reapplied, and the first background-subtracted cyclic voltammogram was collected and analyzed for total adsorbed histamine. Inhouse LabVIEW 2012 software integrated the oxidation peak from the background subtracted cyclic voltammogram and Faraday’s law was used to convert this to a surface concentration (Γhistamine). Measured data were fit to a linearized Langmuir adsorption isotherm as previously described,17 and K is the equilibrium constant for adsorption. This experiment was performed in tris buffer (15 mM).
Flow injection analysis
In vitro analyses were performed using flow injection analysis (FIA). CFMs were inserted into a flangeless short 1/8 nut (PEEK P-335, IDEX, Middleboro, MA) such that around 2 mm of the tip remained exposed outside of the nut. The micro-electrode-containing nut was then fastened to a modified HPLC union (Elbow PEEK 3432, IDEX, Middleboro, MA). The other end of the elbow union was fastened to the out-flowing stream of the FIA buffer and two holes were drilled into the union for the incorporation of the reference electrode and for the ‘waste’ flow stream. The flow was maintained with a syringe infusion pump (KD Scientific, Model KDS-410, Holliston, MA) at 2 mL min−1. A rectangular pulse of an analyte was introduced into the flow stream for 10 seconds via a six-port HPLC loop injector (Rheodyne Model 7010 valve, VICI, Houston, TX). For calibrations and waveform optimization, analytes were injected in random concentrations in order to avoid carry-over effects.
Potentiometry
The open circuit potential between CFMs and Ag/AgCl was measured using a potentiostat with an integrated high impedance amplifier (eDAQ Pty Ltd, NSW, Australia). 200 μM of histamine was injected into the CFM in Tris-buffer using FIA at pH = 7.4. Subsequent injections were performed only after the potential returned to baseline.
Animal surgeries
Handling and surgery of male C57BL/6J mice weighing 20–25 g (Jackson Laboratory, Bar Harbor, ME) were in agreement with The Guide for the Care and Use of Laboratory Animals, and approved by the Institutional Animal Care and Use Committee.
Urethane (25% dissolved in 0.9% NaCl solution, Hospira, Lake Forest, IL) was administered via intraperitoneal (i.p.) injection, and stereotaxic surgery (David Kopf Instruments, Tujunga, CA) was performed. A heating pad sustained mouse body temperature around 37 °C (Braintree Scientific, Braintree, MA). Stereotaxic coordinates were taken in reference to bregma. A Nafion modified CFM was inserted into the PM (AP: −2.45, ML: +0.50, DV: −5.45 to −5.55). A stainless steel stimulating electrode (diameter: 0.2 mm, Plastics One, Roanoke, VA) was positioned into the MFB (AP: −1.07, ML: +1.10, DV: −5.00). 120 Biphasic pulses were applied through a linear constant current stimulus isolator (NL800A, Neurolog, Medical Systems Corp., Great Neck, NY). The 60 Hz trains were 350 μA for each phase, with 2 ms in width and 2 s in length. An Ag/AgCl reference electrode was implanted into the brain’s opposite hemisphere.
Drugs
Tacrine hydrochloride (2 mg kg−1) and thioperamide maleate (20 mg kg−1) from Tocris Bioscience (Bristol, UK) were dissolved in saline and injected i.p. at a volume of 0.6 ml kg−1.
Results and discussion
Histamine adsorption onto CFMs underlies capacitative FSCV current
Histamine has previously been detected in mast cells and neural tissues using FSCV.11–15 In the majority of these studies the oxidation peak that appeared at or after the switching potential on the positive wave, as illustrated in Fig. 1, was used for quantification. Fig. 1Ai is a FSCV color plot during flow injection of histamine (20 μM) onto a CFM with a serotonin sensitive waveform.18 The interpretation of color plots is described in detail elsewhere;19 briefly, the potential is displayed on the y-axis, time on the x-axis and current in false color and injection time is denoted by the star.
Fig. 1.
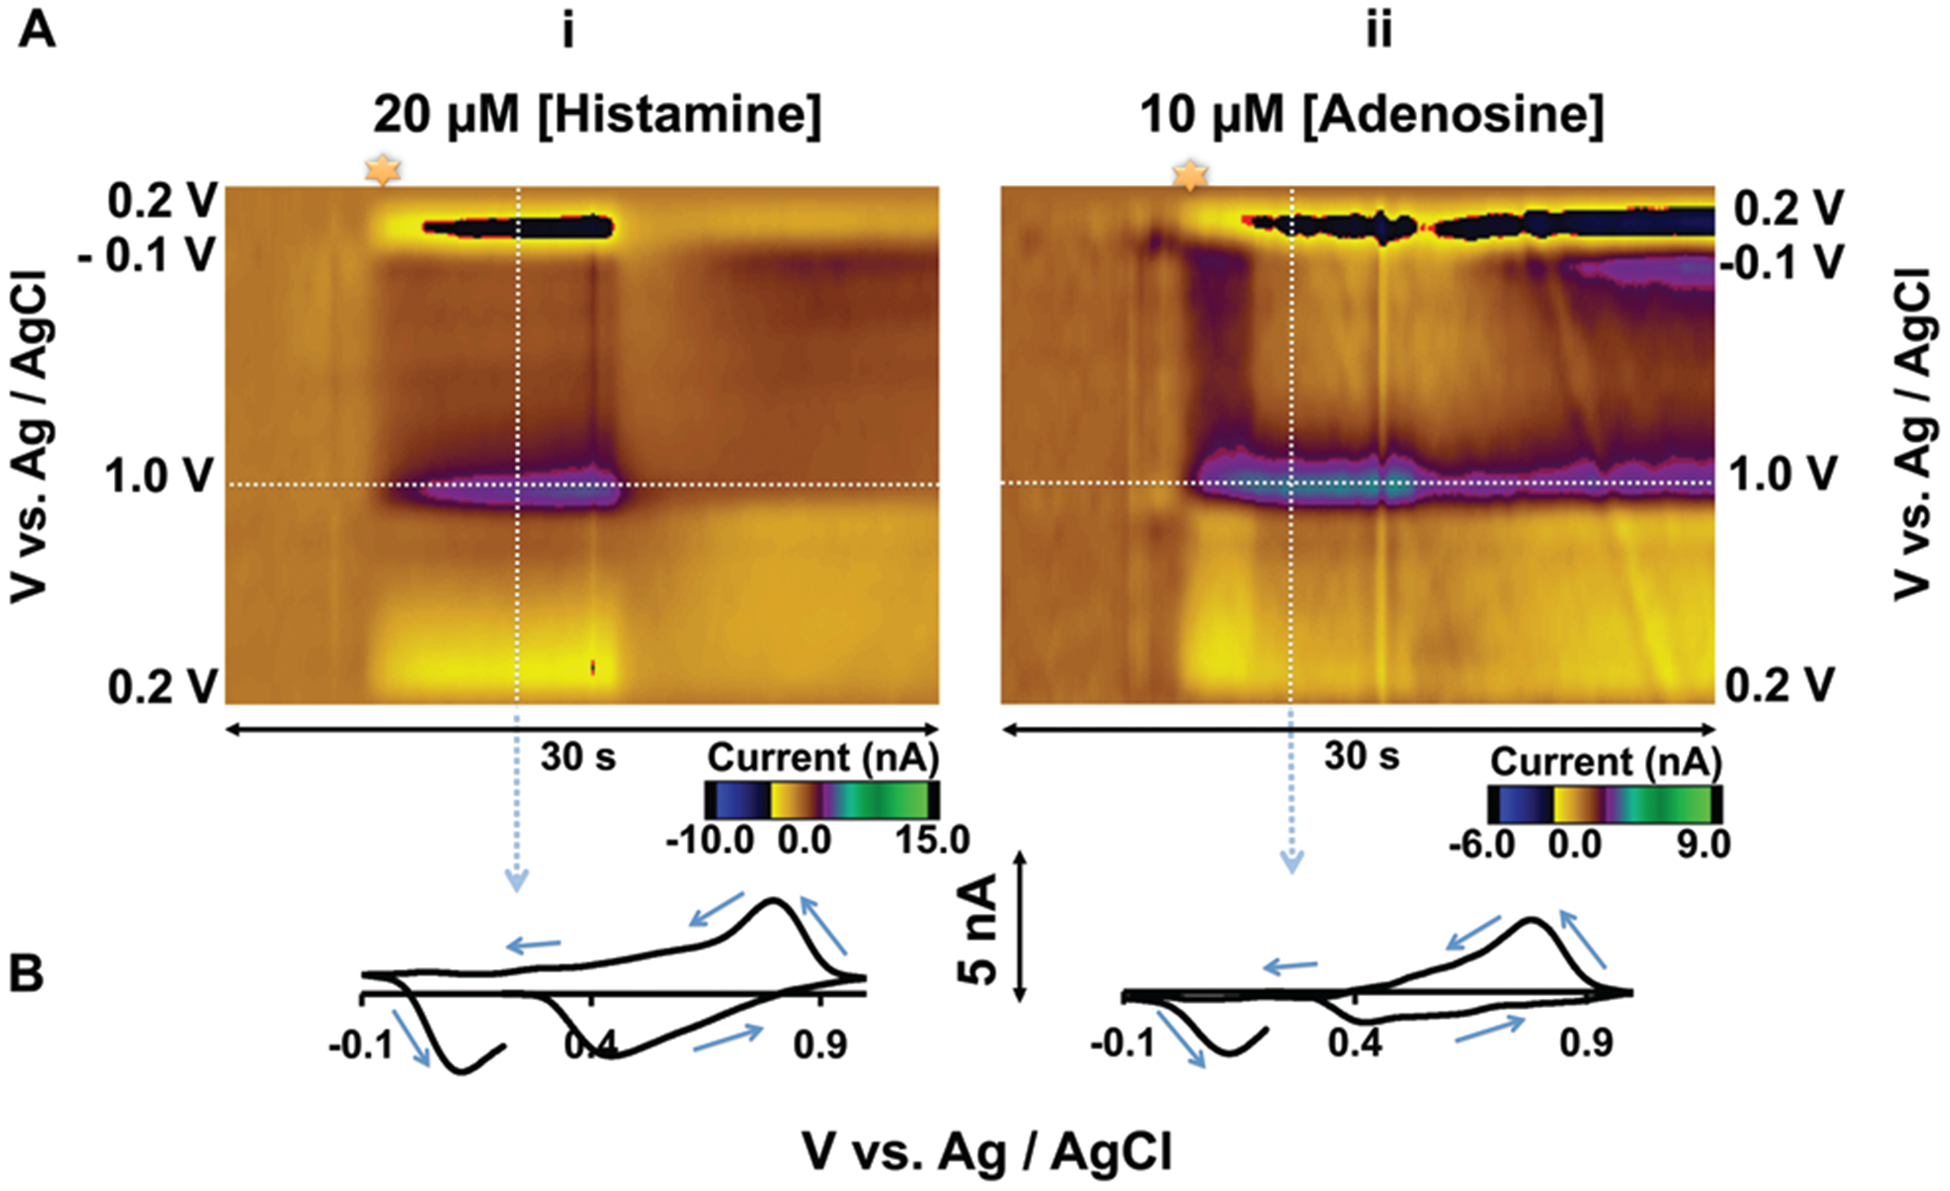
(A) Color plots for FIA of (i) 20 μM histamine, (ii) 10 μM adeno-sine. (B) CVs extracted from the vertical dashed lines from (i) and (ii).
A cyclic voltammogram (CV) taken from the vertical white dashed line of the color plot displays an oxidation peak at around 0.8 V that appears after the switching potential (on the returning positive scan). In previous work, a stimulation-locked signal in the rat substantia nigra (SNr) displayed a similar CV and was pharmacologically determined to be histamine.15 In the absence of pharmacology, however, it is not possible to selectively verify histamine with this waveform because other electroactive species give identical CVs. Fig. 1Aii is a color plot taken during FIA of adenosine (10 μM). The corresponding CV (Fig. 1B) is almost identical to that of histamine. In a region containing both adenosine and histamine, it is not possible to distinguish between these analytes electro-chemically. Furthermore, other work has shown similar CVs for H2O2and gonadotropin-releasing hormone20,21 further complicating selective histamine detection.
Histamine electrochemistry is kinetically limited within the oxidation potential window of previously utilized waveforms. In fact the electrochemical oxidation scheme for histamine is not known, presumably because it involves charge transfer. We therefore postulate that the peaks observed in Fig. 1 are due to non-Faradaic processes. These processes arise on the CFM surface when spontaneous adsorption of histamine causes changes in the electrical bilayer. The electrical bilayer on electrode surfaces acts as a capacitor, discharging current into the electrode, particularly at switching potentials. Capacitative or charging currents are a well-known phenomenon in FSCV because of the high scan rates employed.16 FSCV is background-subtracted specifically to remove such background charging currents which do not reflect Faradaic processes associated with the analytes of interest. However, adsorption of histamine changes the background capacitative current which cannot be subtracted-out, this effect manifests as the features in the CVs in Fig. 1.
In Fig. 2, FIA was utilized to inject histamine (200 μM) into CFMs while the open field potential was measured vs. Ag/AgCl (Fig. 2A). Fig. 2B shows that the potential of the CFMs rapidly peaks in response to histamine injections. Because there is no driving potential, it implies that histamine spontaneously adsorbs and changes the potential of the CFM. The features on histamine’s CV in Fig. 1 are likely a consequence of the current that arises from this adsorption. To further verify this histamine adsorption, Langmuir isotherms were constructed for histamine with a previously described method17 confirming monolayer coverage of the CFM (Fig. 2C).
Fig. 2.
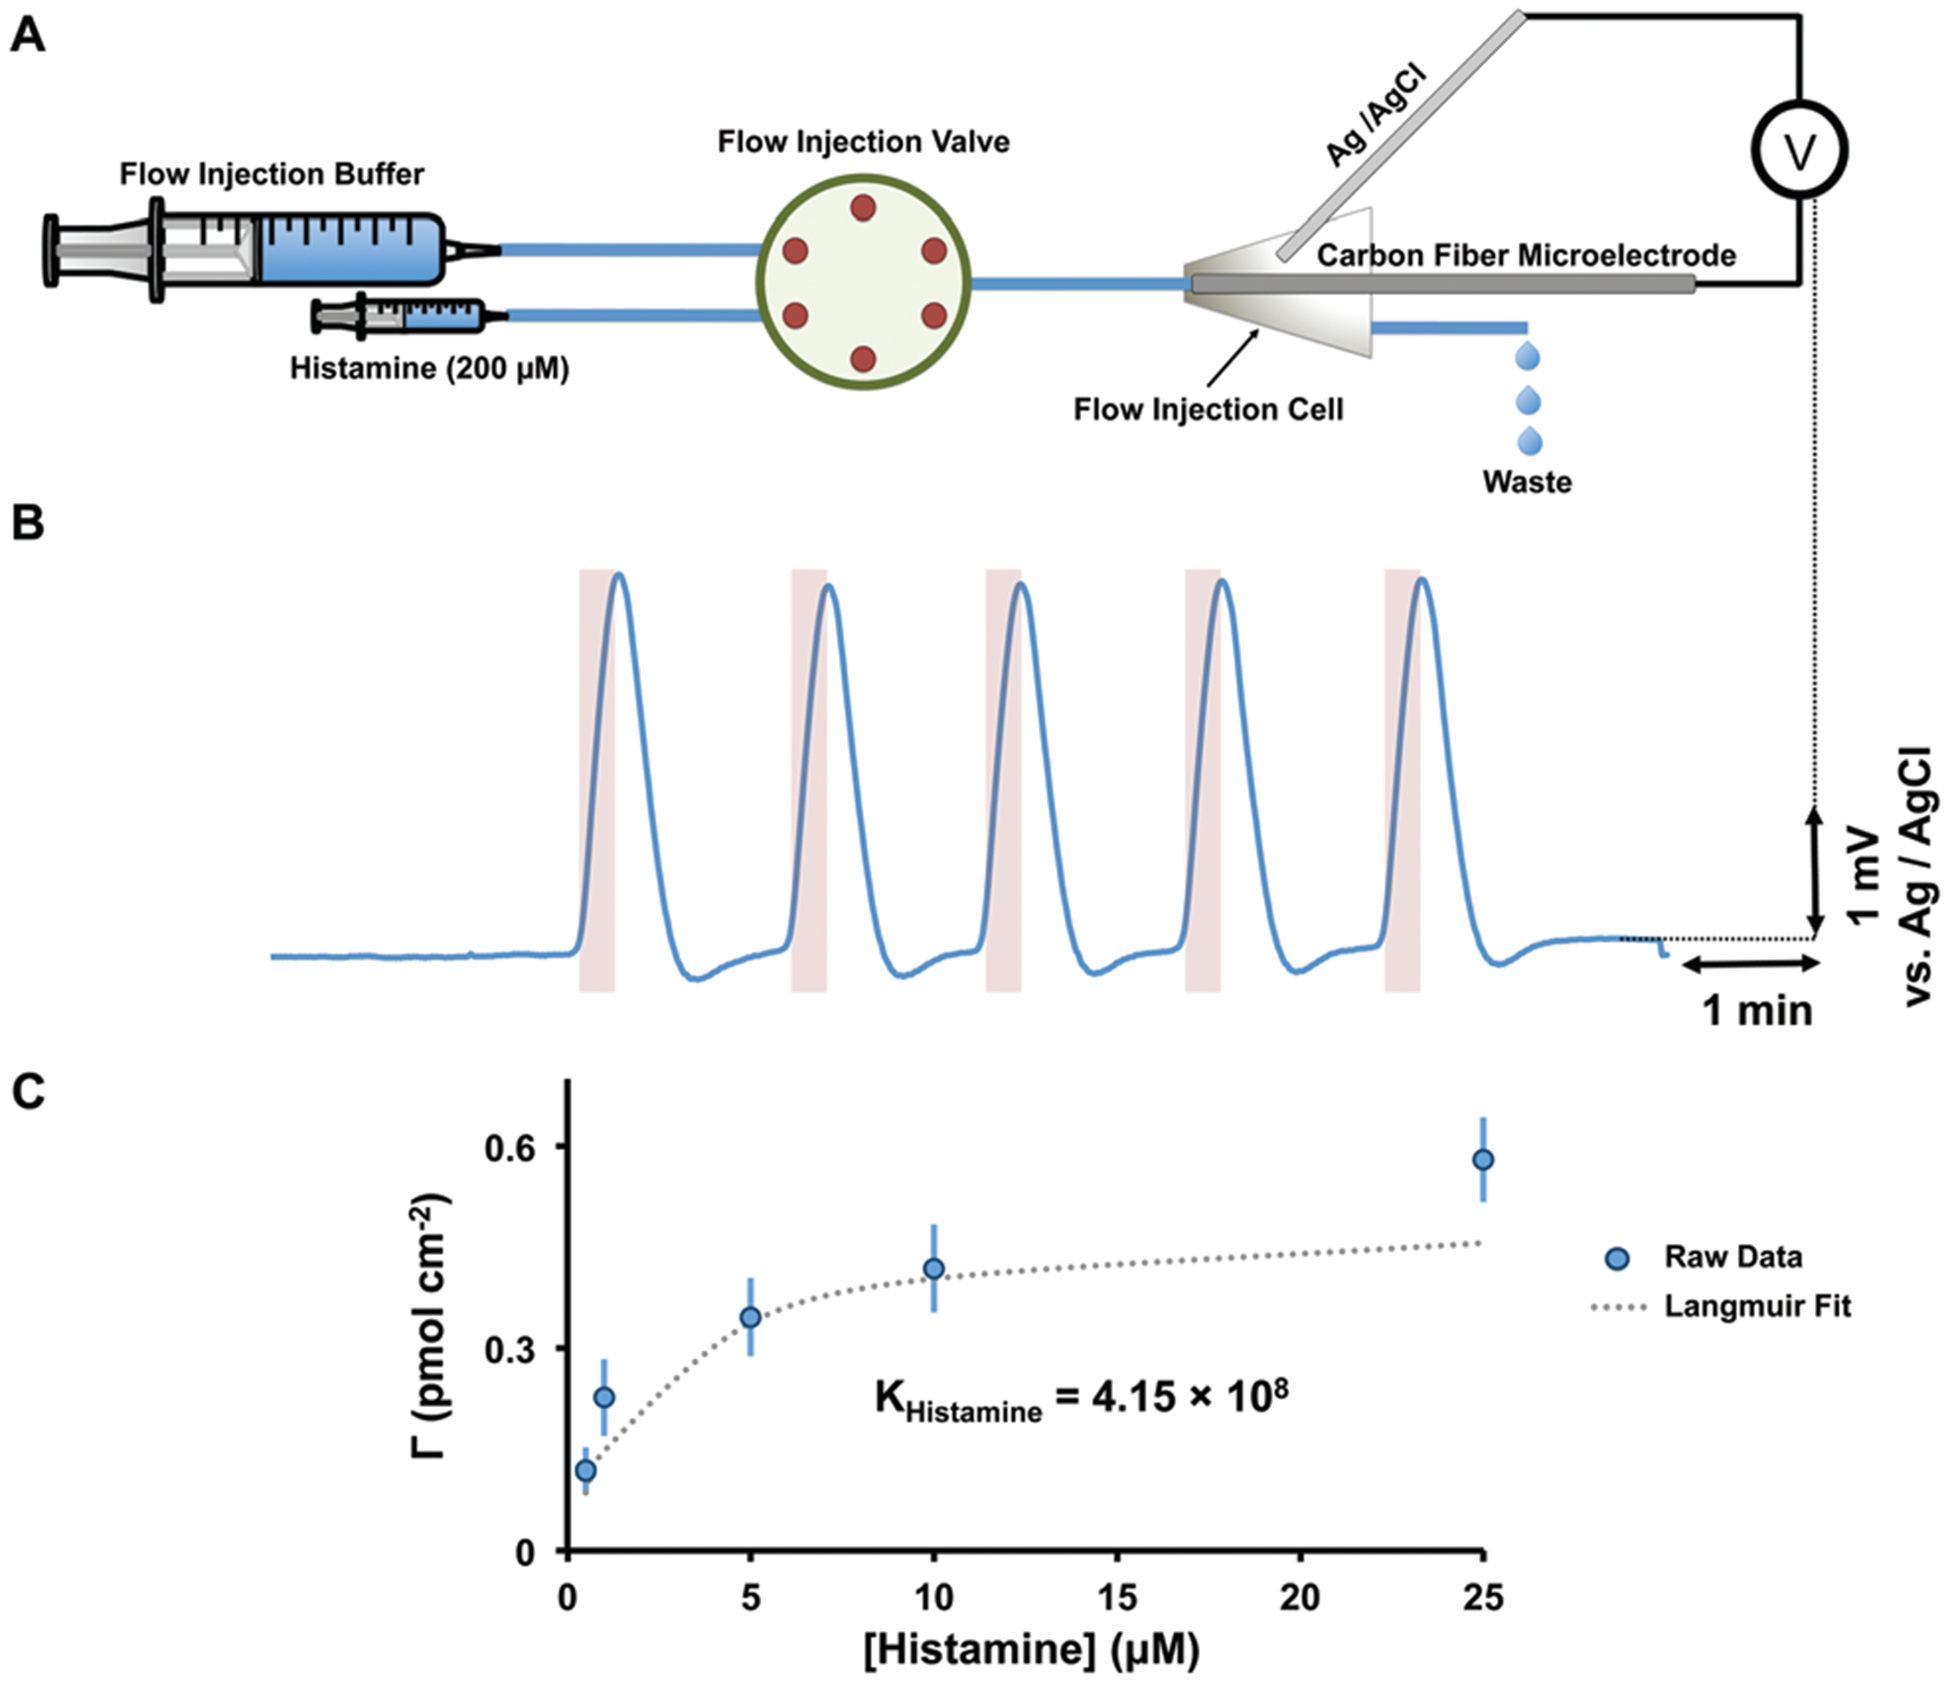
(A) The schematic diagram of the experimental setup used for potentiometric experiments. (B) The experimental potentiometric data for five consecutive injections of histamine (200 μM) on CFM. (C) Langmuir isotherm for histamine adsorption on CFMs in Tris buffer.
While charging current peaks can quantify histamine, little selectivity is offered since many analytes adsorb onto CFMs. We therefore designed a novel waveform to capture histamine electrochemistry before the switching potential.
Histamine selective waveform (HSW)
Histamine contains an imidazole ring and an aliphatic amine group. This molecule’s ability to readily bind metals such as Cu,22,23 because of its electronegative sites, means that it is readily amenable to oxidation. However histamine electro-oxidation differs from serotonin and dopamine in that it likely involves charge transfer. This mechanism introduces kinetic limitations that have not yet enabled stimulation-locked peaks on the positive direction of the wave in FSCV studies. Therefore preliminarily we utilized a triangular waveform and expanded the potential window to cover a large range thereby allowing histamine oxidation to occur within a single scan. Through trial and error we determined that, in vitro, a waveform scanning from −0.7 to 1.1 V (resting at −0.7 V at 600 V s−1) provided an oxidation peak during the positive scan. However this waveform was not successful in vivo, showing rapid degradation (fouling). By changing the resting potential to −0.5 V, we found that electrode degradation was eliminated and in vivo detection was possible. A possible explanation for this phenomenon is that at −0.7 V, fouling species (e.g. proteins) may preferentially adsorb onto the electrode surface.
Our optimized waveform, the histamine selective waveform (HSW), therefore is −0.7 V to 1.1 V, resting at −0.5 V, with a scan rate of 600 V s−1. Fig. 3 compares histamine detection with the previously described serotonin waveform15 to the HSW. Fig. 3A (serotonin waveform) and 3C (HSW) show color plots and CVs during FIA of histamine (20 μM). The HSW detects histamine oxidation at around +0.3 V vs. Ag/AgCl, and in contrast to the serotonin waveform, this peak occurs before the switching potential on the positive wave. Furthermore, current vs. time traces, extracted from horizontal dashed lines from the color plots (Fig. 3B), show that the HSW response (solid line) is a square waveform while the serotonin waveform response (dashed line) does not reach the steady state. This makes it possible to more accurately describe histamine in vivo kinetics (i.e. histamine clearance kinetics) with the HSW. The HSW has a linear dynamic range up to 20 μM of histamine (Fig. 3Dii), a sensitivity of 0.354 ± 0.032 nA μM−1 and a limit of detection of 1 μM. Finally, histamine measurements with this waveform show good stability, as evidenced by a negligible loss in signal (normalized oxidation current) during 50 successive flow injections of histamine (10 μM) (Fig. 3E).
Fig. 3.
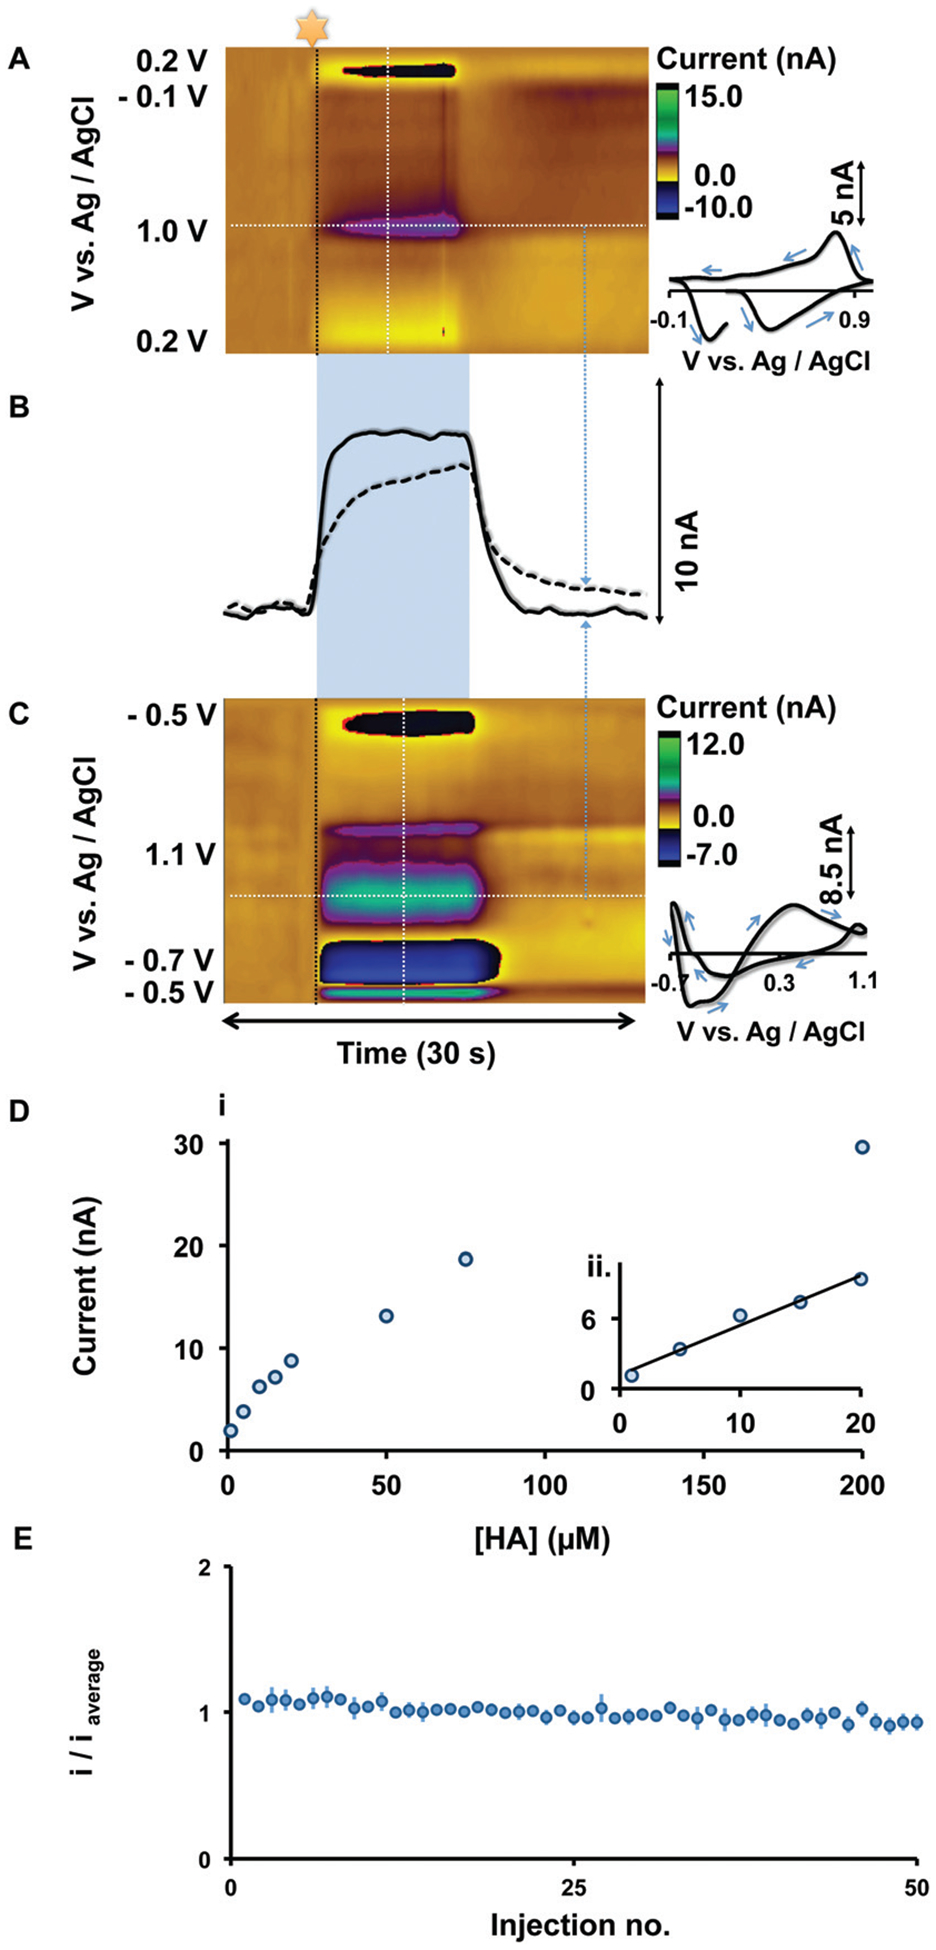
(A & C) Color plots for FIA of 20 μM histamine with the serotonin and HSW waveforms respectively. CVs extracted from vertical dashed lines are shown on the right. (B) Current vs. time traces from the horizontal dashed lines from color plots. (D) (i) Calibration curve, (ii) linear dynamic range (n = 4 ± SEM). (E) Stability of CFM over 50 consecutive injections of 10 μM histamine (n = 4 ± SEM).
HSW selectivity
We sought to develop a waveform to produce a histamine oxidation peak before the switching potential on the positive scan to increase the selectivity of FSCV towards histamine. To assess the selectivity of the waveform in vitro, we tested dopamine, serotonin and adenosine, which are electroactive species that are chemically similar to histamine and are commonly found in brain regions containing histamine.24–26 Fig. 4 shows CVs obtained during FIA of histamine (20 μM), dopamine (100 nM), serotonin (10 nM) and adenosine (1 μM). These concentrations were chosen to mimic previously reported evoked in vivo concentrations.11,25,27 Adenosine’s peak still occurs at the switching potential with this waveform and is therefore unlikely to interfere. The oxidation peak for histamine appears at around 0.3 V vs. Ag/AgCl (green dashed line) and is in a different position from dopamine and serotonin oxidation peaks (around 0.5 and 0.6 V vs. Ag/AgCl (red and blue dashed lines), respectively).
Fig. 4.
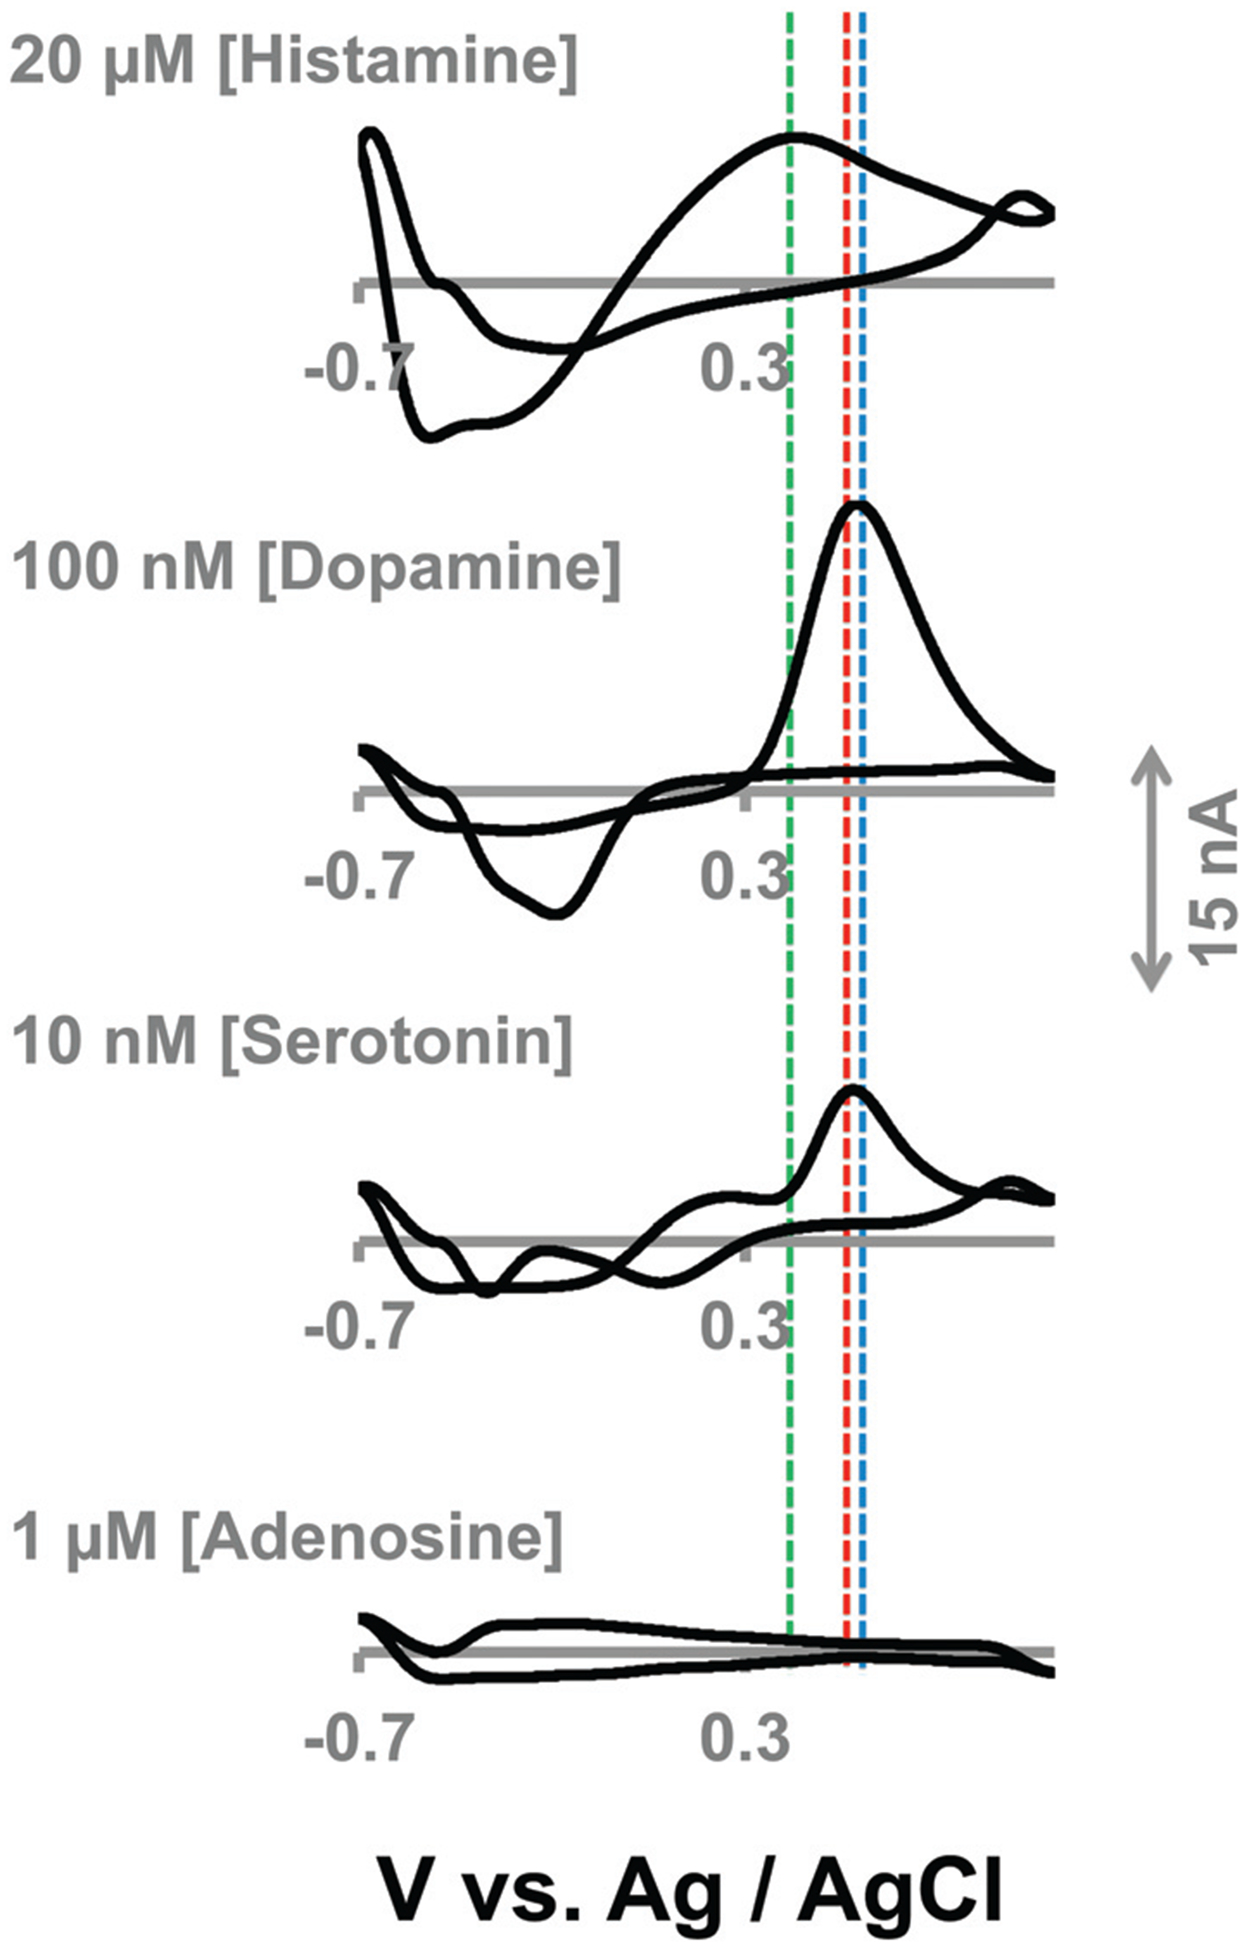
CVs for 20 μM histamine, 100 nM dopamine, 10 nM serotonin and 1 μM adenosine with in vitro FIA using HSW on CFMs. Vertical dashed lines indicate potential positions of peaks.
The HSW therefore shows good selectivity in vitro. However, the in vivo matrix is far more complicated than can be reproduced on the bench. We next assessed the ability of our novel waveform to measure histamine in vivo.
In vivo histamine
Histamine and serotonin were previously found to be co-released in the SNr upon electrical stimulation of the MFB.15 We were interested in isolating a histamine signal in a novel physiological circuitry involving the histamine cell bodies. The posterior hypothalamus houses a dense population of histamine cell bodies in areas such as tuberomammillary and premammillary nucleus (PM), which send their afferent to the forebrain via MFB.28–30 By utilizing a retrograde stimulation15 of the MFB, we reasoned that we would be able to detect histamine in the PM since histamine has previously been measured in this region with microdialysis.31
Fig. 5A shows a color plot in the mouse PM upon MFB stimulation (at 5–7 seconds indicated with the blue bar). An event at around 0.3 V vs. Ag/AgCl is clearly visible: a vertical dashed line through the maximum amplitude of this event (at 7 s) provides the CV in Fig. 5D. When a CV collected for histamine in vitro (Fig. 5B) was normalized and superimposed onto this in vivo CV, there was very good agreement between the oxidation peaks at 0.3 V. The additional features of the in vivo CV are due to the capacitative changes on the electrode’s surface because of the changes in the in vivo environment (ionic fluxes, pH changes), where if not for the peak at 0.3 V, it would be impossible to disentangle histamine’s electrochemistry from this other electrochemistry occurring at the switching potential.
Fig. 5.
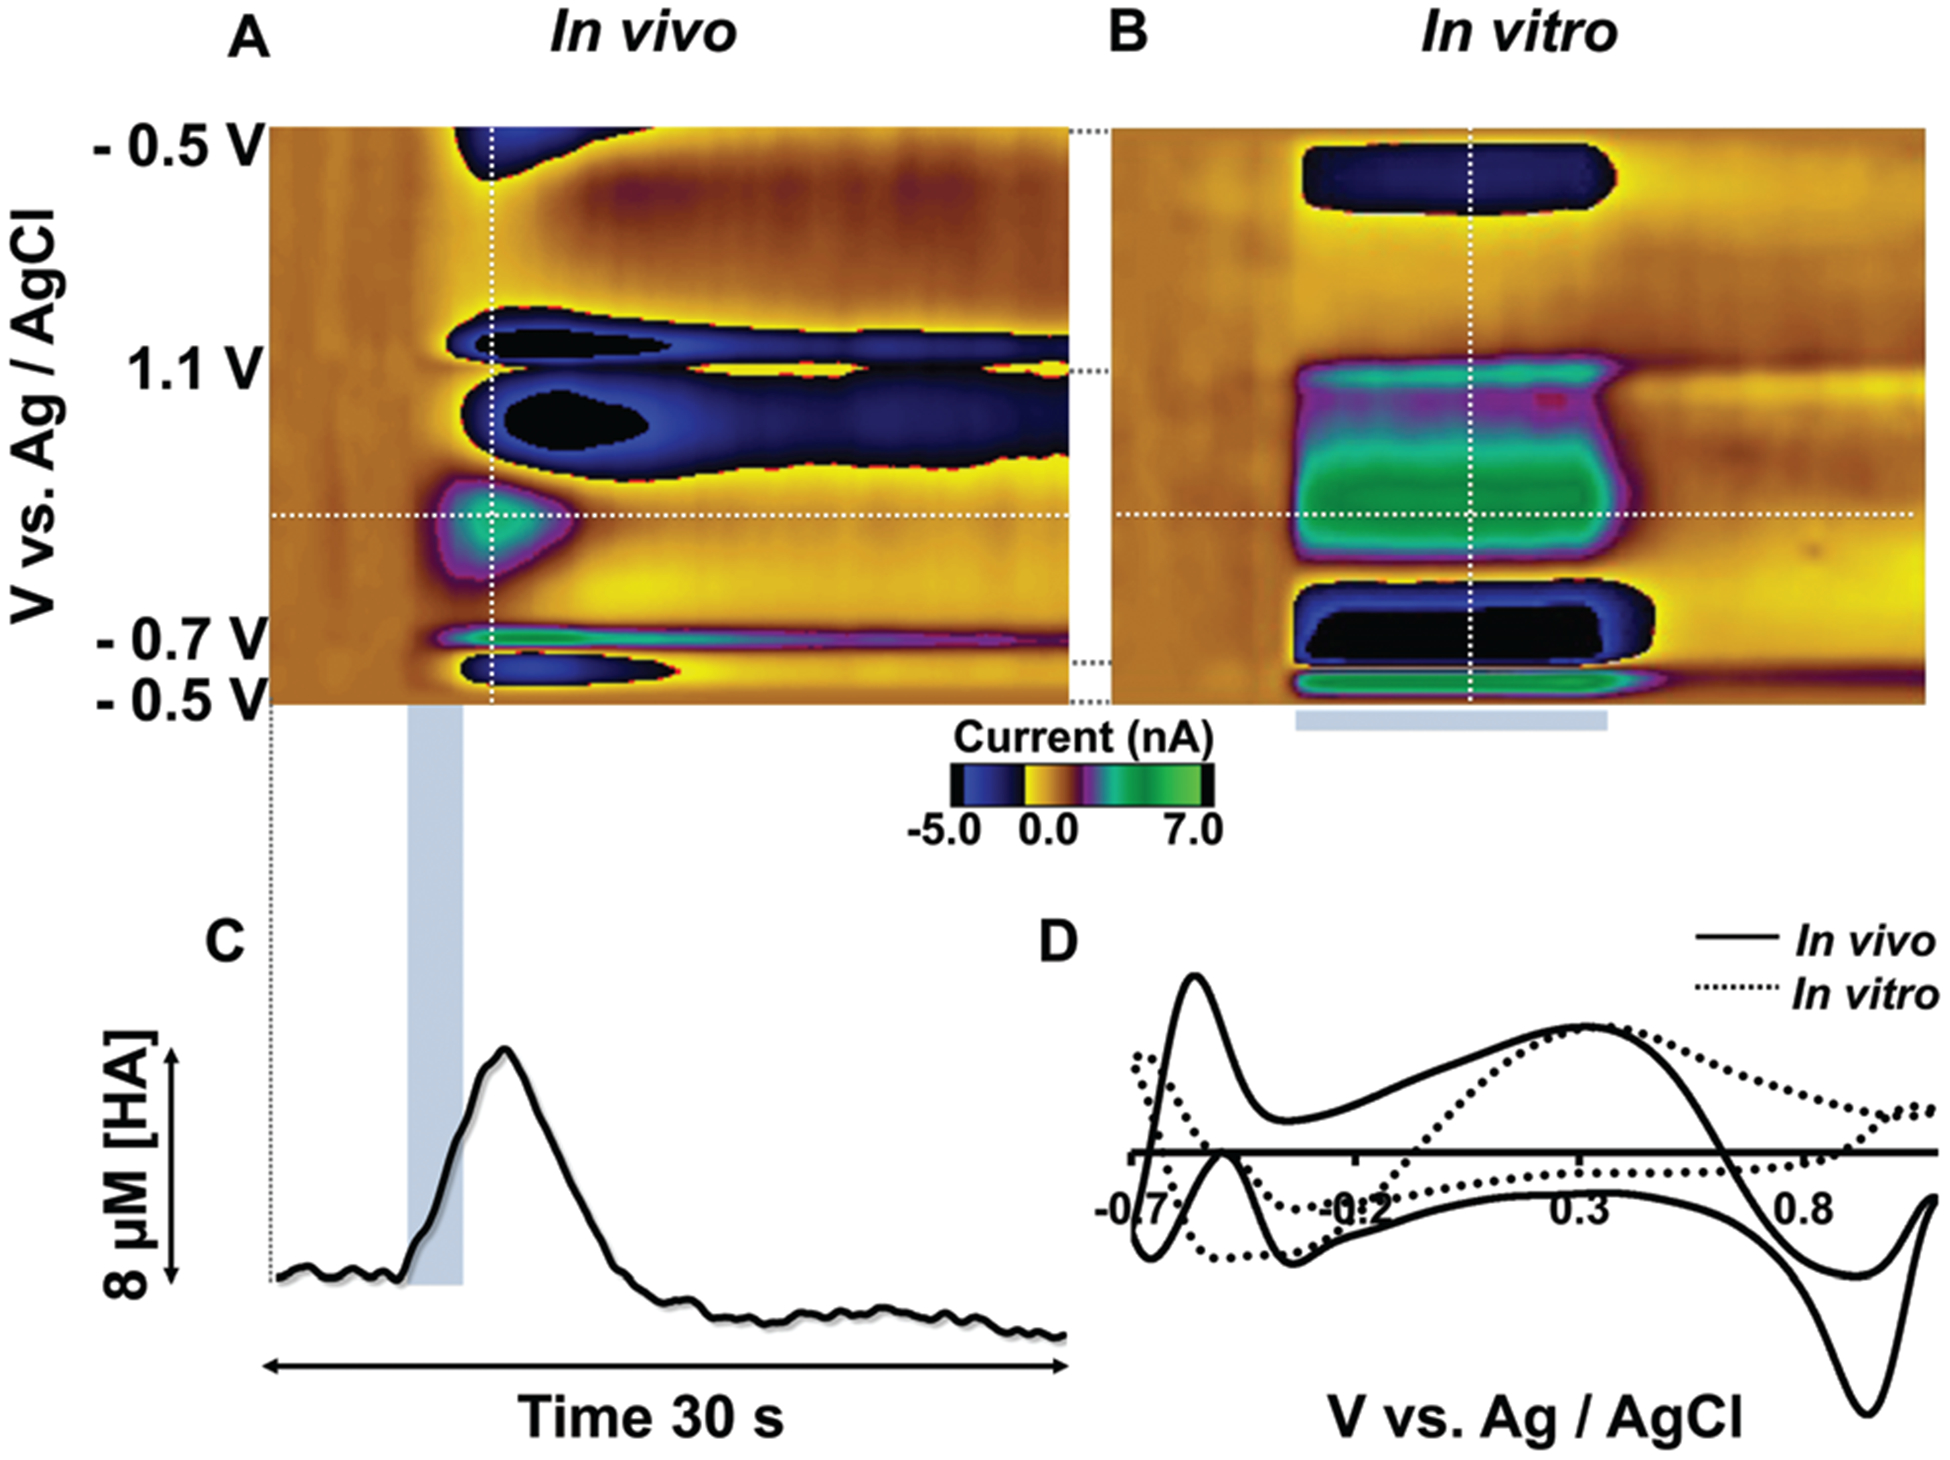
(A) A representative color plot of the histamine signal in PM upon MFB stimulation. (B) A representative in vitro color plot of histamine (20 μM) using FIA. (C) [Histamine] vs. time extracted from the horizontal dashed line from the color plot (A). (D) Normalized CVs of in vivo and in vitro (5 μM histamine) signals taken from vertical dashed lines.
Fig. 5C shows how histamine changes with time, determined by extracting current vs. time from the horizontal dashed line of the color plot and the calibration curve in Fig. 3D. Histamine levels elevate in response to electrical stimulation to around 8 μM and then clear after the stimulation, similar in magnitude to histamine release from mast cells.11 This profile is similar to dopamine and serotonin reuptake.10,32 This is an important finding since it implies a similar reuptake system for histamine, however a histamine transporter is yet to be identified.33
Although the electrochemistry is supportive of histamine’s identity, it is necessary to perform pharmacological experiments to validate the histamine response. Histamine neuro-pharmacology is not well explored in voltammetry models and there are very few histamine selective compounds that can cross the blood–brain barrier. As a first step, we utilized tacrine, a pharmaceutical therapy for Alzheimer’s disease. Tacrine is thought to primarily inhibit acetylcholinesterase, however it also is a potent inhibitor of histamine N-methyltransferase (HNMT) (histamine metabolizing enzyme).34–36 Fig. 6 shows the effect on the evoked PM signal (schematic of circuitry shown in Fig. 6A) upon i.p. tacrine (2 mg kg−1)37 administration (n = 5 animals ± SEM). Consistent with the tacrine’s pharmacokinetic profile in rodents,38 there was a clear effect 50 minutes after administration, whereby the t1/2 of histamine clearance increased significantly from 10.9 ± 1.1 s to 15.44 ± 2.6 s (p = 0.01) (Fig. 6B). This is an expected result of inhibition of histamine metabolism: because HNMT is located intracellularly,39,40 inhibition of this enzyme raises cystolic histamine levels which slows down the reuptake equilibria back into the cell.
Fig. 6.

(A) The positions of electrodes (stimulation and CFM) in mouse brain. (B & D) Representative color plots of stimulated release of histamine using HSW – before and after tacrine (2 mg kg−1) and thioperamide (20 mg kg−1). (C & E) Concentration vs. time traces extracted from the horizontal dashed line from B & D respectively, (n = 5 ± SEM). The 2 s stimulation starting at 5 s is shown by the blue bar.
Because tacrine is non-selective, we performed a further pharmacological experiment to verify the PM signal. Thioper-amide is a selective H3 receptor antagonist. We expected thioperamide administration to affect the kinetics of histamine release and clearance via inhibition of these histamine auto-receptors in the PM.41 Fig. 6C and D show that 50 minutes after thioperamide (20 mg kg−1) administration,42 there was a pronounced increase in histamine release from 7.9 ± 2.1 to 11.8 ± 4.6 μM (p = 0.02). Increases in evoked release have previously been seen with dopamine autoreceptor antagonism.43,44 A significant increase in the t1/2 of histamine clearance was also observed from 13.3 ± 3.4 s to 18.8 ± 3.2 s (p = 0.03), which was seen in prior studies with serotonin autoreceptor antagonism.10 The time course of this experiment is also consistent with thioperamide’s pharmacokinetics in rodents.45
These pharmacological experiments, in addition to the electrochemical characterization, allow us to confidently verify the histamine nature of this signal in the PM.
Conclusion
Histamine has an important but not well studied role as a neurotransmitter. FSCV is an ideal tool for histamine detection because of its sensitivity, selectivity and high temporal resolution. Previous FSCV studies have not been able to selectively identify histamine because the CV features were due to capacitative processes on the electrode surface that are not selective. Here, we developed the HSW that provides a robust oxidation peak before the switching peak. We described in vitro waveform optimization and a novel in vivo physiological model for retrograde stimulation of histamine release in the mouse PM. We verified this signal pharmacologically as histamine. This novel FSCV method will enable detailed in vivo characterization of this important neuromodulator.
Acknowledgements
The authors would like to thank Ellen Strawsine for technical assistance. WSU funded this research. A Rumble fellowship supported Srimal Samaranayake.
References
- 1.Robinson DL, Venton BJ, Heien ML and Wightman RM, Clin. Chem, 2003, 49, 1763–1773. [DOI] [PubMed] [Google Scholar]
- 2.Howe MW, Tierney PL, Sandberg SG, Phillips PE and Graybiel AM, Nature, 2013, 500, 575–579. [DOI] [PMC free article] [PubMed] [Google Scholar]
- 3.Ford CP, Gantz SC, Phillips PE and Williams JT, J. Neurosci, 2010, 30, 6975–6983. [DOI] [PMC free article] [PubMed] [Google Scholar]
- 4.Hashemi P, Dankoski EC, Petrovic J, Keithley RB and Wightman RM, Anal. Chem, 2009, 81, 9462–9471. [DOI] [PMC free article] [PubMed] [Google Scholar]
- 5.Park J, Kile BM and Wightman RM, Eur. J. Neurosci, 2009, 30, 2121–2133. [DOI] [PMC free article] [PubMed] [Google Scholar]
- 6.Wood KM and Hashemi P, ACS Chem. Neurosci, 2013, 4, 715–720. [DOI] [PMC free article] [PubMed] [Google Scholar]
- 7.Hashemi P, Dankoski EC, Lama R, Wood KM, Takmakov P and Wightman RM, Proc. Natl. Acad. Sci. U. S. A, 2012, 109, 11510–11515. [DOI] [PMC free article] [PubMed] [Google Scholar]
- 8.Park J, Takmakov P and Wightman RM, J. Neurochem, 2011, 119, 932–944 [DOI] [PMC free article] [PubMed] [Google Scholar]
- 9.Park J, Bucher ES, Fontillas K, Owesson-White C, Ariansen JL, Carelli RM and Wightman RM, Biol. Psychiatry, 2013,74, 69–76. [DOI] [PMC free article] [PubMed] [Google Scholar]
- 10.Wood KM, Zeqja A, Nijhout HF, Reed MC, Best J and Hashemi P, J. Neurochem, 2014, 130, 351–359. [DOI] [PMC free article] [PubMed] [Google Scholar]
- 11.Pihel K, Hsieh S, Jorgenson JW and Wightman RM, Anal. Chem, 1995, 67, 4514–4521. [DOI] [PubMed] [Google Scholar]
- 12.Pihel K, Hsieh S, Jorgenson JW and Wightman RM, Biochemistry, 1998, 37, 1046–1052. [DOI] [PubMed] [Google Scholar]
- 13.Travis ER, Wang YM, Michael DJ, Caron MG and Wightman RM, Proc. Natl. Acad. Sci. U. S. A, 2000, 97, 162–167. [DOI] [PMC free article] [PubMed] [Google Scholar]
- 14.Chang SY, Jay T, Munoz J, Kim I and Lee KH, Analyst, 2012, 137, 2158–2165. [DOI] [PMC free article] [PubMed] [Google Scholar]
- 15.Hashemi P, Dankoski EC, Wood KM, Ambrose RE and Wightman RM, J. Neurochem, 2011, 118, 749–759. [DOI] [PMC free article] [PubMed] [Google Scholar]
- 16.Bard A and Faulkner L, Electrochemical Methods: Fundamentals and Applications, John Wiley & Sons, Inc, 2001. [Google Scholar]
- 17.Pathirathna P, Samaranayake S, Atcherley CW, Parent KL, Heien ML, McElmurry SP and Hashemi P, Analyst, 2014, 139, 4673–4680. [DOI] [PubMed] [Google Scholar]
- 18.Jackson BP, Dietz SM and Wightman RM, Anal. Chem, 1995, 67, 1115–1120. [DOI] [PubMed] [Google Scholar]
- 19.Michael D, Travis ER and Wightman RM, Anal. Chem, 1998, 70, 586A–592A. [DOI] [PubMed] [Google Scholar]
- 20.Sanford AL, Morton SW, Whitehouse KL, Oara HM, Lugo-Morales LZ, Roberts JG and Sombers LA, Anal. Chem, 2010, 82, 5205–5210. [DOI] [PMC free article] [PubMed] [Google Scholar]
- 21.Glanowska KM, Venton BJ and Moenter SM, J. Neurosci, 2012, 32, 14664–14669. [DOI] [PMC free article] [PubMed] [Google Scholar]
- 22.Torreggiani A, Tamba M, Bonora S and Fini G, Biopolymers, 2003, 72, 290–298. [DOI] [PubMed] [Google Scholar]
- 23.Xerri B, Flament J-P, Petitjean H, Berthomieu C and Berthomieu D, J. Phys. Chem. B, 2009, 113, 15119–15127. [DOI] [PubMed] [Google Scholar]
- 24.RICHELSON E, J. Clin. Psychopharmacol, 1996, 16, 1S–7S. [DOI] [PubMed] [Google Scholar]
- 25.Heien MLAV, Khan AS, Ariansen JL, Cheer JF, Phillips PEM, Wassum KM and Wightman RM, Proc. Natl. Acad. Sci. U. S. A, 2005, 102, 10023–10028. [DOI] [PMC free article] [PubMed] [Google Scholar]
- 26.van Dijk A, Klompmakers AA, Feenstra MGP and Denys D, J. Neurochem, 2012, 123, 897–903. [DOI] [PubMed] [Google Scholar]
- 27.Swamy BE and Venton BJ, Anal. Chem, 2007, 79, 744–750. [DOI] [PubMed] [Google Scholar]
- 28.Histamine in the Nervous System, 2008. [Google Scholar]
- 29.Vanhala A, Yamatodani A and Panula P, J. Comp. Neurol, 1994, 347, 101–114. [DOI] [PubMed] [Google Scholar]
- 30.Auvinen S and Panula P, J. Comp. Neurol, 1988, 276, 289–303. [DOI] [PubMed] [Google Scholar]
- 31.Russell WL, Henry DP, Phebus LA and Clemens JA, Brain Res, 1990, 512, 95–101. [DOI] [PubMed] [Google Scholar]
- 32.Wu Q, Reith MEA, Wightman RM, Kawagoe KT and Garris PA, J. Neurosci. Methods, 2001, 112, 119–133. [DOI] [PubMed] [Google Scholar]
- 33.Hough LB, Prog. Neurobiol, 1988, 30, 469–505. [DOI] [PubMed] [Google Scholar]
- 34.Morisset S, Traiffort E and Schwartz JC, Eur. J. Pharmacol, 1996, 315, R1–R2. [DOI] [PubMed] [Google Scholar]
- 35.Musial A, Bajda M and Malawska B, Curr. Med. Chem, 2007, 14, 2654–2679. [DOI] [PubMed] [Google Scholar]
- 36.Taraschenko OD, Barnes WG, Herrick-Davis K, Yokoyama Y, Boyd DL and Hough LB, Methods Find Exp. Clin. Pharmacol, 2005, 27, 161–165. [DOI] [PubMed] [Google Scholar]
- 37.Nishibori M, Oishi R, Itoh Y and Saeki K, Jpn. J. Pharmacol, 1991, 55, 539–546. [DOI] [PubMed] [Google Scholar]
- 38.Telting-Diaz M and Lunte CE, Pharm. Res, 1993, 10, 44–48. [DOI] [PubMed] [Google Scholar]
- 39.Maintz L and Novak N, Am. J. Clin. Nutr, 2007, 85, 1185–1196. [DOI] [PubMed] [Google Scholar]
- 40.Pollard H, Bischoff S and Schwartz JC, J. Pharmacol. Exp. Ther, 1974, 190, 88–99. [PubMed] [Google Scholar]
- 41.Brown RE, Stevens DR and Haas HL, Prog. Neurobiol, 2001, 63, 637–672. [DOI] [PubMed] [Google Scholar]
- 42.Bernaerts P, Lamberty Y and Tirelli E, Behav. Brain Res, 2004, 154, 211–219. [DOI] [PubMed] [Google Scholar]
- 43.Kita JM, Parker LE, Phillips PE, Garris PA and Wightman RM, J. Neurochem, 2007, 102, 1115–1124. [DOI] [PubMed] [Google Scholar]
- 44.Clark D, Exner M, Furmidge LJ, Svensson K and Sonesson C, Eur. J. Pharmacol, 1995, 275, 67–74. [DOI] [PubMed] [Google Scholar]
- 45.Bordi F, Mor M, Plazzi PV, Silva C, Caretta A and Morini G, Farmaco, 1992, 47, 1095–1103. [PubMed] [Google Scholar]


