Abstract
In many areas of application, key objectives of chemical separation and analysis are to minimize the sample quantity while maximizing the chemical information obtained. Increasing measurement sensitivity is especially critical for proteomics research, especially when processing trace samples and where multiple measurements are desired. A rich collection of technologies has been developed, but the resulting sensitivity remains insufficient for achieving in-depth coverage of proteomic samples as small as single cells. Here, we combine picoliter-scale liquid chromatography (picoLC) with mass spectrometry (MS) to address this issue. The picoLC employs a 2-μm-i.d. open tubular column to reduce the sample input needed to greatly increase the sensitivity achieved using electrospray ionization (ESI) with MS. With this picoLC-MS system, we show that we can identify ~1000 proteins reliably using only 75 pg of tryptic peptides, representing a 10–100-fold sensitivity improvement compared with the state-of-the-art liquid chromatography (LC) or capillary electrophoresis (CE)-MS methods. PicoLC-MS extends the limit of separation science and is expected to be a powerful tool for single cell proteomics.
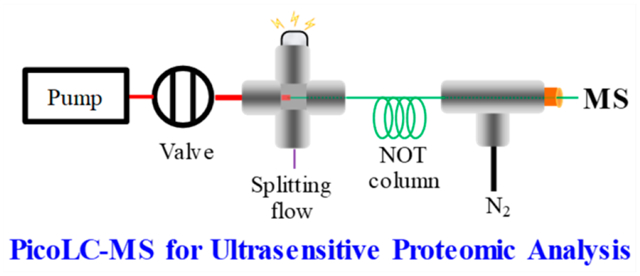
GRAPHICAL ABSTRACT:
Proteomics typically aim to, as broadly as possible, identify and quantify expressed proteins (and often their post-translational modifications) in a given biological sample and is increasingly transforming biological and medical research.1,2 In a typical shotgun proteomics workflow, proteins are extracted from tissues and digested into peptides by trypsin. These peptides are separated by high-resolution LC and sequenced by tandem MS (i.e., MS/MS).3 Advances in nanoflow LC and MS have significantly improved both the sensitivity and the throughput of proteomic measurements;4 often >10,000 proteins can be reliably identified and quantified in common proteomics laboratories with reasonable time and cost.5 However, significant sample quantities are required for such studies (typically >1 μg), precluding the analysis of trace samples (e.g., single cells). Unlike genomics and transcriptomics with amplification methods available, proteomic measurements largely depend on the efficiency of the sample processing workflow and the LC-MS platform sensitivity.
The rapid progress of LC-MS platforms and sample preparation approaches have made single cell proteomics feasible. The increased efficiency of ESI at decreasing flow rates combined with the advances in MS instrumentation (e.g., Orbitrap6 based), and incorporating the ion funnel and related technologies, have served to significantly improve the sensitivity of mass analyzers.6 Advanced electrospray ionization sources, such as nanospray and sub-ambient-pressure ionization source,7 have allowed for >50% of analytes initially in solution phase to be transmitted to the MS detector. The flow rate and separation efficiency of LC are dominant factors determining the overall sensitivity of LC-MS. Shen et al.8 observed the minimization of packing column i.d. from 75 to 15 μm, corresponding to reducing flow rates from 300 nL/min to 20 nL/min, significantly increasing peptide detection sensitivity, allowing detection of 10 zmol (~6000 molecules) from a protein digest.8 We previously demonstrated that the use of a 30-μm-i.d. column can increase protein identification by 95% for 0.5 ng tryptic digest equivalent to ~3 mammalian cells, compared with a 75-μm-i.d. column.9 Similarly, Ivanov and co-workers10 developed porous-layer open tubular columns with an i.d. of 10 μm and an operation flow rate of 20 nL/min that enabled identification of 1800 proteins from diluted samples equivalent to 50 MCF-7 cells. In addition to low flow rates, Stadlmann et al.11 showed that the use of microfabricated pillar array columns can greatly improve separation efficiency, and provide increased proteome coverage for low-input samples. Regarding proteomic sample preparation, efforts have increasingly focused on reducing adsorptive sample losses while maintaining compatibility with the downstream LC-MS analysis. For example, we developed a microfluidic platform, termed nanoPOTS (Nanodroplet Processing in One pot for Trace Samples),12,13 for low-input (e.g., single cell) proteomics by downscaling sample preparation in microfabricated nanowells to total volumes of <200 nL. We demonstrated that nanoPOTS allowed >3000 proteins to be quantitatively profiled from as few as 10 HeLa cells12 and >600 proteins from single HeLa cells.13 Despite these advances, the single cell proteomics coverage is still insufficient (~5% of the total proteome), and most biologically interesting proteins of low-to-moderate abundance are not detected, highlighting the necessity to further improve sensitivity after sample preparation (i.e., in the LC-MS analysis).
As it is technically difficult to pack small i.d. capillary columns, several groups have focused on developing open tubular LC columns with i.d. < 10 μm. Hara et al. developed14 5-μm-i.d. OTLC columns with sol–gel coated mesoporous silica layers. High separation efficiency with plate height of ~3 μm was obtained. Based on previous theoretical studies,15 the inner diameter (i.d.) of the open tubular (OT) column should be in the range of 1–2 μm to achieve ultrahigh efficiency. However, due to various challenges in utilizing such narrow OT columns (e.g., column preparation, low sample loading capacity, sensitive detection, etc.), the ultrahigh efficiency was not obtained in the intervening ~4 decades. With technological advances and efforts, we have now overcome these challenges and validated the theoretical predictions by developing narrow open tubular liquid chromatography (NOTLC) with 2-μm-i.d. columns.6,7 We have recently demonstrated that NOTLC can yield ultrahigh peak capacities (>2000 in 3 h) and ultrahigh sensitivities (sub-attomole limit of detection) using fluorescence detection.16
In this paper, we report our progress toward significantly increasing proteomic sensitivity using a picoflow liquid chromatography mass spectrometry (picoLC-MS) system. A NOT (narrow open tubular) column15,16 with 2 μm i.d. was employed for high-resolution separations at a flow rate of ~790 pL/min. By coupling the picoLC with an Orbitrap MS, we show that ~1000 proteins can be reliably identified using only 75 pg tryptic peptides, representing over 10–100-fold improvement in sensitivity compared with previously developed 15 or 30-μm-i.d. packed-column LC8,9 and capillary electrophoresis (CE) MS systems.17
The picoLC-MS system arrangement is illustrated in Figure 1A. Briefly, a 2-μm-i.d., 150-μm-o.d., 80-cm-long fused silica capillary (cross section shown in Figure 1B) was treated by trimethoxy(octadecyl)silane using a device (shown in Figure S1; Supporting Information) to generate a layer of C18 stationary phase on the inner capillary surface to serve as the NOT column. The capillary end was chemically etched by putting the capillary in 49% HF solution while flowing water continuously through the capillary (Figure S2).18 The HF etching produced an externally tapered emitter tip (Figure 1C) for efficient ESI at the low picoliter-range flow rate. The externally tapered tip also minimized tip clogging problems during peptide separation,19 compared with pulled tips having both internally and externally tapered structures. An Upchurch microcross was used to construct a flow splitter. A 10-cm-long × 150-μm-i.d. × 360-μm-o.d. capillary was used to connect the injection valve and the flow splitter. Inside the flow splitter, the NOT column head was inserted (1 mm deep) into this connection capillary. A metal stopper was used to apply ESI voltage, and a restriction capillary (RC) was used to control the splitting ratio.
Figure 1.
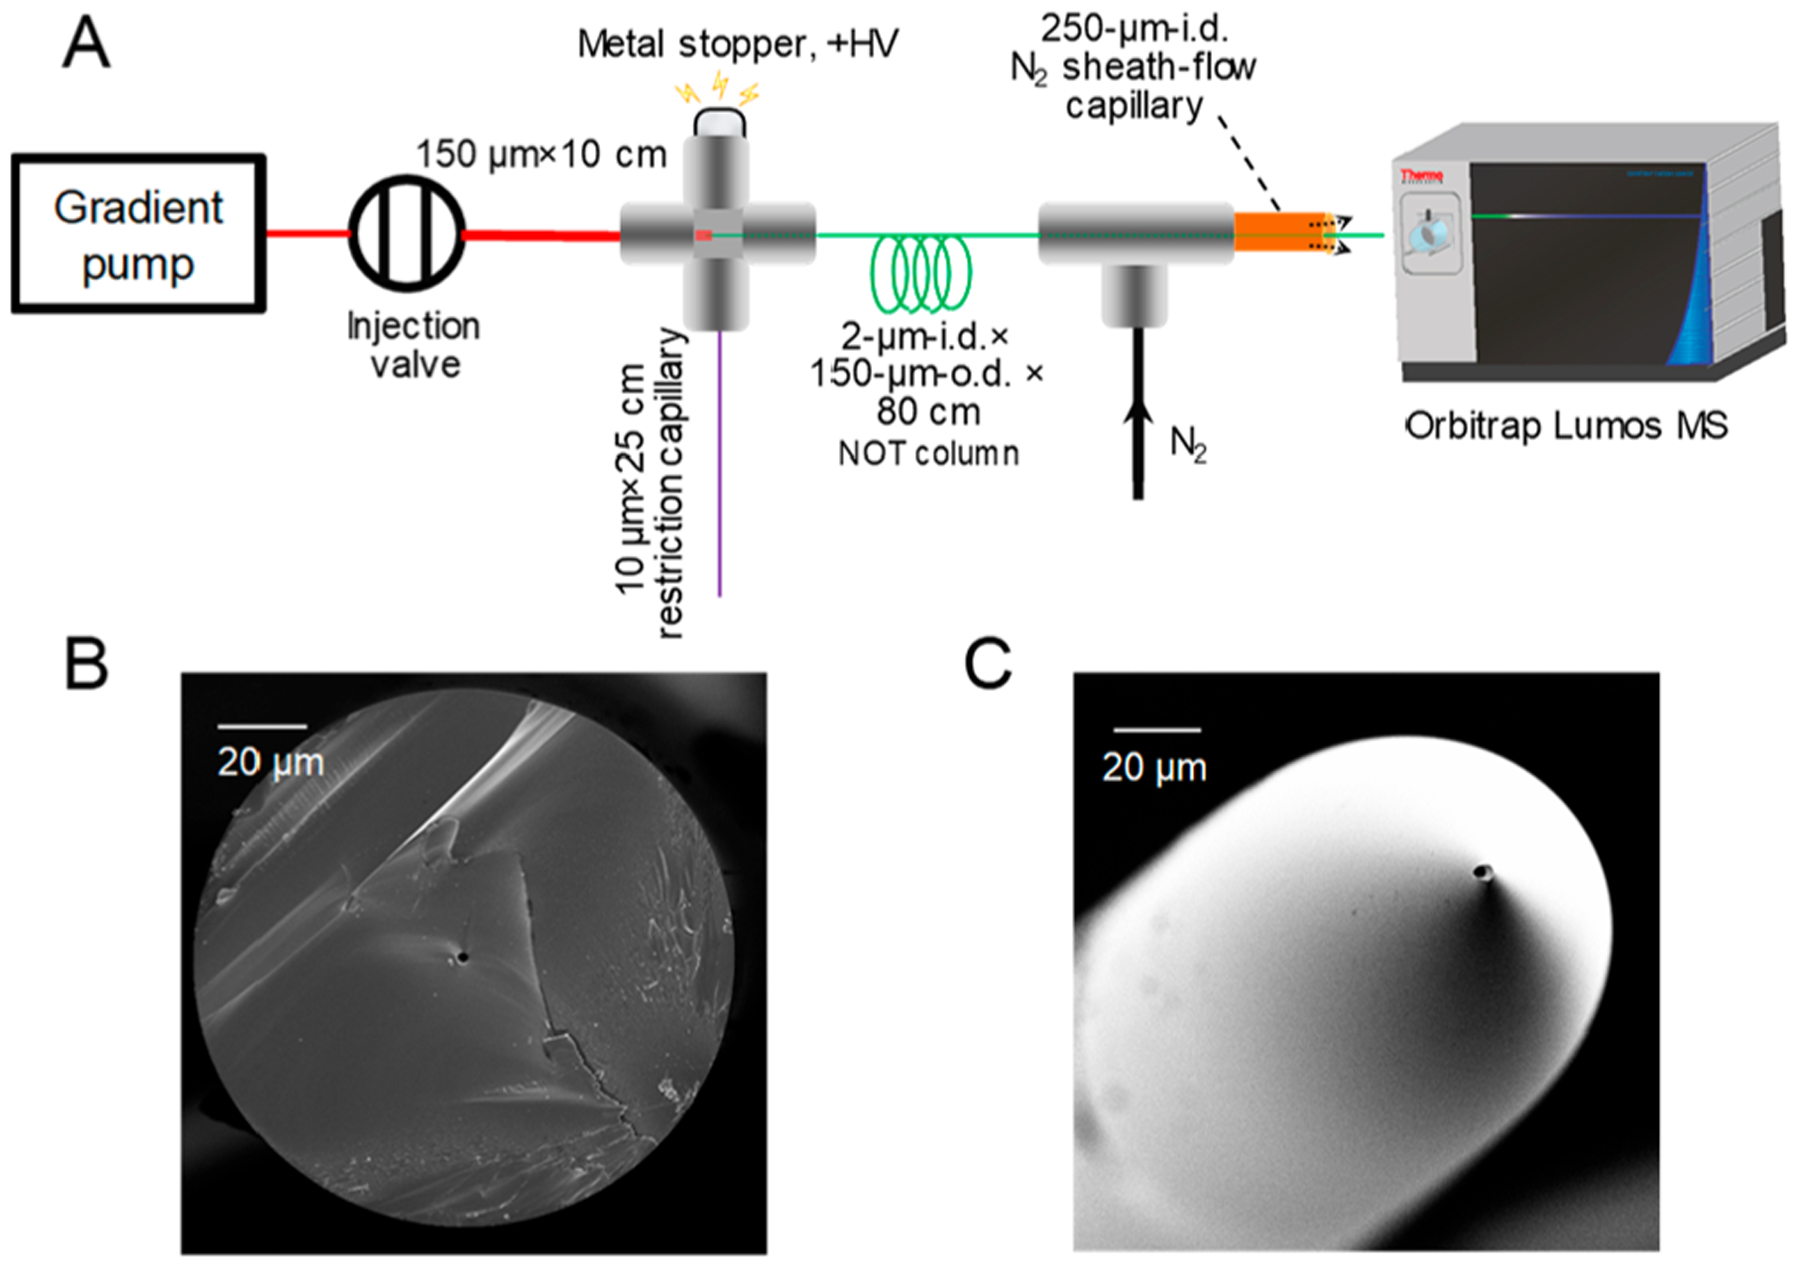
(A) Schematic illustration of the experimental setup of the picoLC-MS system. (B) SEM images of the cross section of a NOT column and (C) the HF-etched electrospray emitter tip.
A Dionex NCP3200RS UPLC gradient pump (Thermo-Fisher) operating at 700 nL/min was employed for both sample injection and reversed-phase NOTLC separation. Using a 25-cm-long RC, the flow rate inside the NOT column was calculated to be around 790 pL/min (see Supporting Information for the calculation). A high voltage was also applied through the cross to initiate electrospray ionization. To improve electrospray stability at picoliter-per-minute flow rates, a nitrogen sheath flow (50 psi) was applied at the emitter through a Tee junction. Surprisingly, we cannot obtain evident peptide signals without the sheath gas, highlighting that more studies on the picoliter-scale electrospray are required to understand this phenomenon. The ionized peptides were collected by an Orbitrap Fusion Lumos Tribrid Mass Spectrometer for data acquisition under data-dependent acquisition mode. To achieve optimal detection sensitivity, the precursor scans (MS1 scan) were performed at a scan resolution of 120K and a maximal injection time of 100 ms.20 The tandem MS (MS2) scans were performed at ion trap with maximal injection times of 80 and 300 ms for highest peptide loading (75 pg) and lower peptide loadings (control, 0.75 pg, and 7.5 pg), respectively. Detailed LC-MS/MS parameters were included in Supporting Information.
As an initial proof-of-concept, we injected serially diluted tryptic peptide samples from Shewanella oneidensis and eluted them using a 30 min LC gradient. To calculate the splitting ratio during the sample loading process, we injected a diluted peptide mixture, loaded it onto the NOT column, and then eluted it out using peptides at an isobaric condition of 35% Buffer B (0.1% formic acid in acetonitrile). We calculated the mobile-phase flow rate on the NOT column as ~790 pL/min by measuring the dead time of unretained peptides (Figures S3 and S4). Using the resulting flow splitting ratio (1/886) and the total injected peptides in the sample loop (0.66 ng, 6.63 ng, and 66.3 ng), the on-column peptide amounts are calculated as 0.75 pg, 7.5 pg, and 75 pg, respectively. We observed feature-rich chromatograms for all peptide loadings. A typical base peak chromatogram of 7.5 pg peptide loading is shown in with an average total ion current (TIC) of 3 × 10⁵, which we ascribe to minimal contamination from solvent and ambient air at picoliter-scale flow rates. By comparison, we generally observe a background TIC signal in the range of 5 × 10⁶ to 2 × 10⁷ from conventional nanoLC systems having flow rates of 150–300 nL/min (data not shown). The low background signals are not likely due to the use of sheath gas, because we observed similar background signals with and without sheath gas. Next, we evaluated the separation efficiency of the NOT column using the peak widths provided by MaxQuant. As shown in Figure 2B, the median peak widths are 0.14, 0.18, and 0.19 min for 0.75 pg, 7.5 pg, and 75 pg peptides, respectively, separated using 30 min gradients. Although only a thin-layer C18 coating was used in the NOT column, it still provided good separation efficiency for the complex peptide digest. No significant peak broadening was observed when the peptide amount was increased from 7.5 pg to 75 pg.
Figure 2.
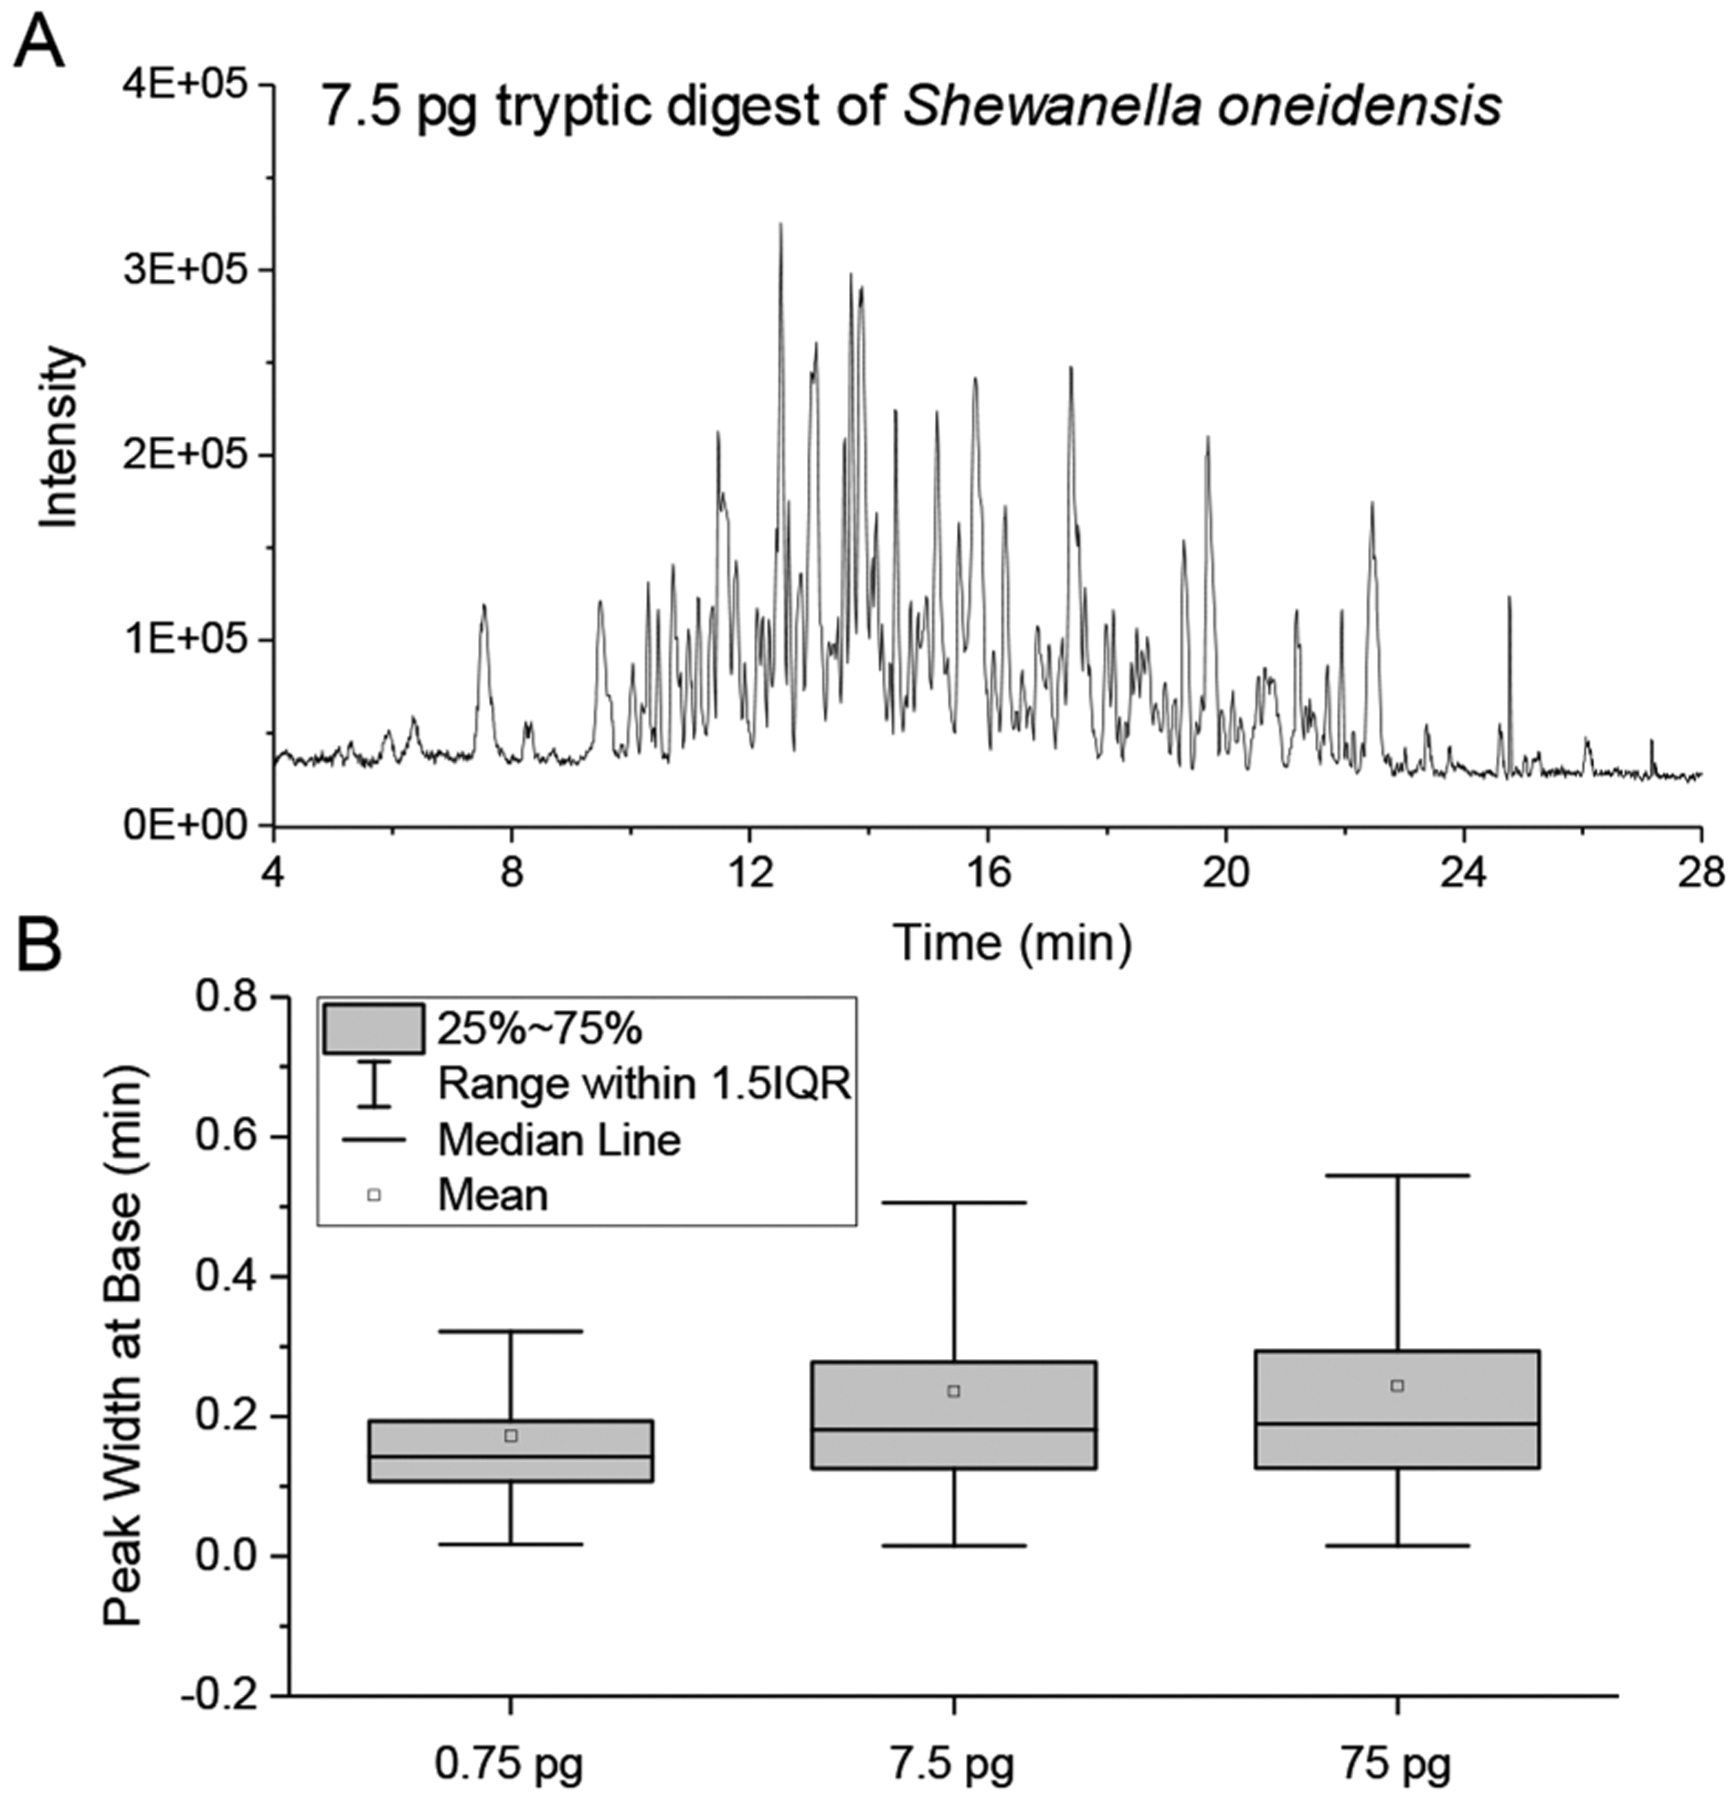
(A) PicoLC-MS base peak chromatogram of 7.5 pg S. oneidensis tryptic digest. (B) Box plots of peak widths at base for the identified peptide peaks from peptide loadings of 0.75 pg, 7.5 pg, and 75 pg and a separation gradient of 30 min.
Next, to evaluate the sensitivity of the picoLC-MS system, the proteome coverage for the three peptide loading samples together with a control blank sample (an injection of Buffer A − 0.1% formic acid in water) were extracted. Only two peptides and proteins were identified in blank samples. In comparison to blank samples, the average peptide identifications based on MS/MS spectra range from 175 to 4000 and the corresponding protein identifications are from 78 to 949 for duplicate loadings of 0.75 pg, 7.5 pg, and 75 pg peptides, respectively (Figure 3A,B). As expected, most proteins identified for lower loading samples were present with higher loadings (Figure 3C), indicating LC-MS coverage was not limited by MS/MS peptide identification/sequencing speed. The ability to profile ~1000 proteins from only 75 pg total peptides represented over 10–100-fold improvement in sensitivity compared with previously developed 15 or 30-μm i.d. packed column LC8,9 and CE MS systems.17 We attribute the improvement to three unique aspects of the picoLC-MS system: (1) At picoflow rates, the ESI efficiency is greatly increased;8 (2) sample losses to stationary-phase surfaces are minimized compared to conventional nanoflow LC; and (3) the reduced flow rates combined with a nitrogen sheath gas minimize chemical background from LC solvents and ambient air, which improve both ion accumulation and detection of low-abundance peptide species in the MS detector.
Figure 3.
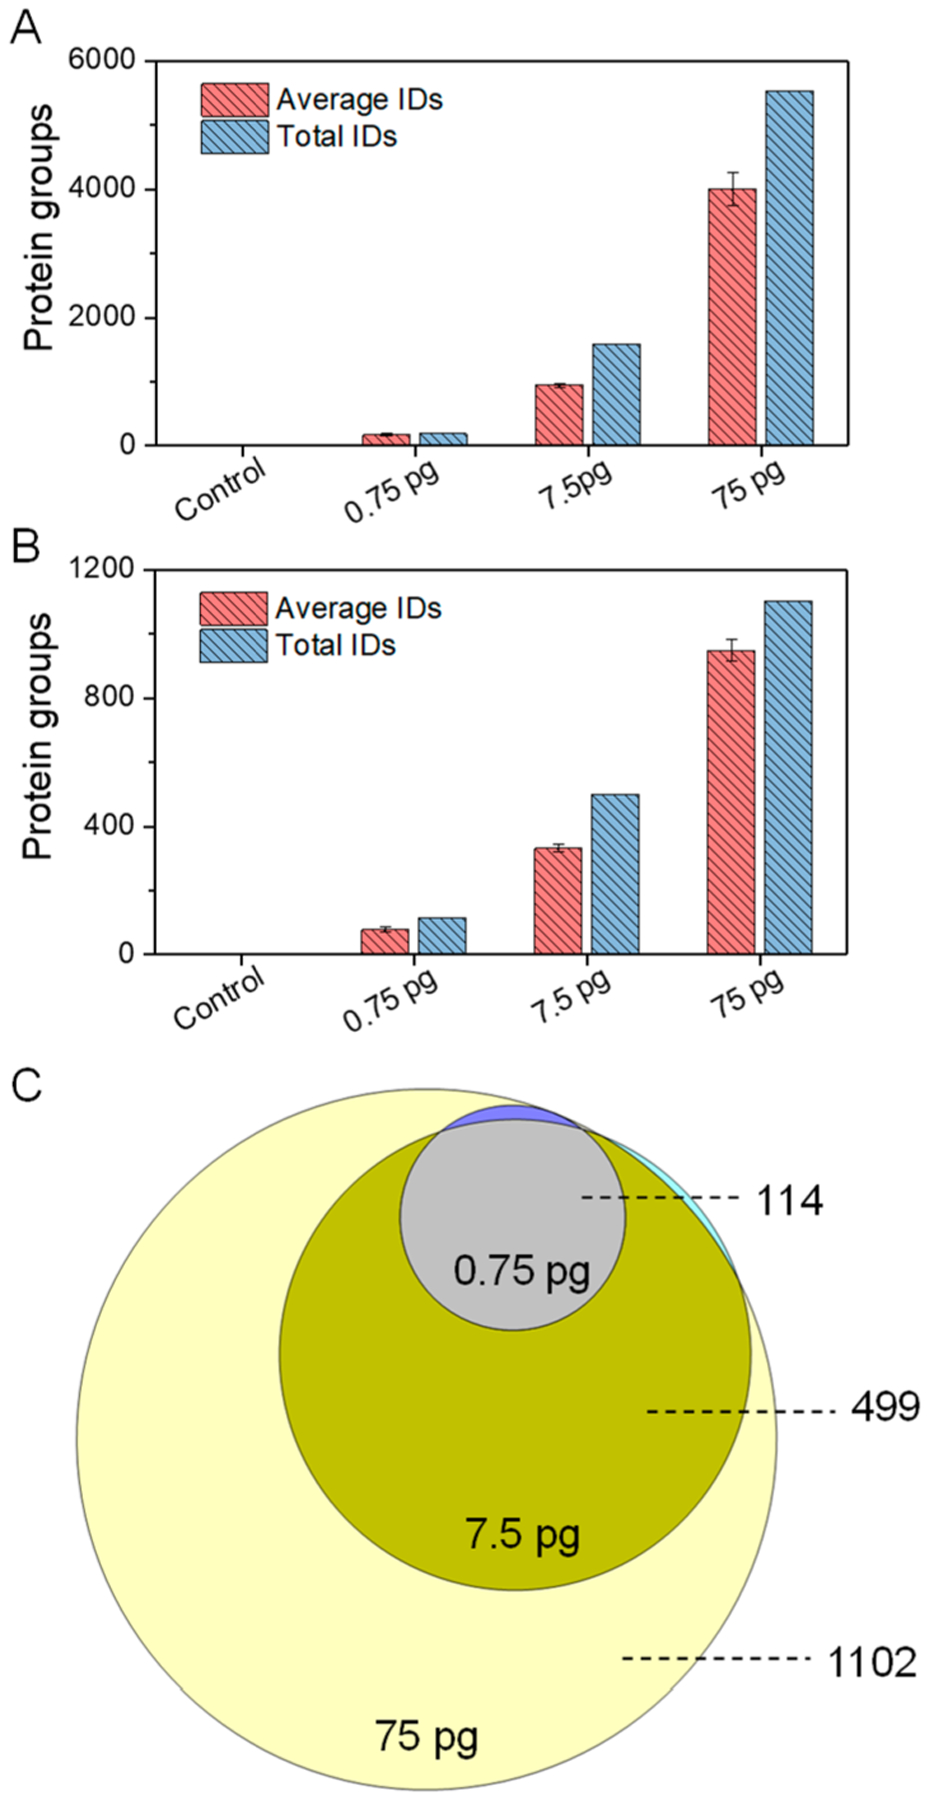
(A) Unique peptide and (B) protein group identifications (IDs) from duplicate injections of 0.75 pg, 7.5 pg, and 75 pg tryptic digests of Shewanella oneidensis using the picoLC-MS system. (C) Overlap of total protein identifications from the three peptide loadings. All peptides and proteins were identified based on MS/MS spectra using Andromeda of MaxQuant at 1% False Discovery Rate (FDR) at both peptide and protein levels.
In addition to protein identification, we next evaluate the feasibility of the picoLC-MS system for quantitative analysis. We extracted the LFQ intensities of identified proteins and performed the pairwise correlations between samples containing the same loading amounts. To increase the number of quantified proteins, we used the Match Between Runs (MBR) algorithm of MaxQuant, where peptides were identified based on accurate masses and LC retention times. To maintain high rigor and robustness, “LFQ min ratio count of 2” and “Require MS/MS for LFQ comparisons” were selected as quantification criteria. As shown in Figure 4, the picoLC-MS system was able to quantify 41, 165, and 605 proteins from 0.75, 7.5, and 75 pg samples. Pairwise correlation coefficients with R2 of 0.94, 0.86, and 0.90 were obtained between the three protein loadings (Figure 4A–C). The slight decrease of R2 with the increase of protein loading is not well understood. We suspect the picoliter-scale electrospray was operated at suboptimal conditions. Thus, the signal stability could be further improved though the use of liquid sheath flow or pulled emitters.21 We then calculated the linear correlation coefficients between loading amounts and protein LFQ intensities for all the common 41 proteins across all the samples. High linear correlation coefficients, with a median R2 of 0.98, were obtained (Figure 4F). R2 values exceeding 0.96 were observed for both high- (Peroxiredoxin TsaA) (Figure 4D) and relatively low-abundance (50S ribosomal protein L1) (Figure 4E) proteins. Together, although only picogram proteins were injected in each analysis, the picoLC-MS still provided decent quantification performance.
Figure 4.
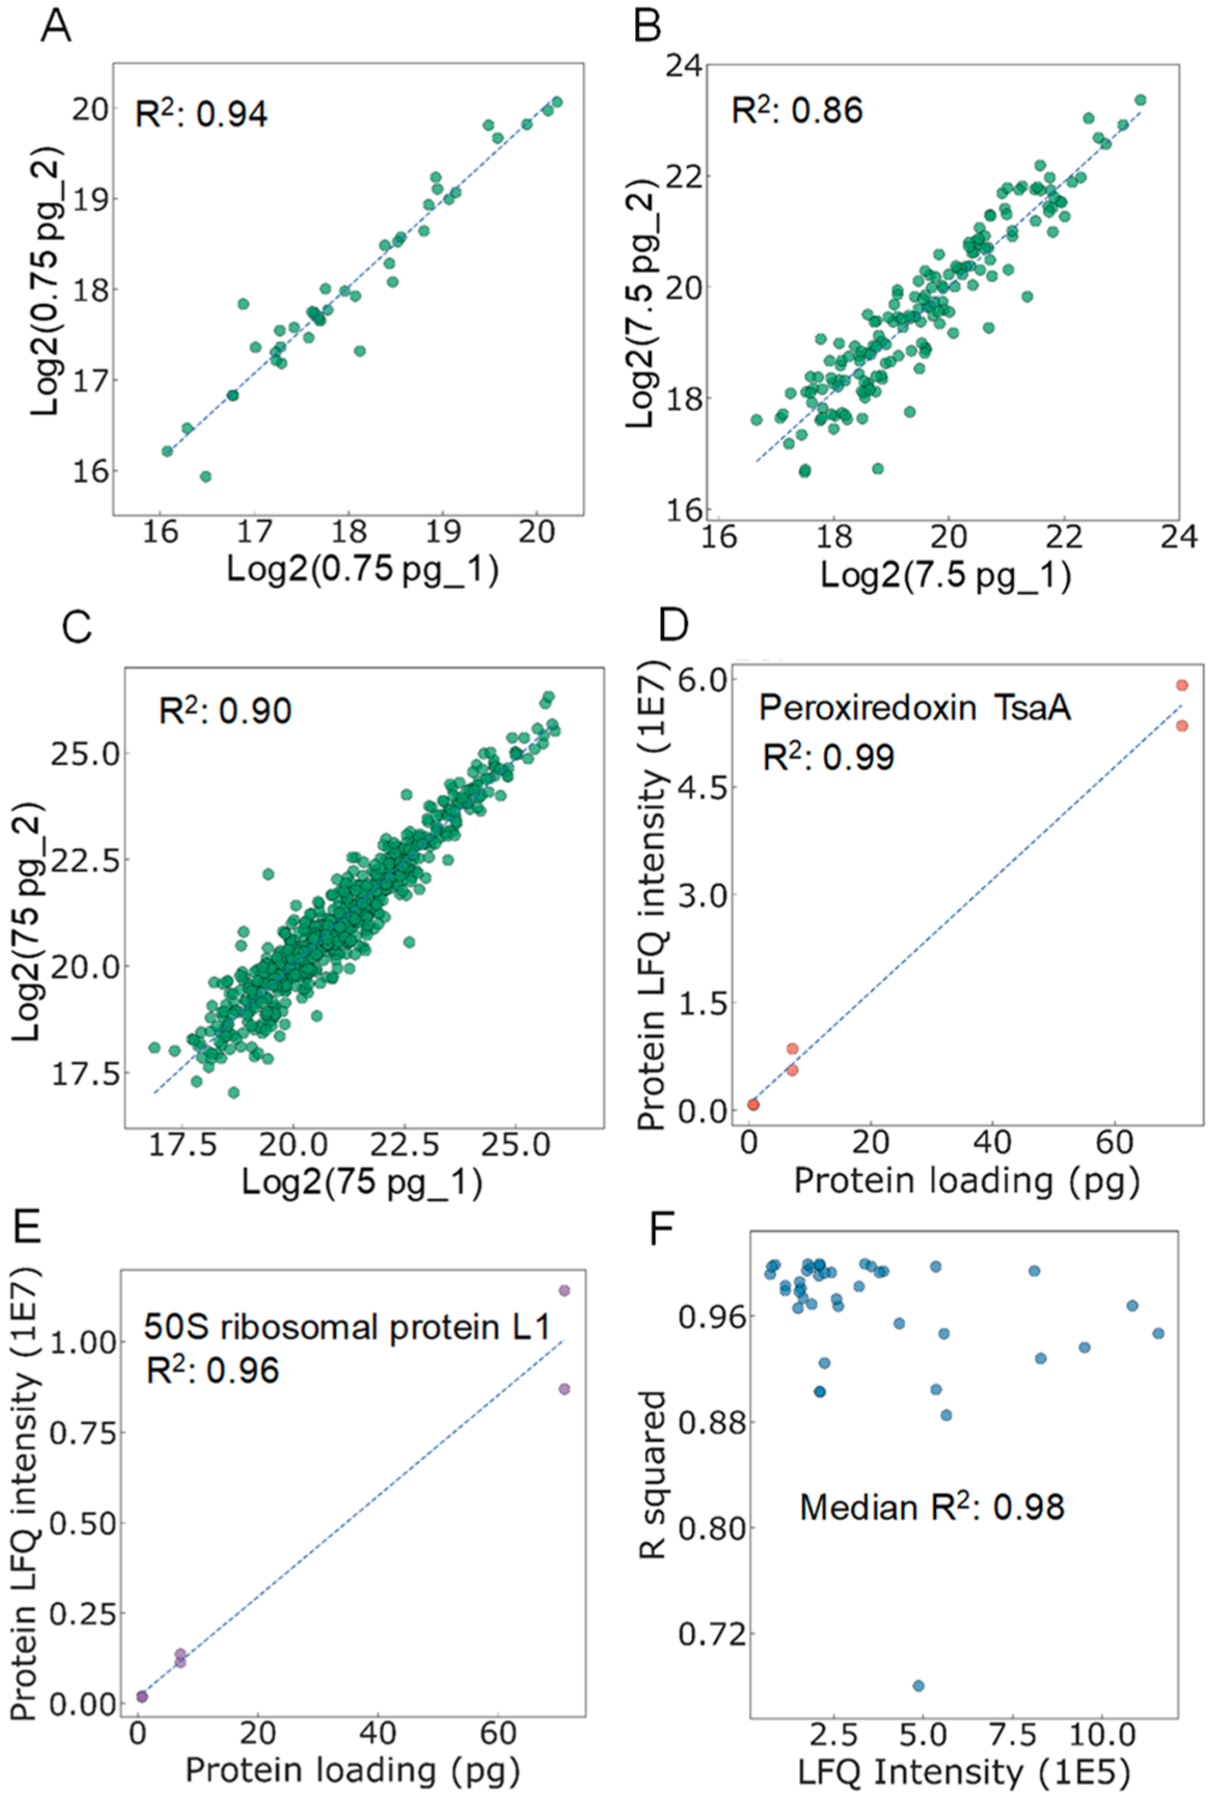
Pairwise correlation of protein LFQ intensities between samples containing the same loading amounts, including (A) 0.75 pg, (B) 7.5 pg, and (C) 75 pg tryptic digests of S. oneidensis. Linear correlations between protein loading amount and protein LFQ intensities for (D) a high-abundance protein (Peroxiredoxin TsaA) and (E) a low-abundance protein (50S ribosomal protein L1). (F) Distribution of R2 for the commonly identified 41 proteins as a function of protein LFQ intensities.
In summary, we have demonstrated that the sensitivity of LC-MS for bottom-up proteomics can be significantly improved by reducing the flow rates using a 2-μm-i.d. NOT column. To the best of our knowledge, the capability of identifying ~1000 protein groups represented the highest proteomic coverage for low picogram samples (75 pg). Given that 100–500 pg of total protein is typically contained in single mammalian cells, the picoLC-MS system provides the basis for greatly increasing proteome coverage from single cells, and even enabling fractionation or multiple measurements from a single cell to obtain valuable statistical information from technical replicates. We envision that coupling of picoLC-MS with a high-recovery sample processing platform (e.g., nanoPOTS) and loss-less injection will significantly advance single-cell proteomics. The capability of identifying ~80 proteins from sub-picogram samples also opens the door for proteomic studies of much smaller single microbes or subcellular organelle in single cells.
To make the picoLC-MS practically applicable to single cells, new developments are clearly required. Picoliter-scale LC pumps and loss-free sample injection approaches are desired to avoid using the split flow setup. Sample filtering and desalting technologies should be developed to prevent column clogging by cell debris and precipitates. To improve the stability and robustness of picoliter electrospray, a liquid sheath flow22 could be incorporated to wash away crystallized/precipitated materials from the tip and increase the overall flow rate to low nL/min range. In addition, it should be noted that there is enormous room to further improve the analytical performance. The benefits of NOTLC’s ultrafast23 and ultrahigh-resolution potential are not completely capitalized due to the suboptimal separation conditions and constrained MS sampling frequency (number of MS spectra per second), which will be included in our future development.
Supplementary Material
ACKNOWLEDGMENTS
This work is sponsored by the National Science Foundation (CHE1904645) and the Oklahoma Center for the Advancement of Science and Technology (HR17-022). Portions of the research were also supported by a Laboratory Directed Research and Development award from Pacific Northwest National Laboratory (PNNL) to Y.Z., P41 GM103493 (NIGMS) grant to R.D.S. Experimental work was performed using EMSL (grid.436923.9), a DOE Office of Science User Facility sponsored by the Office of Biological and Environmental Research.
Footnotes
Supporting Information
The Supporting Information is available free of charge at https://pubs.acs.org/doi/10.1021/acs.analchem.9b05639.
Materials and reagents, NOT column fabrication, cell culture and proteomic sample preparation, LC-MS/MS analysis, other data analysis, apparatus for coating NOT column, fabrication of electrospray emitter, TIC chromatograms used for void time calculation, calculation of injected peptide quantities, and chromatograms from using 0.75–75-pg tryptic digest of Shewanella oneidensis (PDF)
The authors declare no competing financial interest.
Contributor Information
Piliang Xiang, Department of Chemistry and Biochemistry, University of Oklahoma, Norman, Oklahoma 73019, United States;.
Ying Zhu, Environmental Molecular Sciences Laboratory, Pacific Northwest National Laboratory, Richland, Washington 99354, United States;.
Sarah M. Williams, Environmental Molecular Sciences Laboratory, Pacific Northwest National Laboratory, Richland, Washington 99354, United States
Ronald J. Moore, Biological Sciences Division, Pacific Northwest, National Laboratory Rochester, Richland, Washington 99354, United States;.
Ryan T. Kelly, Environmental Molecular Sciences Laboratory, Pacific Northwest National Laboratory, Richland, Washington 99354, United States; Department of Chemistry and Biochemistry, Brigham Young University, Provo, Utah 84604, United States;.
Richard D. Smith, Biological Sciences Division, Pacific Northwest, National Laboratory Rochester, Richland, Washington 99354, United States
Shaorong Liu, Department of Chemistry and Biochemistry, University of Oklahoma, Norman, Oklahoma 73019, United States;.
REFERENCES
- (1).Zhang B; Whiteaker JR; Hoofnagle AN; Baird GS; Rodland KD; Paulovich AG Nat. Rev. Clin. Oncol 2019, 16 (4), 256–268. [DOI] [PMC free article] [PubMed] [Google Scholar]
- (2).Aebersold R; Mann M Nature 2016, 537 (7620), 347–355. [DOI] [PubMed] [Google Scholar]
- (3).Hein MY; Sharma K; Cox J; Mann M Proteomic analysis of cellular systems In Handbook of systems biology: concepts and insights; Academic Press: 2013; pp 3–25. [Google Scholar]
- (4).Zubarev RA; Makarov A Orbitrap mass spectrometry. ACS Publications: 2013; pp 5288–5296. [DOI] [PubMed] [Google Scholar]
- (5).Hebert AS; Prasad S; Belford MW; Bailey DJ; McAlister GC; Abbatiello SE; Huguet R; Wouters ER; Dunyach J-J; Brademan DR Anal. Chem 2018, 90 (15), 9529–9537. [DOI] [PMC free article] [PubMed] [Google Scholar]
- (6).Kelly RT; Tolmachev AV; Page JS; Tang K; Smith RD Mass Spectrom. Rev 2009, 29 (2), 294–312. [DOI] [PMC free article] [PubMed] [Google Scholar]
- (7).Marginean I; Page JS; Tolmachev AV; Tang K; Smith RD Anal. Chem 2010, 82 (22), 9344–9349. [DOI] [PMC free article] [PubMed] [Google Scholar]
- (8).Shen Y; Tolić N; Masselon C; Paśa-Tolić L; Camp DG; Hixson KK; Zhao R; Anderson GA; Smith RD Anal. Chem 2004, 76 (1), 144–154. [DOI] [PubMed] [Google Scholar]
- (9).Zhu Y; Zhao R; Piehowski PD; Moore RJ; Lim S; Orphan VJ; Paśa-Tolić L; Qian W-J; Smith RD; Kelly RT Int. J. Mass Spectrom 2018, 427, 4–10. [DOI] [PMC free article] [PubMed] [Google Scholar]
- (10).Li S; Plouffe BD; Belov AM; Ray S; Wang X; Murthy SK; Karger BL; Ivanov AR Mol. Cell. Proteomics 2015, 14 (6), 1672–1683. [DOI] [PMC free article] [PubMed] [Google Scholar]
- (11).Stadlmann J; Hudecz O; Krssakova G; Van Raemdonck G; De Beeck JO; Desmet G; Penninger JM; Jacobs P; Mechtler K Anal. Chem 2019, 91, 678995. [DOI] [PMC free article] [PubMed] [Google Scholar]
- (12).Zhu Y; Piehowski PD; Zhao R; Chen J; Shen Y; Moore RJ; Shukla AK; Petyuk VA; Campbell-Thompson M; Mathews CE Nat. Commun 2018, 9 (1), 882. [DOI] [PMC free article] [PubMed] [Google Scholar]
- (13).Zhu Y; Clair G; Chrisler WB; Shen Y; Zhao R; Shukla AK; Moore RJ; Misra RS; Pryhuber GS; Smith RD Angew. Chem., Int. Ed 2018, 57 (38), 12370–12374. [DOI] [PMC free article] [PubMed] [Google Scholar]
- (14).Hara T; Futagami S; Eeltink S; De Malsche W; Baron GV; Desmet G Anal. Chem 2016, 88 (20), 10158–10166. [DOI] [PubMed] [Google Scholar]
- (15).Jorgenson JW; Guthrie EJ J. Chromatogr. A 1983, 255, 335–348. [Google Scholar]
- (16).Xiang P; Yang Y; Zhao Z; Chen A; Liu S Anal. Chem 2019, 91 (16), 10518–10523. [DOI] [PubMed] [Google Scholar]
- (17).Sun L; Zhu G; Zhao Y; Yan X; Mou S; Dovichi NJ Angew. Chem., Int. Ed 2013, 52 (51), 13661–13664. [DOI] [PMC free article] [PubMed] [Google Scholar]
- (18).Kelly RT; Page JS; Luo Q; Moore RJ; Orton DJ; Tang K; Smith RD Anal. Chem 2006, 78 (22), 7796–7801. [DOI] [PMC free article] [PubMed] [Google Scholar]
- (19).Marginean I; Tang K; Smith RD; Kelly RT J. Am. Soc. Mass Spectrom. 2014, 25 (1), 30–36. [DOI] [PMC free article] [PubMed] [Google Scholar]
- (20).Kelstrup CD; Young C; Lavallee R; Nielsen ML; Olsen JV J. Proteome Res 2012, 11 (6), 3487–3497. [DOI] [PubMed] [Google Scholar]
- (21).Yuill EM; Sa N; Ray SJ; Hieftje GM; Baker LA Anal. Chem 2013, 85 (18), 8498–8502. [DOI] [PubMed] [Google Scholar]
- (22).Sun L; Zhu G; Zhao Y; Yan X; Mou S; Dovichi NJ Angew. Chem., Int. Ed 2013, 52, 13661–13664. [DOI] [PMC free article] [PubMed] [Google Scholar]
- (23).Xiang P; Yang Y; Zhao Z; Chen M; Liu S Anal. Chem 2019, 91 (16), 10738–10743. [DOI] [PubMed] [Google Scholar]
Associated Data
This section collects any data citations, data availability statements, or supplementary materials included in this article.


