Abstract
PURPOSE
The Children’s Oncology Group (COG) stratifies the treatment of patients with neuroblastoma on the basis of a combination of biomarkers that include age and tumor histology classified by age-linked International Neuroblastoma Pathology Classification (INPC) criteria. By definition, this leads to a duplication of the prognostic contribution of age. The individual histologic features underlying the INPC have prognostic strength and are incorporated in the International Neuroblastoma Risk Group classification schema. Here, we analyzed data in the International Neuroblastoma Risk Group Data Commons to validate the prognostic strength of the underlying INPC criteria and to determine whether a risk classification devoid of the confounding of age and INPC criteria will identify new prognostic subgroups.
PATIENTS AND METHODS
Event-free survival of patients diagnosed between 1990 and 2002 (cohort 1; n = 10,104) and between 2003 and 2016 (cohort 2; n = 8,761) was analyzed. Recursive partitioning with univariate Cox models of event-free survival (“survival tree regression”) was performed using (1) individual INPC criteria (age at diagnosis, histologic category, mitosis-karyorrhexis index (MKI), grade of differentiation) and (2) factors in (1) plus other COG-risk biomarkers (International Neuroblastoma Staging System [INSS] stage, MYCN status, ploidy).
RESULTS
The independent prognostic ability of age, histologic category, MKI, and grade were validated. Four histologic prognostic groups were identified (< 18 months with low v high MKI, and ≥ 18 months with differentiating v undifferentiated/poorly differentiating tumors). Compared with survival trees generated with established COG risk criteria, an additional prognostic subgroup was identified and validated when individual histologic features were analyzed in lieu of INPC.
CONCLUSION
Replacing INPC with individual histologic features in the COG risk classification will eliminate confounding, facilitate international harmonization of risk classification, and provide a schema for more precise prognostication and refined therapeutic approaches.
INTRODUCTION
Modern treatment of patients with neuroblastoma (NB), a clinically heterogeneous pediatric malignancy, is tailored according to the predicted risk of relapse/death on the basis of a combination of prognostic biomarkers.1 However, the biomarkers used to determine eligibility for frontline risk-based clinical trials have differed by cooperative group, complicating comparisons of study results. The International Society of Pediatric Oncology Europe Neuroblastoma (SIOPEN) has tailored treatments by age, MYCN status, and extent of disease (resectable v unresectable locoregional tumors) using surgical risk factors.2 In contrast, the Children’s Oncology Group (COG) has stratified patients using age, MYCN status, International Neuroblastoma Staging System (INSS) stage, ploidy, and tumor histology using International Neuroblastoma Pathology Classification (INPC) criteria.1,3 INPC is defined by age at diagnosis, grade of neuroblast differentiation, mitosis-karyorrhexis index (MKI), and quantity of Schwannian stromal development.4 Although INPC is highly prognostic,5 its inclusion within a classification system that also includes age results in a duplication of the prognostic contribution (“confounding”) of age to define risk.6
CONTEXT
Key Objectives
To investigate if the prognostic strength of INPC criteria (age at diagnosis, histologic category, mitosis-karyorrhexis index (MKI), and grade of differentiation) has been maintained over time; and, to determine whether a risk classification using age, MKI, grade, and histologic category instead of INPC will identify new prognostic subgroups.
Knowledge Generated
The independent prognostic ability of age, histologic category, MKI, and grade were validated. Four histologic prognostic groups were identified (< 18 months with low v high MKI; ≥ 18 months with differentiating v undifferentiated/poorly differentiating tumors). A novel, unfavorable subgroup of patients ≥ 547 days with stage 1,2, MYCN non-amplified, diploid tumors and intermediate/high MKI with very poor EFS was identified and validated when individual histologic features were analyzed in lieu of INPC.
Relevance
Replacing INPC with individual histologic features in the COG Risk Classification will eliminate confounding, facilitate international harmonization of risk classification, and provide a schema for more precise prognostication and refined therapeutic approaches.
In the current COG classification, INPC is a confounder that influences both the dependent variable (event-free survival [EFS]) and the independent variable (age), causing a spurious association. MKI, grade, and diagnostic category are similarly confounded with INPC. It would be statistically inadvisable to knowingly include two confounded factors in one multivariable model or one survival regression tree. Because INPC includes age, by definition, this biomarker serves as an extra independent variable for the effect of age, resulting in a hidden effect of age on the dependent variable, EFS. Furthermore, the use of INPC prevents subdividing/reclassifying patients by age and underlying individual histologic features, because the categories of “favorable” and “unfavorable” histology are dictated by definition and not by statistical techniques to maximize the differences in EFS between subgroups. The use of INPC also mitigates our ability to identify novel, statistically independent biomarkers to further refine risk classification.
Survival-tree regression analyses on > 8,800 patients diagnosed between 1990 and 2002 were conducted evaluating the independent prognostic contributions of histologic categories (ganglioneuroma [GNR] maturing, ganglioneuroblastoma [GNB] intermixed, GNB nodular, NB), individual morphologic features (MKI, grade of differentiation), and age (<18 v ≥ 18 months [547 days]) at diagnosis to establish the International Neuroblastoma Risk Group (INRG) classification.7 This approach avoided confounding of age and INPC, and demonstrated the independent prognostic strength of diagnostic category, MKI, and grade. Age, histologic category, and grade of differentiation were included in the INRG classification. Furthermore, a new staging system using image-defined risk factors, the International Neuroblastoma Risk Group Staging System (INRGSS), was developed.8 On the basis of these findings, as well as an analysis of COG patients diagnosed between 2006 and 2016,9 revisions to the current COG NB risk classification to incorporate INRGSS are ongoing.
The objectives of this study were twofold. To investigate if the prognostic strength of the underlying INPC criteria has been maintained over time, we analyzed patients diagnosed between 1990 and 2002 (cohort 1) and between 2003 and 2016 (cohort 2). To determine whether a risk classification using age and individual histologic features (MKI, grade, diagnostic category) instead of INPC would identify new prognostic subgroups, we evaluated the prognostic strength of COG risk factors (INSS stage, age, ploidy, MYCN status) combined with individual histologic features in Test and Validation sets of cohort 2. Our results validated the prognostic significance of the individual histologic features in a recently treated cohort. Furthermore, a novel, unfavorable prognostic subgroup of patients ≥ 547 days old with stage 1,2, MYCN nonamplified, diploid tumors with intermediate/high MKI was identified.
PATIENTS AND METHODS
From the INRG Data Commons (INRGDC), 18,865 patients met the eligibility criteria: diagnosis of NB, GNB nodular, GNB intermixed, or GNR maturing diagnosed between 1990 and 2016 and known outcome data. If the diagnosis of NB was made by bone marrow aspirate and/or biopsy10 without a tumor biopsy, histology was unknown. Patients were divided into cohort 1 (diagnosed between 1990 and 2002 [n = 10,104]) and cohort 2 (diagnosed between 2003 and 2016 [n = 8,761]). Using simple random sampling, and stratified by MYCN status, cohort 2 was divided into Test (n = 4,380) and Validation (n = 4,381) sets. For each patient, the assigned treatment was either the frontline trial in which the patient was enrolled, or per the risk group if the patient did not enroll in a trial.
Each country or cooperative group submitting data from clinical trials to the INRGDC obtained institutional review board approval and informed patient consent for their respective studies. The INRGDC has approval from the University of Chicago Institutional Review Board. INRG data are publicly available.11
Statistical Analysis
The primary end point was EFS time, defined as the time from diagnosis until the first occurrence of relapse, progression, secondary malignancy, or death from any cause. If no event occurred, the EFS time was censored on the date of last contact. Overall survival (OS) time was from diagnosis until death from any cause, censored on the date of last contact if the patient was alive. After testing for proportional hazards (PH), recursive partitioning was performed with univariate Cox PH regression models of EFS, creating survival trees.12-15 To create a split in the tree, all factors were tested in the overall cohort; of the significant (P < .05) factors, the one with largest hazard ratio (HR) was selected to divide the cohort into subgroups. This procedure was repeated within subgroups until there were no more significant factors or the sample size was < 10. However, we retained splits historically present because of differences in treatment intensity among subgroups, referred to as “clinical splits.” HRs are presented with 95% CIs.
In cohort 1, age (< 18 months, ≥ 18 months), diagnostic category (NB, GNB nodular, and GNB intermixed, GNR maturing), MKI (low, intermediate, high), and grade (differentiating, undifferentiated/poorly differentiating)16 were tested for maintenance of prognostic strength over time. The histologic tree derived from cohort 1 was then applied to cohort 2 to determine if the cohort 1 findings would be supported in cohort 2. We also evaluated the prognostic strength of age, diagnostic category, MKI, and grade, when tested with COG risk criteria, INSS stage, MYCN status, and ploidy within the Test set of cohort 2. To follow the COG historical paradigm, the first splits were by INSS stage, and then the data-driven splitting process was initiated within each stage. The resulting tree was applied to the Validation set of cohort 2. Finally, only the Test set splits, which were subsequently confirmed in the Validation set, plus the clinical splits, were applied to the overall cohort 2. The overall cohort 2 was used only as a means of presenting the validated findings.
To illustrate confounding and to demonstrate the relative prognostic strength of age, diagnostic category, MKI, grade, and INPC (favorable, unfavorable), multivariable Cox PH models were generated on cohort 2. Kaplan-Meier survival curves were generated and compared using a 2-sided log-rank test; 5-year point estimates of EFS/OS (Greenwood standard errors) are presented.6
One-sided χ2 tests investigated associations of grade with age, initial treatment assignment, diagnostic category, INSS stage, MYCN status, ploidy, race, sex, and ethnicity. These factors were tested in 1-sided Cochran-Armitage tests for trend with MKI (low, intermediate, high). Within each prognostic factor, an assessment to determine whether the factor was missing completely at random was performed. Kaplan-Meier EFS curves were generated for the subgroups with known values, plus the group with missing values. If a factor was missing completely at random, then the missing group would be a mixture of patients with known and unknown values, and the Kaplan-Meier curve for the missing group would fall between the curves for the known and unknown groups.12 Analyses were performed in SAS V9.4 or R3.4.4. P values < .05 were considered statistically significant.
RESULTS
Patient Characteristics
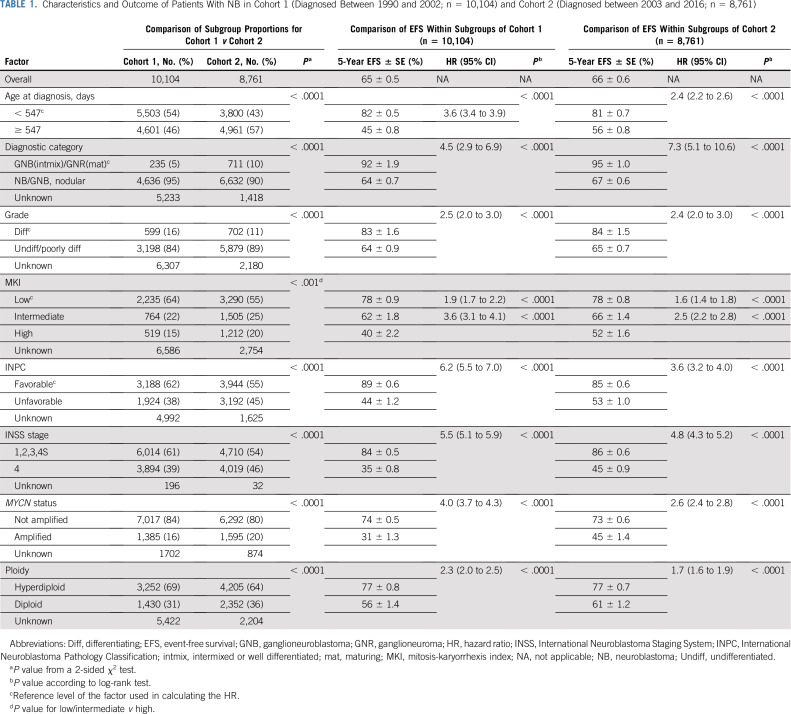
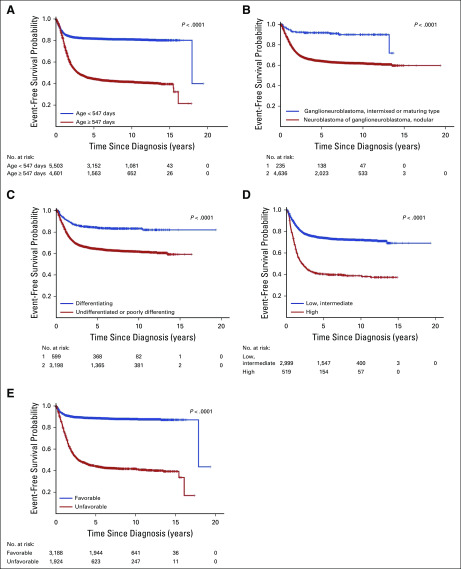
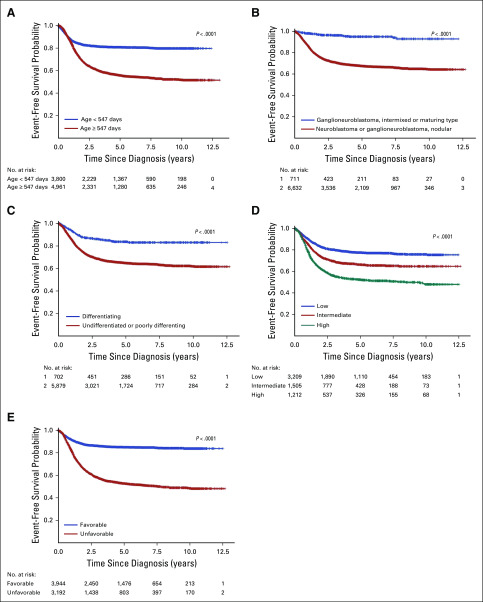
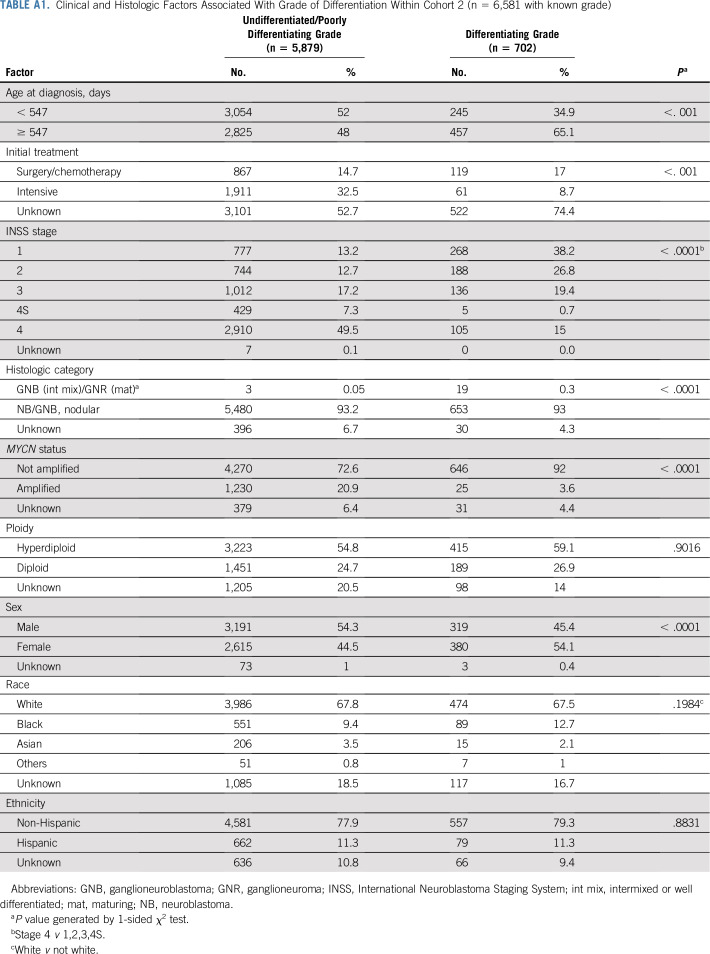
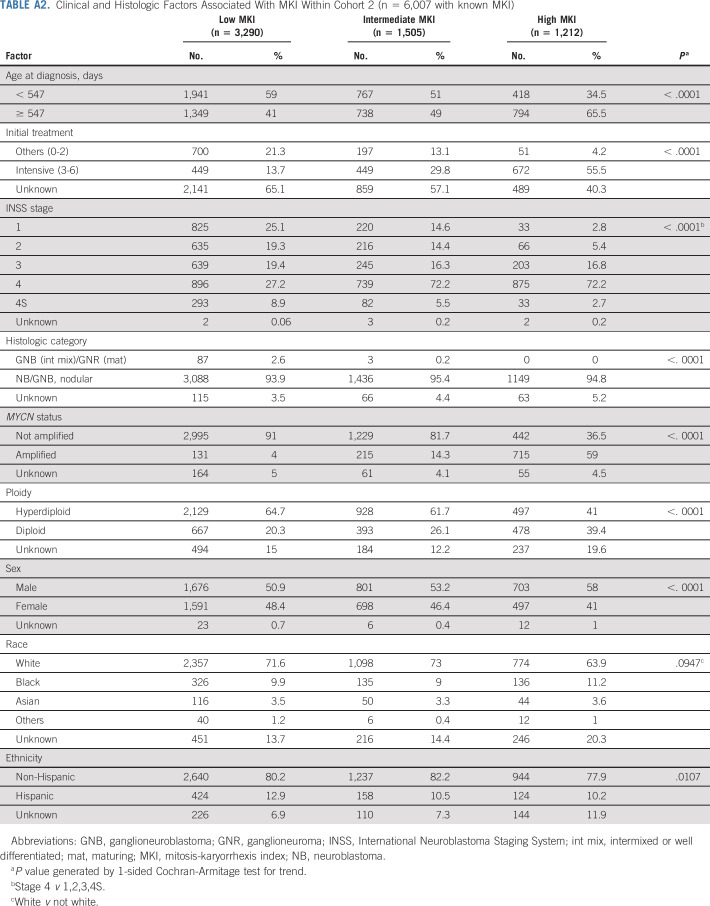
Characteristics and outcomes for cohorts 1 and 2 patients are listed in Table 1. There was a slightly higher proportion of patients with unfavorable prognostic factors in cohort 2 (n = 8,761) than in cohort 1 (n = 10,104; Table 1). Grade was statistically significantly associated with all factors except ploidy, race, and ethnicity (Appendix Table A1, online only), and MKI with all except race (Appendix Table A2, online only). The median follow-up (range) for patients without an event was 7.0 years (1 day to 19.3 years; cohort 1), and 4.1 years (1 day to 13.1 years; cohort 2). Five-year EFS and OS for cohorts 1 and 2 were 65% ± 0.5% and 70% ± 0.5%, and 66% ± 0.6% and 70% ± 0.6%, respectively (Table 1). In univariate analyses, age, histologic category, MKI, grade, and INPC were highly prognostic of EFS (P < .0001) in each cohort (Table 1; Appendix Figs A1 and A2, online only). The assumption of PH was met for all subgroup comparisons of EFS. Data were determined to be missing at random; for each factor, the EFS curve for the missing group fell in between the nonmissing groups (data not shown).
TABLE 1.
Characteristics and Outcome of Patients With NB in Cohort 1 (Diagnosed Between 1990 and 2002; n = 10,104) and Cohort 2 (Diagnosed between 2003 and 2016; n = 8,761)
Validation of Independent Prognostic Contributions of Age, Histologic Category, MKI, and Grade
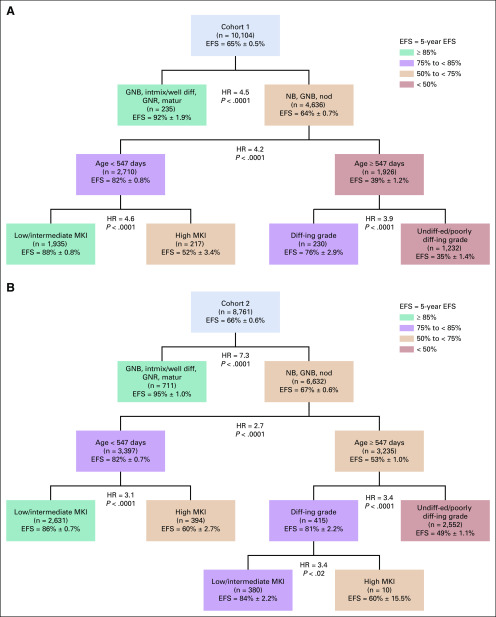
To test for changes in prognostic strength of age, histologic category, MKI, and grade with modern risk-based treatments, survival trees were generated for cohorts 1 and 2. In cohort 1, the first split was for histologic category (HR = 4.5); GNB intermixed/GNR maturing (n = 235; EFS: 92% ± 2%) formed a terminal node (no additional prognostic factors; Fig 1A). Among patients with NB/GNB nodular tumors (n = 4,636), age (HR = 4.2) was the most strongly prognostic. For patients < 18 months of age, a high MKI was associated with lower EFS than was a low/intermediate MKI (HR = 4.6). For patients ≥ 18 months of age, undifferentiated/poorly differentiating grade was associated with lower EFS than was differentiating grade (HR = 3.9; Fig 1A). Applying the histologic tree identified in cohort 1 to cohort 2, there was strong statistical evidence validating the splits and 5 distinct terminal nodes, confirming the independent prognostic contributions of age, histologic category, MKI, and grade (Fig 1B). In cohort 2, one additional split for MKI (HR = 3.4) was identified within a small subgroup (n = 10) with differentiating grade, which will require future validation.
FIG 1.
(A) Histologic survival tree resulting from univariate Cox proportional hazards models testing diagnostic category, age, grade of differentiation, and mitosis-karyorrhexis index (MKI) for cohort 1 (n = 10,104). Colors are used for descriptive purposes only. (B) Histologic survival tree resulting from cohort 1 when applied to cohort 2 (n = 8,761). Colors are used for descriptive purposes only. diff-ing, differentiating; EFS, event-free survival; GNB, ganglioneuroblastoma; GNR, ganglioneuroma; HR, hazard ratio; intmix/well diff, intermixed or well differentiated; matur, maturing; NB, neuroblastoma; nod, nodular; undiff-ed, undifferentiated.
Confounding of INPC With Age and Individual Histology Criteria
Multivariable Cox models on cohort 2 illustrate the confounding of the prognostic contribution of age, histologic category, MKI, and grade versus INPC. Models A (overall) and B (within NB/GNB nodular) show the factors’ prognostic strength, from most to least strong (ie, as ranked by HR): histologic category, age, grade, then MKI (Table 2). When INPC is added (model C), the HR of each factor decreases compared with model A because of confounding. Comparing model A with a model of INPC and another factor, evidence of confounding can be seen in the decrease of HRs: histologic category, from HR = 12.3 to HR = 4.1 (model D); age, from HR = 2.5 to HR = 1.4 (model E); MKI, from HR = 1.5 to HR = 1.2 (model F); and grade, from HR = 2.4 to HR = 1.8 (model G; Table 2).
TABLE 2.
Multivariable Cox Proportional Hazards Regression Models of Event-Free Survival, Generated on Cohort 2 (2003-2016)

Prognostic Analysis of Established COG Risk Criteria Plus Individual Histologic Factors
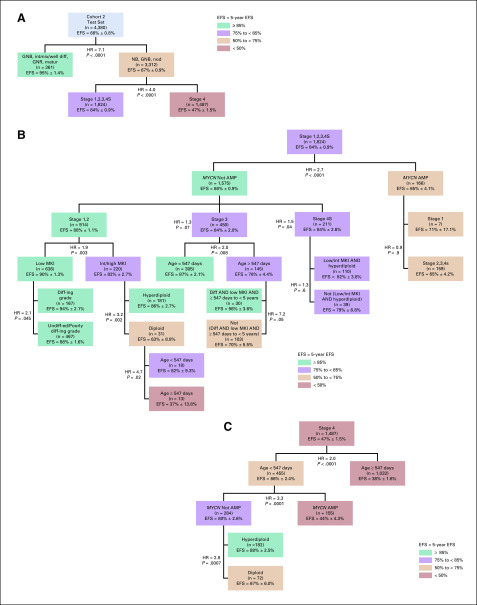
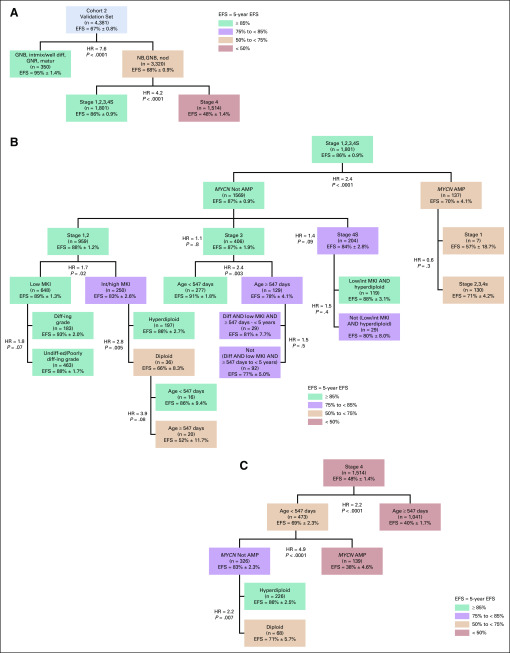
In univariate analyses, established COG risk criteria INSS stage, MYCN status, and ploidy were highly prognostic of EFS (P < .0001) in cohort 2 (Table 1). Survival trees were generated with individual INPC criteria combined with INSS stage, MYCN status, and ploidy in the Test set (n = 4,380) and applied to the Validation set (n = 4,381) of cohort 2. All but 4 of the Test splits were confirmed in the Validation set (Appendix Figs A3 and A4, online only).
Applying the Validated Nodes and Clinical Splits to the Overall Cohort 2
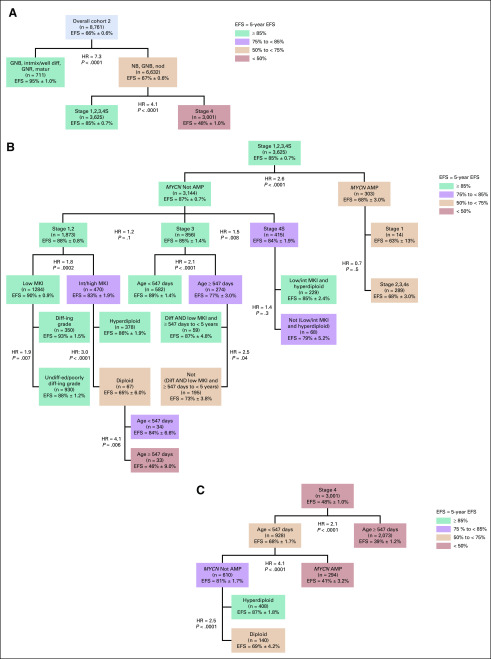
For descriptive purposes, the Test and Validation sets were combined to present the validated splits in overall cohort 2 (Fig 2). With the exception of those for clinical splits, all P values were < .0001. The first split was histologic category (HR = 7.6); the subgroup with GNB intermixed/GNR maturing (n = 711; EFS, 95% ± 1.0%) formed a terminal node (Fig 2A). For patients with NB/GNB nodular tumors (n = 6,632; EFS, 67% ± 0.6%), stage was the most powerful prognostic factor (HR = 4.1), with significantly inferior outcome for stage 4 disease (n = 3,001) than for non–stage 4 (n = 3,625; EFS, 48% ± 1.0% and 85% ± 0.7%, respectively).
FIG 2.
Tree using established Children’s Oncology Group risk criteria plus individual histologic factors in lieu of International Neuroblastoma Pathology Classification in overall cohort 2 (ie, after combining the Test and Validation sets [n = 8,761]). Only the splits and terminal nodes that were identified in the Test set and subsequently confirmed in the Validation set, plus the clinical splits, have been presented. Colors are used for descriptive purposes only. (A) Top 2 splits by histology category and INSS stage. (B) Nodes within International Neuroblastoma Staging System (INSS) stages 1,2,3,4S. (C) Nodes within INSS stage 4. AMP, MYCN amplified; Diff, differentiating; diff-ing, differentiating; EFS, event-free survival; GNB, ganglioneuroblastoma; GNR, ganglioneuroma; HR, hazard ratio; int, intermediate; intmix/well diff, intermixed or well differentiated; matur, maturing; MKI, mitosis-karyorrhexis index; NB, neuroblastoma; nod, nodular; undiff-ed, undifferentiated.
Subclassification of Non–Stage 4 Patients
Among patients with stages 1,2,3, or 4S disease, MYCN status was the most powerful prognostic marker (HR = 2.6, nonamplified [n = 3,144], EFS, 87% ± 0.7%; amplified [n = 303], EFS, 68% ± 3.0%; Fig 2B). Although EFS for patients with stages 1,2,3,4S was not statistically significantly different by stage, treatment approaches differ substantially. Patients with stages 1,2 disease are commonly treated with surgery alone, although some infants with small localized tumors have been observed without surgery.17,18 Patients with stage 3 NB commonly undergo surgery plus chemotherapy,19 and a subset ≥ 18 months old have been treated with high-risk strategies (myeloblative therapy, stem-cell transplantation).20-22 Infants with stage 4S disease are commonly observed,17 although some will receive chemotherapy and/or radiation if symptomatic.23 On the basis of marked treatment strategy differences, clinical splits were applied between stage 1,2 patients, versus stage 3, versus stage 4S patients; and between stage 1 versus stage 2,3,4S among patients with MYCN amplified tumors. Additional clinical splits were applied to replicate the treatment differences imposed by INPC: one within the cohort ≥ 547 days of age with stage 3, MYCN nonamplified tumors, between those ≥ 547 days to 5 years of age with differentiating grade and low MKI, versus all others24,25; and one within the cohort < 547 days old with stage 4S, MYCN nonamplified tumors, between those with low/intermediate MKI and hyperdiploidy versus all others.
Within the MYCN nonamplified, stage 1,2 cohort (n = 1,873), those with low MKI (n = 1,284) had significantly higher EFS than those with intermediate/high MKI (n = 470; HR = 1.8; EFS, 90% ± 0.9% and 83% ± 1.9%, respectively; Fig 2B). Among patients with MYCN nonamplified, stage 1,2, intermediate/high MKI tumors, ploidy was the most powerful prognostic marker (HR = 3.0; EFS, hyperdiploid, 86% ± 1.9% [n = 378]; diploid, 65% ± 6.0% [n = 67]). In patients with MYCN nonamplified, stage 1,2, intermediate/high MKI diploid tumors, a new unfavorable subgroup of patients ≥ 547 days of age was identified with EFS of 46% ± 9.0% (n = 33).
The most powerful prognostic marker for patients with MYCN nonamplified stage 3 tumors was age (HR = 2.1), with significantly inferior EFS for those ≥ 18 months of age (77% ± 3.0%; n = 274) versus < 18 months of age (89% ± 1.4%; n = 582; Fig 2B). For patients with MYCN nonamplified stage 3 tumors ≥ 547 days to 5 years old with differentiating grade and low MKI (n = 59), EFS was 87% ± 4.8% versus 73% ± 3.8 for the balance of patients (n = 195). The 5-year EFS and OS for the 9 patients ≥ 5 years old with stage 3 tumors with differentiating grade and low MKI were 47% ± 23% and 88% ± 12%, respectively. Within the MYCN nonamplified, stage 4S cohort, EFS for patients with low/intermediate MKI and hyperdiploid tumors (n = 229) was 85% ± 2.4% versus 79% ± 5.2% for the balance of patients (n = 68).
Subclassification of Patients With Stage 4 Disease
Age (HR = 2.1) was the strongest prognostic variable in patients with stage 4 tumors (n = 3,001; EFS, 68% ± 1.7% for < 18 months [n = 928] and 39% ± 1.2% for ≥ 18 months [n = 2,073]; Fig 2C). Within the stage 4 cohort < 18 months, MYCN status was the strongest prognostic marker, with inferior outcome for those with (n = 294) versus those without (n = 610) MYCN amplification (EFS, 41% ± 3.2% and 81% ± 1.7%, respectively). Ploidy (HR = 2.5) was the most strongly prognostic marker within stage 4, MYCN nonamplified, younger patients, with higher EFS for hyperdiploidy (n = 408; 87% ± 1.8%) compared with diploidy (n = 408; 69% ± 4.2%).
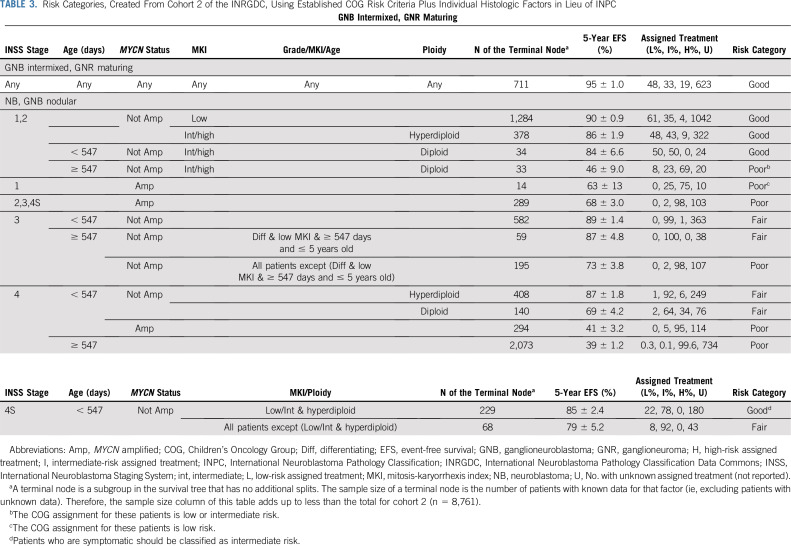
The final tree has also been presented as Table 3. To subjectively assign risk category to each statistically/clinically unique table row, the proportion of patients according to their assigned treatment was considered.
TABLE 3.
Risk Categories, Created From Cohort 2 of the INRGDC, Using Established COG Risk Criteria Plus Individual Histologic Factors in Lieu of INPC
DISCUSSION
In a step toward harmonizing NB risk assignment for patients around the world, the current COG risk classification is being revised to incorporate the pretreatment imaging-based staging system (INRGSS).9 However, histology criteria also differ in the COG and INRG schemas.3,7 The INRG classification includes age and individual histologic features underlying INPC,7 whereas the current COG risk algorithm includes both INPC and age.3 Here, we provide statistical support for replacing INPC with individual histologic features in the COG risk classification. Our analysis of 18,865 patients validates the independent prognostic strength of age, histologic category, MKI, and grade of differentiation, and demonstrates that these biomarkers remain prognostic over time. Furthermore, using a risk schema devoid of the confounding of age and INPC, a novel, unfavorable subgroup of patients ≥ 547 days of age with stage 1,2, MYCN nonamplified, diploid tumors and intermediate/high MKI with poor EFS was identified.
To account for differences in treatment approaches by stage (1,2 v 3, v 4S),1 clinical splits were applied. Similarly, because patients with MYCN amplified stage 1 tumor are commonly treated with surgery alone in COG institutions,26,27 whereas those with stage 2,3,4S MYCN amplified tumors are generally treated with intensive, high-risk regimens,28 a clinical split was also applied to this cohort. Furthermore, to replicate treatment differences imposed by INPC within the cohort ≥ 547 days old with stage 3, MYCN nonamplified tumors, a clinical split was applied between the cohort ≥ 547 days to < 5 years old with differentiating grade and low MKI (who commonly receive intermediate-risk therapy), versus all others, who are generally treated with high-risk strategies.1,20 Because only nine patients ≥ 5 years of age with differentiating grade and low MKI were identified (0.1% of cohort 2), the optimal treatment stratification for this rare cohort remains unclear. Last, to replicate treatment differences imposed by INPC within stage 4S, MYCN nonamplified patients, a clinical split was applied between patients with low/intermediate MKI and hyperdiploid tumors, who commonly undergo spontaneous regression and are observed, versus the balance of patients, who are generally treated with intermediate-risk chemotherapy.
A limitation of this study is that the INRGDC lacks data about the frontline treatment actually received, although the “assigned” treatment was reported for many patients. Furthermore, INRGSS,8 which has become the international standard for disease staging, is not yet available for the vast majority of patients in the INRGDC. Thus, INSS was used to conduct this analysis. Of note, a large proportion of patients in cohort 2 was recently analyzed to determine the clinical validity of incorporating INRGSS instead of INSS in a revised COG NB risk classification.9
In principle alone, there is statistical methodologic support for a revised classification to incorporate the underlying INPC histologic features instead of INPC to eliminate confounding. We advocate for an international risk classification for frontline treatment assignment, with harmonized histologic criteria, to permit comparison of trial outcomes between COG and the SIOPEN, greatly facilitating our ability to identify optimal strategies for prognostic subgroups. Integration of individual histologic features of INPC into the COG risk classification may provide more precise prognostication, enabling refined treatment approaches. For future NB risk classifications, new genomic biomarkers (eg, segmental chromosome aberrations and copy number changes,29,30 gene expression,31 mutational profiles,32 and telomere mechanisms33) should be tested in comparison with individual histologic factors and other existing prognostic factors, to further tailor treatment and improve outcome.
ACKNOWLEDGMENT
The International Neuroblastoma Risk Group Data Commons is supported in part by the William Guy Forbeck Research Foundation, the St. Baldrick’s Foundation, the Little Heroes Cancer Research Fund, the Children’s Neuroblastoma Cancer Foundation, the Neuroblastoma Children’s Cancer Foundation, the Super Jake Foundation, the Matthew Bittker Foundation, the Alex’s Lemonade Stand Foundation, the Rally Foundation for Childhood Cancer Research, and the Bear Necessities Pediatric Research Foundation. Data included in the International Neuroblastoma Risk Group Data Commons were provided by the Children’s Oncology Group, the Pediatric Oncology Group, the Children’s Cancer Study Group, the German Gesellschaft für Pädiatrische Onkologie und Hämatologie, the European Neuroblastoma Study Group, the International Society of Paediatric Oncology Europe Neuroblastoma Group, the Japanese Neuroblastoma Study Group, the Japanese Infantile Neuroblastoma Co-operative Study Group, the Spanish Neuroblastoma Group, and the Italian Neuroblastoma Group.
APPENDIX
FIG A1.
Within cohort 1, Kaplan-Meier curves of event-free survival. (A) By age: < 547 days (n = 5,503) v ≥ 547 days (n = 4,601), P < .0001. (B) By diagnostic category: ganglioneuroblastoma, intermixed or maturing type (n = 235), v neuroblastoma, nodular (n = 4,636); P < .001. (C) By grade: differentiating (n = 599) v undifferentiated or poorly differentiating (n = 3198), P < .0001. (D) By mitosis-karyorrhexis index (MKI): low, intermediate (n = 2,999) v high (n = 519); P < .0001. (E) By International Neuroblastoma Pathology Classification: favorable (n = 3188) v unfavorable (n = 1,924), P < .0001. The number of patients at risk for an event, by subgroup and over time, is shown below each plot.
FIG A2.
Within cohort 2, Kaplan-Meier curves of event-free survival. (A) By age: < 547 days (n = 3,800) v ≥ 547 days (n = 4,961), P < .0001. (B) By diagnostic category: ganglioneuroblastoma, intermixed or maturing type (n = 711) v neuroblastoma, nodular (n = 6,632); P < .0001. (C) By grade: differentiating (n = 702) v undifferentiated or poorly differentiating (n = 5,879), P < .0001. (D) By mitosis-karyorrhexis index: low (n = 3,290) v intermediate (n = 1,505) and high (n = 1,212), P < .0001. (E) By International Neuroblastoma Pathology Classification: favorable (n = 3,944) v unfavorable (n = 3,192), P < .0001. The number of patients at risk for an event, by subgroup and over time, is shown below each plot.
FIG A3.
Tree using established Children’s Oncology Group risk criteria plus individual histologic factors in lieu of International Neuroblastoma Pathology Classification in cohort 2, Test set (n = 4,380). (A) Top 2 splits by histology category and INSS stage. (B) Nodes within INSS stages 1,2,3,4S. (C) Nodes within International Neuroblastoma Staging System (INSS) stage 4. Colors are used for descriptive purposes only. AMP, MYCN amplified; diff, differentiating; diff-ing, differentiating; EFS, event-free survival; GNB, ganglioneuroblastoma; GNR, ganglioneuroma; HR, hazard ratio; int, intermediate; intmix/well diff, intermixed or well differentiated; matur, maturing; MKI, mitosis-karyorrhexis index; NB, neuroblastoma; nod, nodular; undiff-ed, undifferentiated.
FIG A4.
Tree using established Children’s Oncology Group risk criteria plus individual histologic factors in lieu of International Neuroblastoma Pathology Classification in cohort 2, Validation set (n = 4,381). (A) Top 2 splits by histology category and INSS stage. (B) Nodes within INSS stages 1,2,3,4S. (C) Nodes within INSS stage 4. Colors are used for descriptive purposes only. Applying the structure/nodes identified within the Test set of cohort 2 to the Validation set of cohort 2, all of the nonclinical splits were able to be confirmed, with the exception of the following 2: (1) the split for grade within stage 1,2 MYCN nonamplified, low mitosis-karyorrhexis index (MKI) tumors and (2) the split for age within stage 1,2 MYCN nonamplified, intermediate/high MKI, diploid tumors. AMP, MYCN amplified; diff, differentiating; diff-ing, differentiating; EFS, event-free survival; GNB, ganglioneuroblastoma; GNR, ganglioneuroma; HR, hazard ratio; int, intermediate; intmix/well diff, intermixed or well differentiated; matur, maturing; NB, neuroblastoma; nod, nodular; undiff-ed, undifferentiated.
TABLE A1.
Clinical and Histologic Factors Associated With Grade of Differentiation Within Cohort 2 (n = 6,581 with known grade)
TABLE A2.
Clinical and Histologic Factors Associated With MKI Within Cohort 2 (n = 6,007 with known MKI)
Footnotes
Presented in part at the Advances in Neuroblastoma Research Association meeting, San Francisco, CA, May 9-12, 2018, and at the American Society of Clinical Oncology Annual Meeting, Chicago, IL, May 31-June 5, 2007.
AUTHOR CONTRIBUTIONS
Conception and design: Elizabeth Sokol, Dominique Valteau-Couanet, Julie R. Park, Andrew D.J. Pearson, Susan L. Cohn, Wendy B. London
Financial support: Susan L. Cohn, Wendy B. London
Administrative support: Wendy B. London
Provision of study material or patients: Dominique Valteau-Couanet, Meredith S. Irwin, Michael Hogarty, Susan L. Cohn
Collection and assembly of data: Elizabeth Sokol, Ami V. Desai, Dominique Valteau-Couanet, Gudrun Schleiermacher, Michael Hogarty, Samuel Volchenboum, Susan L. Cohn, Wendy B. London
Data analysis and interpretation: Elizabeth Sokol, Ami V. Desai, Mark A. Applebaum, Julie R. Park, Gudrun Schleiermacher, Meredith S. Irwin, Arlene Naranjo, Susan L. Cohn, Wendy B. London
Manuscript writing: All authors
Final approval of manuscript: All authors
Accountable for all aspects of the work: All authors
AUTHORS' DISCLOSURES OF POTENTIAL CONFLICTS OF INTEREST
Age, Diagnostic Category, Tumor Grade, and Mitosis-Karyorrhexis Index Are Independently Prognostic in Neuroblastoma: An INRG Project
The following represents disclosure information provided by authors of this manuscript. All relationships are considered compensated unless otherwise noted. Relationships are self-held unless noted. I = Immediate Family Member, Inst = My Institution. Relationships may not relate to the subject matter of this manuscript. For more information about ASCO's conflict of interest policy, please refer to www.asco.org/rwc or ascopubs.org/jco/authors/author-center.
Open Payments is a public database containing information reported by companies about payments made to US-licensed physicians (Open Payments).
Ami V. Desai
Stock and Other Ownership Interests: Pfizer
Consulting or Advisory Role: Merck
Research Funding: Merck (Inst), Roche (Inst), Jubilant DraxImage (Inst)
Travel, Accommodations, Expenses: GlaxoSmithKline
Dominique Valteau-Couanet
Consulting or Advisory Role: Eusapharma (Inst)
Research Funding: Orphelia (Inst)
Patents, Royalties, Other Intellectual Property: Royalties from Apeiron to the International Society of Pediatric Oncology Europe Neuroblastoma (Inst)
Travel, Accommodations, Expenses: Eusapharma, Jazz Pharmaceuticals
Andrew D.J. Pearson
Consulting or Advisory Role: Eli Lilly, Takeda, Merck, Celgene
Travel, Accommodations, Expenses: Eli Lilly, Takeda, Merck, Celgene
Gudrun Schleiermacher
Honoraria: Bristol-Myers Squibb
Research Funding: Bristol-Myers Squibb (Inst), Pfizer (Inst), MSDavenir (Inst), Roche (Inst)
Travel, Accommodations, Expenses: Roche
Meredith S. Irwin
Honoraria: Bayer Canada
Arlene Naranjo
Consulting or Advisory Role: Novartis
Sam Volchenboum
Stock and Other Ownership Interests: Litmus Health
Honoraria: Sanford Health
Consulting or Advisory Role: CVS Accordant
Research Funding: AbbVie (Inst)
Susan L. Cohn
Stock and Other Ownership Interests: United Therapeutics (I), United Therapeutics, Merck, Stryker (I), Stryker, Amgen (I), Pfizer (I), AbbVie, Amgen, Jazz Pharmaceuticals, Eli Lilly, Sanofi, Varex Imaging, Pfizer, Accelerated Medical Diagnostics, Anthem INC, Cardinal Health, Novo Nordisk, Regeneron, Zimmer BioMet
Research Funding: United Therapeutics (Inst), Merck (Inst)
Wendy B. London
Consulting or Advisory Role: ArQule, Jubilant Draximage
Research Funding: Agios, Bristol-Myers Squibb, Novartis, Aileron Therapeutics, Bluebird Bio
Travel, Accommodations, Expenses: ArQule
No other potential conflicts of interest were reported.
REFERENCES
- 1.Pinto NR, Applebaum MA, Volchenboum SL, et al. Advances in risk classification and treatment strategies for neuroblastoma. J Clin Oncol. 2015;33:3008–3017. doi: 10.1200/JCO.2014.59.4648. [DOI] [PMC free article] [PubMed] [Google Scholar]
- 2.Cecchetto G, Mosseri V, De Bernardi B, et al. Surgical risk factors in primary surgery for localized neuroblastoma: The LNESG1 study of the European International Society of Pediatric Oncology Neuroblastoma Group. J Clin Oncol. 2005;23:8483–8489. doi: 10.1200/JCO.2005.02.4661. [DOI] [PubMed] [Google Scholar]
- 3.Maris JM, Hogarty MD, Bagatell R, et al. Neuroblastoma. Lancet. 2007;369:2106–2120. doi: 10.1016/S0140-6736(07)60983-0. [DOI] [PubMed] [Google Scholar]
- 4.Shimada H, Ambros IM, Dehner LP, et al. The international neuroblastoma pathology classification (the Shimada system) Cancer. 1999;86:364–372. [PubMed] [Google Scholar]
- 5.Sano H, Bonadio J, Gerbing RB, et al. International neuroblastoma pathology classification adds independent prognostic information beyond the prognostic contribution of age. Eur J Cancer. 2006;42:1113–1119. doi: 10.1016/j.ejca.2005.11.031. [DOI] [PubMed] [Google Scholar]
- 6. London WB, Shimada H, d’Amore ES, et al: Age, tumor grade, and MKI are independently predictive of outcome in neuroblastoma. American Society of Clinical Oncology Annual Meeting, June 3, 2007. [Google Scholar]
- 7.Cohn SL, Pearson AD, London WB, et al. The International Neuroblastoma Risk Group (INRG) classification system: An INRG Task Force report. J Clin Oncol. 2009;27:289–297. doi: 10.1200/JCO.2008.16.6785. [DOI] [PMC free article] [PubMed] [Google Scholar]
- 8.Monclair T, Brodeur GM, Ambros PF, et al. The International Neuroblastoma Risk Group (INRG) staging system: An INRG Task Force report. J Clin Oncol. 2009;27:298–303. doi: 10.1200/JCO.2008.16.6876. [DOI] [PMC free article] [PubMed] [Google Scholar]
- 9.Naranjo A, Irwin MS, Hogarty MD, et al. Statistical framework in support of a revised Children’s Oncology Group neuroblastoma risk classification system. JCO Clin Cancer Inform. 2018;2:1–15. doi: 10.1200/CCI.17.00140. [DOI] [PMC free article] [PubMed] [Google Scholar]
- 10.Brodeur GM, Pritchard J, Berthold F, et al. Revisions of the international criteria for neuroblastoma diagnosis, staging, and response to treatment. J Clin Oncol. 1993;11:1466–1477. doi: 10.1200/JCO.1993.11.8.1466. [DOI] [PubMed] [Google Scholar]
- 11. International Neuroblastoma Risk Group: Data Commons. http://inrgdb.org/publication-policy/apply/
- 12.Cox DR. Regression models and life-tables. J R Stat Soc B. 1972;34:187–220. [Google Scholar]
- 13. Segal MR: Regression trees for censored data. Biometrics 44:35-47, 1988 https://www.jstor.org/stable/2531894?seq=1. [Google Scholar]
- 14.Davis RB, Anderson JR. Exponential survival trees. Stat Med. 1989;8:947–961. doi: 10.1002/sim.4780080806. [DOI] [PubMed] [Google Scholar]
- 15.Leblanc M, Crowley J. Survival trees by goodness of split. J Am Stat Assoc. 1993;88:457–467. [Google Scholar]
- 16.Shimada H, Ambros IM, Dehner LP, et al. Terminology and morphologic criteria of neuroblastic tumors: Recommendations by the International Neuroblastoma Pathology Committee. Cancer. 1999;86:349–363. [PubMed] [Google Scholar]
- 17.Strother DR, London WB, Schmidt ML, et al. Outcome after surgery alone or with restricted use of chemotherapy for patients with low-risk neuroblastoma: Results of Children’s Oncology Group study P9641. J Clin Oncol. 2012;30:1842–1848. doi: 10.1200/JCO.2011.37.9990. [DOI] [PMC free article] [PubMed] [Google Scholar]
- 18.Nuchtern JG, London WB, Barnewolt CE, et al. A prospective study of expectant observation as primary therapy for neuroblastoma in young infants: A Children’s Oncology Group study. Ann Surg. 2012;256:573–580. doi: 10.1097/SLA.0b013e31826cbbbd. [DOI] [PMC free article] [PubMed] [Google Scholar]
- 19.Matthay KK, Perez C, Seeger RC, et al. Successful treatment of stage III neuroblastoma based on prospective biologic staging: A Children’s Cancer Group study. J Clin Oncol. 1998;16:1256–1264. doi: 10.1200/JCO.1998.16.4.1256. [DOI] [PubMed] [Google Scholar]
- 20.Park JR, Villablanca JG, London WB, et al. Outcome of high-risk stage 3 neuroblastoma with myeloablative therapy and 13-cis-retinoic acid: A report from the Children’s Oncology Group. Pediatr Blood Cancer. 2009;52:44–50. doi: 10.1002/pbc.21784. [DOI] [PMC free article] [PubMed] [Google Scholar]
- 21. Park JR, Kreissman SG, London WB, et al: A phase III randomized clinical trial (RCT) of tandem myeloablative autologous stem cell transplant (ASCT) using peripheral blood stem cell (PBSC) as consolidation therapy for hgih-risk neuroblastoma (HR-NB): A Children's Oncology Group (COG) study. J Clin Oncol. 34:abstr LBA3, 2016. [Google Scholar]
- 22.Park JR, Kreissman SG, London WB, et al. Effect of tandem autologous stem cell transplant vs single transplant on event-free survival in patients with high-risk neuroblastoma: A randomized clinical trial. JAMA. 2019;322:746–755. doi: 10.1001/jama.2019.11642. [DOI] [PMC free article] [PubMed] [Google Scholar]
- 23.Twist CJ, Naranjo A, Schmidt ML, et al. Defining risk factors for chemotherapeutic intervention in infants with stage 4S neuroblastoma: A report from the Children’s Oncology Group Study ANBL0531. J Clin Oncol. 2019;37:115–124. doi: 10.1200/JCO.18.00419. [DOI] [PMC free article] [PubMed] [Google Scholar]
- 24.Shimada H, Umehara S, Monobe Y, et al. International neuroblastoma pathology classification for prognostic evaluation of patients with peripheral neuroblastic tumors: A report from the Children’s Cancer Group. Cancer. 2001;92:2451–2461. doi: 10.1002/1097-0142(20011101)92:9<2451::aid-cncr1595>3.0.co;2-s. [DOI] [PubMed] [Google Scholar]
- 25.Peuchmaur M, d’Amore ES, Joshi VV, et al. Revision of the International Neuroblastoma Pathology Classification: Confirmation of favorable and unfavorable prognostic subsets in ganglioneuroblastoma, nodular. Cancer. 2003;98:2274–2281. doi: 10.1002/cncr.11773. [DOI] [PubMed] [Google Scholar]
- 26.Bagatell R, Beck-Popovic M, London WB, et al. Significance of MYCN amplification in international neuroblastoma staging system stage 1 and 2 neuroblastoma: A report from the International Neuroblastoma Risk Group database. J Clin Oncol. 2009;27:365–370. doi: 10.1200/JCO.2008.17.9184. [DOI] [PMC free article] [PubMed] [Google Scholar]
- 27.Schneiderman J, London WB, Brodeur GM, et al. Clinical significance of MYCN amplification and ploidy in favorable-stage neuroblastoma: A report from the Children’s Oncology Group. J Clin Oncol. 2008;26:913–918. doi: 10.1200/JCO.2007.13.9493. [DOI] [PubMed] [Google Scholar]
- 28.Kreissman SG, Seeger RC, Matthay KK, et al. Purged versus non-purged peripheral blood stem-cell transplantation for high-risk neuroblastoma (COG A3973): A randomised phase 3 trial. Lancet Oncol. 2013;14:999–1008. doi: 10.1016/S1470-2045(13)70309-7. [DOI] [PMC free article] [PubMed] [Google Scholar]
- 29.Schleiermacher G, Janoueix-Lerosey I, Ribeiro A, et al. Accumulation of segmental alterations determines progression in neuroblastoma. J Clin Oncol. 2010;28:3122–3130. doi: 10.1200/JCO.2009.26.7955. [DOI] [PubMed] [Google Scholar]
- 30.Schleiermacher G, Michon J, Huon I, et al. Chromosomal CGH identifies patients with a higher risk of relapse in neuroblastoma without MYCN amplification. Br J Cancer. 2007;97:238–246. doi: 10.1038/sj.bjc.6603820. [DOI] [PMC free article] [PubMed] [Google Scholar]
- 31.Oberthuer A, Hero B, Berthold F, et al. Prognostic impact of gene expression-based classification for neuroblastoma. J Clin Oncol. 2010;28:3506–3515. doi: 10.1200/JCO.2009.27.3367. [DOI] [PubMed] [Google Scholar]
- 32.Schramm A, Köster J, Assenov Y, et al. Mutational dynamics between primary and relapse neuroblastomas. Nat Genet. 2015;47:872–877. doi: 10.1038/ng.3349. [DOI] [PubMed] [Google Scholar]
- 33.Ackermann S, Cartolano M, Hero B, et al. A mechanistic classification of clinical phenotypes in neuroblastoma. Science. 2018;362:1165–1170. doi: 10.1126/science.aat6768. [DOI] [PMC free article] [PubMed] [Google Scholar]


