Abstract
Background
Quantitative analysis of brain positron-emission tomography (PET) depends on structural segmentation, which can be time-consuming and operator-dependent when performed manually. Previous automatic segmentation usually registered subjects’ images onto an atlas template (defined as RSIAT here) for group analysis, which changed the individuals’ images and probably affected regional PET segmentation. In contrast, we could register atlas template to subjects’ images (RATSI), which created an individual atlas template and may be more accurate for PET segmentation. We segmented two representative brain areas in twenty Parkinson disease (PD) and eight multiple system atrophy (MSA) patients performed in hybrid positron-emission tomography/magnetic resonance imaging (PET/MR). The segmentation accuracy was evaluated using the Dice coefficient (DC) and Hausdorff distance (HD), and the standardized uptake value (SUV) measurements of these two automatic segmentation methods were compared, using manual segmentation as a reference.
Results
The DC of RATSI increased, and the HD decreased significantly (P < 0.05) compared with the RSIAT in PD, while the results of one-way analysis of variance (ANOVA) found no significant differences in the SUVmean and SUVmax among the two automatic and the manual segmentation methods. Further, RATSI was used to compare regional differences in cerebral metabolism pattern between PD and MSA patients. The SUVmean in the segmented cerebellar gray matter for the MSA group was significantly lower compared with the PD group (P < 0.05), which is consistent with previous reports.
Conclusion
The RATSI was more accurate for the caudate nucleus and putamen automatic segmentation and can be used for regional PET analysis in hybrid PET/MR.
Keywords: PET/MR, Segmentation, Atlas-based, Parkinson disease, Multiple system atrophy
Background
Positron-emission tomography (PET) is a molecular imaging method that uses the annihilation reactions of different positron emitters in radiotracers to generate images from the 511 keV gamma rays emitted. The positron emitters used, such as 18F and 11C, are bound to physiologically active substances to detect disease. Because physiologic images are relatively low in spatial resolution, computed tomography (CT) has been combined with PET for both anatomical location and attenuation correction. PET/CT scanning is widely applied in the evaluating of tumors, cardiac disease, CNS disorders, and infection/inflammation [1, 2].
Compared with CT, magnetic resonance imaging (MRI) has better soft tissue contrast and can obtain multiparametric images, e.g., T1-weighted images (T1WI), T2-weighted images (T2WI), proton density-weighted images (PDWI), or diffusion-weighted imaging (DWI), without ionizing radiation exposure. Therefore, the combination of PET and MRI should provide much more functional and structural information than CT without CT’s contribution to the overall radiation dose [3–5]. Combining PET with MRI was initially considered in the 1990s [6, 7]. Until 2010, with the advent of a magnet-compatible avalanche photodiode detector (APD), the first commercial whole-body hybrid PET/MR system (Siemens Biograph MRI scanner, Siemens Healthcare, Erlangen, Germany) [8] was introduced. In 2014, the latest generation of clinical whole-body hybrid PET/MR scanner (SIGNA PET/MR, GE Healthcare, Waukesha WI, USA) emerged with silicon photomultipliers (SiPMs), which digitize and process the signal directly within the magnetic field, which resulted in a thousand-fold improvement in time resolution, permitting time-of-flight (TOF) imaging [9].
PET/MR can simultaneously obtain images from the two modalities and is very useful for applications in neuroimaging. Catana et al. summarized the potential clinical application of PET/MR in patients with neurological disorders [10]. Previous studies have shown that the metabolic patterns of Parkinson’s disease (PD) and atypical Parkinson’s syndrome, e.g., multiple system atrophy (MSA), progressive supranuclear palsy (PSP), and corticobasal degeneration (CBD), were different [11]. However, it is usually difficult to quantitatively analyze abnormalities in different brain regions accurately [12]. Because of PET’s relatively low spatial resolution and the complexities of brain anatomy, the analysis of regional PET quantification relies on MRI. Brain structural segmentation based on MRI is very useful to localize regional CNS metabolism for clinical diagnosis.
Segmentation is one of the fundamental challenges in biomedical image analysis in that brain morphological characteristics are very complicated. This has been widely investigated to help diagnosis or surgery, e.g., deep brain stimulation (DBS) [13, 14]. Brain structural segmentation can be performed manually or automatically. Manual segmentation is highly time-consuming, requires expert anatomical knowledge [15, 16], and is subject to operator-dependence, especially when the signal-to-noise ratio or resolution is suboptimal. However, manual segmentation is still often employed, and the results are always used to establish a valid ground truth against which to assess automated segmentation results [17]. Automatic segmentation methods depending on algorithms can be very convenient, and the results are usually objective and reproducible [17]. Automatic segmentation methods must show accurate imaging co-registration, including the co-registration of images from different modalities, and accurate co-registration with a common reference template, such as the Montreal Neurological Institute (MNI) brain template [18].
For PET quantitative analysis, previous studies usually extracted the regional cerebral standardized uptake values (SUVs) directly based on an atlas, e.g., the widely used 3D stereotactic surface projection (3D SSP), or acquired the PET/CT and MRI data sequentially, registered the PET and MRI by postprocessing [19–21], and performed quantitative SUV analysis. In hybrid PET/MR, the two modalities are acquired simultaneously, which avoids image misregistration. The main difficulty is registering the subjects’ images with a referenced brain atlas. Many studies have focused on developing or optimizing algorithm performance for cortical structures in support of the functional MRI literature [22, 23]. However, the evaluation of effects of different automatic segmentation methods on PET SUV quantification is lacking. To label brain regions for group analysis, automatic segmentation RSIAT always fits the subjects’ images to a common reference space [24, 25], and PET quantification is performed in the transformed space, which fits the individual image data to adapt to the common reference frame and probably influences the accuracy of regional SUVs [26].
Materials and methods
In this study, we inversely registered the atlas in the template space to the original PET/MR data space and calculated the SUV—defined as registering atlas template to subjects’ images (RATSI) method—then compared the quantification with that of the traditional RSIAT method of fitting the clinical image data to the template space. Using the two automatic methods, we segmented two representative brain areas containing four regions: the left caudate (CAU_L), right caudate (CAU_R), left putamen (PUT_L), and right putamen (PUT_R) in twenty PD patients, then compared the SUVmean and SUVmax in the corresponding brain regions. The manual segmentation method was also performed and used as the ground truth. For quantitatively evaluating the two atlas-based automatic methods, the segmented results from the three methods (including the manual method) were normalized into the same MNI space in the end; then, the Dice coefficient (DC) and Hausdorff distance (HD) were calculated to evaluate inter-rater variability. The RATSI method was applied to quantify the differences in 18F-FDG uptake between PD and MSA groups in multiple brain regions, including caudate, putamen, and the cerebellar gray matter.
Subjects and data
We retrospectively studied patients who had undergone 18F-FDG PET/MR brain examinations for diagnosing or evaluating neurodegenerative diseases in our PET center (Wuhan Union Hospital, Wuhan, China). The study was approved by the Ethics Committee of Tongji Medical College, Huazhong University of Science and Technology. Patients provided written informed consent.
Twenty typical PD (60 ± 5 years) and eight MSA patients (60 ± 8 years) were involved in this study. The diagnosis was according to the diagnostic criteria for PD in China in 2016 and the MSA diagnostic criteria of a Chinese expert consensus in 2017. The exclusion criteria were as follows: (1) a clear history of stroke, with brain MRI examination revealing large cortical infarction or hemorrhagic manifestations; (2) CNS infectious disease; (3) brain tumors or history of head trauma; (4) history of craniocerebral surgery; and (5) suboptimal image quality.
Image acquisition and reconstruction
All patients underwent 18FDG-PET and MRI brain imaging simultaneously in a hybrid PET/MR scanner (3.0 T, SIGNA TOF-PET/MR, GE Healthcare). The 18F-FDG was produced in our center by a Minitrace cyclotron (GE Healthcare, USA) and automatic synthesizer (PAT Biotechnology Company, Beijing, China). The radiochemical purity was > 95%.
All participants fasted for at least 6 h and stopped any drugs that could affect brain glucose metabolism for at least 12 h before the 18F-FDG injection. The intravenously injected dose was 0.1 mCi/kg (3.7 MBq/kg) after ensuring the blood glucose level was ≤ 200 mg/dL. The scan began 40 min post 18F-FDG injection, during which the subject rested in a quiet and dimly lit room. The total scanning time for PET was 15 min, and the 3D T1WI (three-dimensional gradient echo sequence, flip angle = 12°, time of echo [TE]/time of repetition [TR] = 2.6/6.9 ms, bandwidth = 50 KHz, FOV = 24 cm × 24 cm, matrix = 384 × 384) sequence was simultaneously acquired.
The PET data were reconstructed using the ordered subsets expectation maximum (OSEM) algorithm with TOF technique. The parameters were as follows: FOV = 30 cm × 30 cm, matrix = 192 × 192, filter cutoff = 3.0 mm, subsets = 28, iterations = 3. The PET attenuation correction was atlas-based MRI attenuation correction, combined with Dixon water-fat separation methods [27].
Brain segmentation and SUV quantification
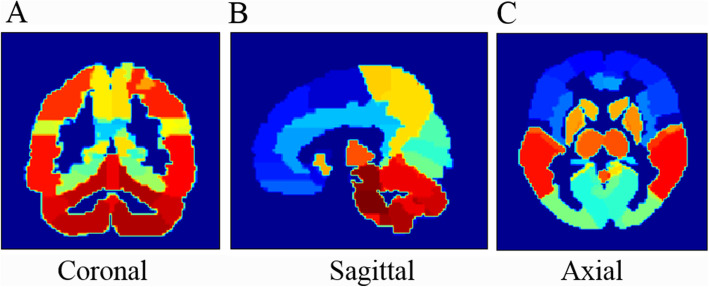
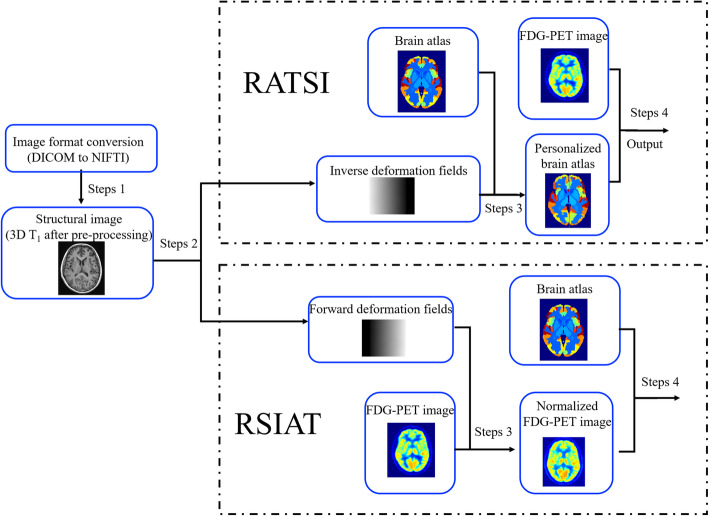
Automatic brain segmentation was based on an atlas template from the automated anatomical labeling atlas (http://www.gin.cnrs.fr/en/tools/aal-aal2/) shown in Fig. 1. There are 70 segmented regions labeled from 1 to 70 in this brain atlas, which were used for both the two atlas-based automatic methods. By registration of 3D T1-weighted MRI to MNI space with SPM12 segmentation (http://www.fil.ion.ucl.ac.uk/spm/download/), the forward and inverse deformation fields could be produced. The RSIAT spatially fitted the 18F-FDG PET images to the atlas template with the forward deformation field directly and produced the PET images in the MNI space, which could be segmented directly with the brain atlas. In contrast, the RATSI fitted the acquired inverse deformation field to the brain atlas template, generating a personalized brain atlas for every subject, which then was used for regional 18F-FDG PET image quantification, as shown in Fig. 2.
Fig. 1.
The brain atlas template, which segments the brain into 70 regions, labeled with numbers from 1 to 70 and showed with different colors. It was used for the following automatic segmentations
Fig. 2.
The diagram displaying the processing steps of the two atlas-based automatic methods for whole brain automatic segmentation and regional 18F-FDG PET quantification
For the two automatic brain segmentations, the detailed steps were as follows:
The medicine (DICOM) format of 3D T1 MRI and 18F-FDG PET images was converted to the neuroimaging informatics technology initiative (NIfTI) format using SPM12 for following processing.
The 3D T1 images were normalized to MNI space. The results would produce the inverse deformation field (for RATSI) and forward deformation field (for RSIAT), which extracted the information of transformation between the data acquisition space and MNI space.
For RATSI, by utilizing the inverse deformation filed, the anatomical labeling atlas in the MNI space was transformed into the data acquisition space and produced the personalized atlas template, which was in the same space with FDG images. For RSIAT, by utilizing the forward deformation field, the FDG-PET images could be normalized to the MNI space.
For RATSI, the regional FDG images were segmented according to the personalized atlas template, and further, the mean or max SUV values in different regional brain could be calculated. For RSIAT, the normalized FDG images were registered with the atlas template, then were segmented directly according to the regions-labeled brain atlas. At last, the regional SUV values could be calculated.
Manual segmentation was performed by a clinical neuroimaging expert using ITK-SNAP (http://www.itksnap.org) section by section, using the 3D T1 structural images. As the manual method was time-consuming, only two cerebral nuclei containing four regions (left caudate, right caudate, left putamen, and right putamen) were extracted and used for evaluation of the automatic segmented results. The extracted regions based on structural images produced the corresponding binary mask, which used for 18F-FDG PET images segmentation.
The regional SUV calculations were performed with Matlab 2016a (Mathworks, Natick, MA, USA). The SUVs were calculated by [28]
| 1 |
where r is the radioactivity concentration [kBq/mL], a′ is the decay-corrected amount of injected radiolabeled 18F-FDG [kBq], and w is the weight of the patient [g].
Inter-rater reliability
The four brain regions were segmented with the manual method on twenty PD subjects for inter-rater variability evaluation by using the parameters DC and HD. The DC evaluates the similarity between two volumes by measuring their overlap [29].
| 2 |
where A and B represent the segmentation volumes of the automatic methods and manual method, respectively. A∩B represents the intersection of the two volumes. A DC value of 1 represents two identical segmentations while a DC value of 0 represents no overlap between the two segmentations. HD usually measures how far two subsets of a metric space are from each other, and here, determines on average how much the two segmented volumes differ. A smaller HD represents a closer agreement between two volumes.
Statistical analysis
The differences in parameters DC and HD were analyzed by a paired t-test. The four segmented brain regions used as binary masks were overlapped on the PET images to extract the regional SUVmean and SUVmax. One-way analysis of variance (ANOVA) was used to compare the differences in quantitative SUVs among the three segmentation methods. The F-test was used to test whether the variance was homogeneous, and the two-tailed t-test was used to compare the differences in SUVs in the different regions in the basal ganglia and cerebellar gray matter between the PD group and MSA group. P > 0.05 was considered variance homogeneous for F-test. P < 0.05 was considered statistically significant for t-test.
Results
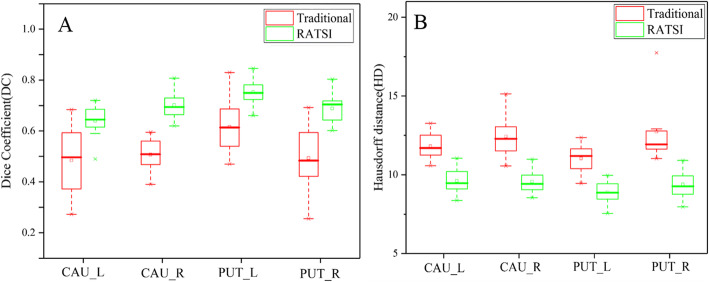
The DC and HD for the RSIAT method (green boxplots) and RATSI method (red boxplots) are displayed in Fig. 3. The mean DCs of RATSI were much larger than those of the RSIAT method, while the mean HD of RATSI was much smaller. The quantitative values are listed in Table 1. The corresponding two-tailed t-test results are also shown. Significant differences in DC and HD were found between the two methods (P < 0.05). The maximum DC was nearly 0.8 for right caudate nucleus segmentation in the RATSI method.
Fig. 3.
The boxplots displaying distributions of the Dice coefficient (a) and Hausdorff distance (b), which were used to evaluate the brain segmentation accuracy in compared with the ground truth, the manual segmentation results. The red and green boxplots represented the results of RSIAT method and RATSI, respectively. Representative nuclei including caudate nucleus (left: CAU_L, right: CAU_R) and putamen (left: PUT_L, right: PUT_R) were segmented for analysis
Table 1.
The Dice coefficient (DC) and Hausdorff distance (HD) (mean ± SD) for evaluating the accuracy of automatic brain segmentation quantitatively
| 1CAU_L | 2CAU_R | 3PUT_L | 4PUT_R | |||
|---|---|---|---|---|---|---|
| DC | Methods | Traditional | 0.48 ± 0.13 | 0.51 ± 0.06 | 0.62 ± 0.09 | 0.49 ± 0.12 |
| RATSI | 0.64 ± 0.06 | 0.70 ± 0.05 | 0.75 ± 0.05 | 0.69 ± 0.05 | ||
| P< 0.001 | ||||||
| DH (pixels) | Methods | Traditional | 11.80 ± 0.74 | 12.42 ± 1.19 | 11.03 ± 0.88 | 12.73 ± 1.87 |
| RATSI | 9.61 ± 0.75 | 9.56 ± 0.69 | 8.89 ± 0.68 | 9.39 ± 0.75 | ||
| P< 0.001 | ||||||
1CAU_L: left caudate nucleus
2CAU_R: right caudate nucleus
3PUT_L: left putamen
4PUT_R: right putamen
Figure 4 shows the representative segmented caudate and putamen ROIs on the left and right side with the three segmentation methods, which were overlain on T1WI and displayed with different colors for better visualization, including coronal, sagittal, and axial views. Visually, the segmented volumes from the RSIAT method were larger than the manual and RATSI segmentation volumes, especially for the right caudate nucleus as indicated by the white arrows.
Fig. 4.
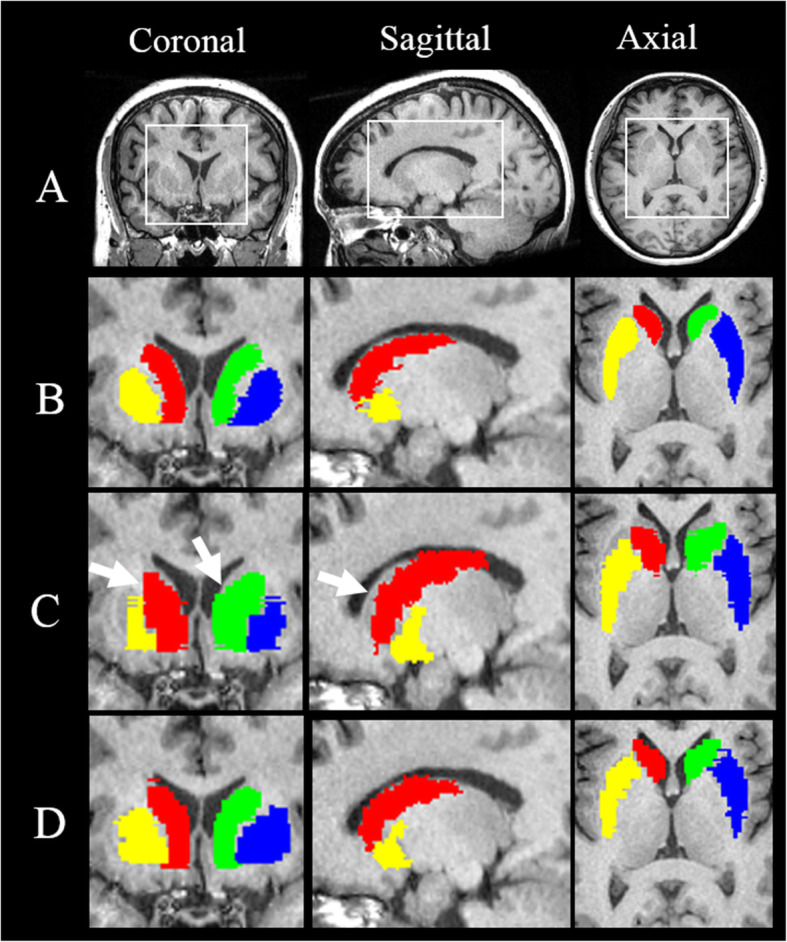
Representative visualization of segmented brain nuclei including caudate nucleus (green: CAU_L, red: CAU_R) and putamen (blue: PUT_L, yellow: PUT_R) by using manual segmentation (b), RSIAT method (c), and RATSI (d). The areas in the white box in T1 images (a) were the regions shown below. And the segmented regions of interest (ROIs) for nuclei were overlapped on T1 images in coronal (left), sagittal (middle), and axial views (right), respectively, for better visualization
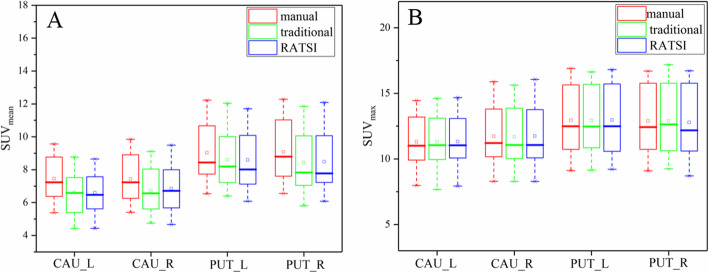
The distributions of SUVmean and SUVmax extracted with the three segmentation methods in the caudates and putamina from all twenty PD patients are box-plotted in Fig. 5. For SUVmax, the quantification was nearly the same, while the SUVmean of both the automatic segmentation methods was slightly lower than those of the manual segmentation. The corresponding quantitative SUV and ANOVA results are listed in Table 2. No significant differences were found in SUVmean or SUVmax among the three segmentation methods (P > 0.05).
Fig. 5.
The boxplots displaying the distribution of the SUVmean (a) and SUVmax (b) in caudate nucleus (left: CAU_L, right: CAU_R) and putamen (left: PUT_L, right: PUT_R) from twenty PD patients with manual segmentation (red), the RSIAT method (green), and RATSI (blue)
Table 2.
The lists of mean and max 18F-FDG-SUVs in segmented regions extracted with manual segmentation, RSIAT, and RATSI
| CAU_L | CAU_R | PUT_L | PUT_R | |||
|---|---|---|---|---|---|---|
| SUV_mean | 1Manual segmentation | 7.45 ± 1.39 | 7.42 ± 1.42 | 9.03 ± 1.69 | 9.08 ± 1.76 | |
| 2Traditional | 6.61 ± 1.38 | 6.72 ± 1.37 | 8.60 ± 1.63 | 8.44 ± 1.71 | ||
| 3RATSI | 6.60 ± 1.37 | 6.84 ± 1.36 | 8.59 ± 1.72 | 8.48 ± 1.67 | ||
| P (among groups) | 0.090 | 0.233 | 0.642 | 0.419 | ||
| P | 1 vs 2 | 0.059 | 0.111 | 0.419 | 0.239 | |
| 1 vs 3 | 0.055 | 0.187 | 0.415 | 0.272 | ||
| 2 vs 3 | 0.974 | 0.778 | 0.995 | 0.937 | ||
| SUV_max | Manual segmentation | 11.29 ± 2.04 | 11.73 ± 2.32 | 12.95 ± 2.47 | 12.90 ± 2.59 | |
| Traditional | 11.29 ± 2.12 | 11.68 ± 2.38 | 12.92 ± 2.44 | 12.90 ± 2.63 | ||
| RATSI | 11.32 ± 1.93 | 11.74 ± 2.32 | 12.97 ± 2.47 | 12.78 ± 2.66 | ||
| P | > 0.90 | |||||
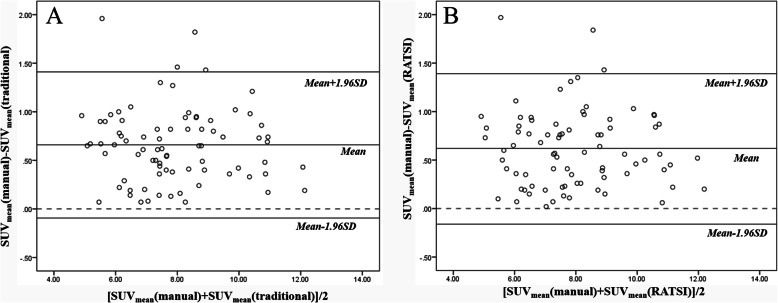
The consistencies of SUVmean obtained from manual and automatic methods were evaluated with Bland-Altman plots. As shown in Fig. 6, the transverse and longitudinal axis represents, respectively, the mean and differential values calculated by the two automatic methods. Most (94%) of the dots were within the two 95% consistency limit lines, which indicated that it is feasible to measure the SUVmean with the automatic segmentation method based on the atlas template.
Fig. 6.
Bland–Altman graphs to evaluate the SUVmean consistency of the RSIAT method (a) and RATSI (b) in comparison with the manual segmentation in the four representative regions including the left, right caudate nucleus, and putamen. The SD represents the standard deviation
The SUVmean extracted with RATSI in brain nuclei between the PD group and MSA group is summarized in Table 3. All the SUVmean were decreased in the MSA group compared with those in the PD group. The difference in SUVmean in the cerebellar gray matter was statistically significant between the two groups (P < 0.05).
Table 3.
The SUVmean quantification in brain nuclei for PD and MSA patients
| CAU_L | CAU_R | PUT_L | PUT_R | 1CGM_L | 2CGM_R | ||
|---|---|---|---|---|---|---|---|
| SUV_mean | PD | 6.60 ± 1.37 | 6.84 ± 1.36 | 8.59 ± 1.72 | 8.48 ± 1.67 | 5.49 ± 0.70 | 5.32 ± 0.79 |
| MSA | 5.46 ± 1.78 | 5.87 ± 1.77 | 7.27 ± 1.81 | 7.32 ± 1.83 | 3.93 ± 1.05 | 3.59 ± 1.06 | |
| F | 0.50 | 0.39 | 0.80 | 0.83 | 0.19 | 0.34 | |
| 3P | 0.07 | 0.21 | 0.15 | 0.15 | 0.00 | 0.00 | |
1CGM_L: left cerebral gray matter
2CGM_R: right cerebral gray matter
3P < 0.05 was considered statistically significantly different for comparisons
Discussion
The quantitative analysis of regional cerebral metabolism is very meaningful for diagnosis of nervous system diseases and exploring brain function. In this study, by using hybrid PET/MR, the registration of PET functional images and MRI structural images was avoided. Furthermore, the personalized templates, which were finally used for 18F-FDG PET regional segmentation and quantification, were built based on an inverse deformation field obtained by registering the atlas template to 3D T1WI in SPM12. Compared with the RSIAT method, the RATSI could acquire larger DCs, more consistent with those of the manual method. For the RSIAT, it was the registration process to normalize the PET/MR images to fit the atlas template, which probably change the personalized images, especially for some subjects whose brain structure have changed. In contrast, the RATSI normalized the atlas template to fit the PET/MR images, for producing the personalized atlas, which could avoid the problem from the RSIAT. Therefore, the RATSI registration method is probably advantageous for PET quantitative analysis, especially for point-to-point image analysis. In addition to 18F-FDG PET, this method could also be used for cerebral PET analysis with other tracers.
The ability to distinguish between PD and Parkinson syndrome is very difficult, especially in the early stage. Previous reports suggested the diagnostic accuracy rate of early PD was only 53% [30]. In our study, the RATSI method was used for calculation and comparisons of regional brain SUVs between the PD and MSA groups. The results suggested the method can effectively quantify the regional SUVs and find the differences of 18F-FDG PET metabolic pattern between the PD and MSA groups. The SUVmean was significantly lower in the cerebellar gray matter in the MSA group compared with the PD group. The results are consistent with previous clinical studies and meta-analyses that use the metabolic brain network based on 18F-FDG-PET for the differential diagnosis of Parkinson syndrome [31, 32].
The quantitative evaluation of segmentation accuracy with DC and HD suggested the RATSI can generate better segmented results than the RSIAT method. However, the SUVmax was not significantly different, due to that the SUVmax usually was less related with the edge of segmented regions. Also, there were no significant differences in the SUVmean among the three segmentation methods in the caudate and putamen. We speculate that because the caudate and putamen are relatively large and contain so many voxels; the marginal differences caused by the two automatic segmentation methods had little influence on the SUVmean. Therefore, the RATSI method probably would be more advantageous for smaller areas.
There are still some limits in the study. Firstly, the personalized atlas template was very important for segmentation in the RATSI method, which depended on the deformation field. In this study, for generating the deformation field consistently, the default parameters were used on the SPM12. The parameters for every registration should be optimized to acquire more precise and personalized deformation field data. Secondly, besides the SPM12, lots of other software could be used for realizing the two segmented methods, i.e., FSL or FreeSurfer. The results of the comparison from other software were unknown. Ewert et al. practically optimized parameters and compared subcortical alignment for the following nonlinear image registration tools: Normalization Tools ANTs 2.2.0, SPM12 software, and FSL 5.0.10 for atlas-based segmentation of DBS target nuclei [17]. The corresponding process could be referenced in the future for more detailed research. Thirdly, partial volume effect is a common phenomenon in the medical imaging equipment, especially for PET images due to the relatively low spatial space. In this study, we did not perform the partial volume effect correction in consideration that the two segmentation methods were mainly based on 3D T1 MRI. However, the partial volume effect may reduce the accuracy of PET quantitative analysis and have some influence for comparing regional differences in cerebral metabolism pattern between PD and MSA patients. Therefore, partial volume effect should be noted in the future study.
In this study, we focused on manual and automatic segmentation and quantification evaluation of the caudate and putamen. The automatic method could be theoretically extended to other structures according to the atlas templates. However, some deep brain structures show poor contrast and are typically difficult to be visualized on T1WI, e.g., the red nucleus and substantia nigra, but are better visualized on T2WI. Fonov et al. [33] and Xiao et al. [34] demonstrated better segmentation results from non-rigidly warping the T1WI and T2WI to a common template space. In the future, multi-modality data, that is, T1WI, T2WI, and PDWI, might be used for automatic segmentation. This needs to be explored in the future.
Conclusions
We utilized two automatic segmentation methods for regional PET analysis. Comparing with the traditional RSIAT method, the RATSI was more accurate for the caudate nucleus and putamen automatic segmentation, while has little effects for their max and mean SUV calculation in hybrid PET/MR. And it could be theoretically extended to other structures according to the atlas templates. Further, the regional PET results from the RATSI method have been demonstrated useful for the differential diagnosis between the PD and MSA.
Acknowledgements
Not applicable
Abbreviations
- PET
Positron-emission tomography
- RATSI
Registering atlas template to subjects’ images
- RSIAT
Registering subjects’ images to atlas template
- PD
Parkinson disease
- MSA
Multiple system atrophy
- PET/MR
Positron-emission tomography/magnetic resonance imaging
- DC
Dice coefficient
- HD
Hausdorff distance
- SUV
Standardized uptake value
- ANOVA
One-way analysis of variance
- CT
Computed tomography
- MNI
Montreal Neurological Institute
Authors’ contributions
Dr. Xiaoli Lan: substantial contributions to conception and design, analysis and interpretation of data, and revising the manuscript critically for important intellectual content. Dr. Weiwei Ruan: contributions to conception and design, acquisition of data, analysis and interpretation of data, and drafting the article. Dr. Xun Sun, Ms. Xuehan Hu, Dr. Fang Liu, Ms. Fan Hu, and Dr. Yongxue Zhang: analysis and interpretation of data and drafting the article. Dr. Jinxia Guo: analysis of data. The authors read and approved the final manuscript.
Funding
This work was supported by the National Natural Science Foundation of China (No. 81901735 and 81701759) and Key Project of Hubei Province Technical Innovation (No. 2017ACA182).
Availability of data and materials
The datasets used and/or analyzed during the current study are available from the corresponding author on reasonable request.
Ethics approval and consent to participate
The authors declare that they have no conflict of interest. All procedures performed in studies were approved by the Ethics Committee of Tongji Medical College, Huazhong University of Science and Technology. Informed consent was obtained from all individual participants included in the study.
Consent for publication
Not applicable
Competing interests
The authors declare that they have no competing interests.
Footnotes
Publisher’s Note
Springer Nature remains neutral with regard to jurisdictional claims in published maps and institutional affiliations.
References
- 1.Cheng G, Fosse P, Zhuang H, Hustinx R. Applications of PET and PET/CT in the evaluation of infection and inflammation in the skeletal system. Pet Clinics. 2010;5(3):375–385. doi: 10.1016/j.cpet.2010.05.003. [DOI] [PubMed] [Google Scholar]
- 2.Lemans JVC, Hobbelink MGG, Ijpma FFA, Plate JDJ, van den Kieboom J, Bosch P, et al. The diagnostic accuracy of F-18-FDG PET/CT in diagnosing fracture-related infections. Eur J Nucl Med Mol Imaging. 2019;46(4):999–1008. doi: 10.1007/s00259-018-4218-6. [DOI] [PMC free article] [PubMed] [Google Scholar]
- 3.Drew A, Torigian M, Habib ZP, Thomas C, Kwee M, Babak SM, et al. PET/MR imaging: technical aspects and potential clinical applications. Radiology. 2013;267(1):26–44. doi: 10.1148/radiol.13121038. [DOI] [PubMed] [Google Scholar]
- 4.Bailey DL, Pichler BJ, Guckel B, Barthel H, Beer AJ, Bremerich J, et al. Combined PET/MR: multi-modality multi-parametric imaging is here. Mol Imaging Biol. 2015;17:595–608. doi: 10.1007/s11307-015-0886-9. [DOI] [PubMed] [Google Scholar]
- 5.Besson FL, Lebon V, Durand E. What are we expecting from PET/MRI? Med Médecine Nucléaire. 2016;40(1):31–40. doi: 10.1016/j.mednuc.2016.01.002. [DOI] [Google Scholar]
- 6.Christensen NL, Hammer BE, Heil BG, Fetterly K. Positron emission tomography within a magnetic field using photomultiplier tubes and lightguides. Phys Med Biol. 1995;40:691–697. doi: 10.1088/0031-9155/40/4/014. [DOI] [PubMed] [Google Scholar]
- 7.Shao Y, Cherry SR, Farahani K, Meadors K, Siegel S, Silverman RW, et al. Simultaneous PET and MR imaging. Phys Med Biol. 1997;42:1965–1970. doi: 10.1088/0031-9155/42/10/010. [DOI] [PubMed] [Google Scholar]
- 8.Delso G, Furst S, Jakoby B, Ladebeck R, Ganter C, Nekolla SG, et al. Performance measurements of the Siemens mMR integrated whole-body PET/MR scanner. J Nucl Med. 2011;52:1914–2022. doi: 10.2967/jnumed.111.092726. [DOI] [PubMed] [Google Scholar]
- 9.Schaart DR, Seifert S, Vinke R, van Dam HT, Dendooven P, Lohner H, et al. LaBr(3):Ce and SiPMs for time-of-flight PET: achieving 100 ps coincidence resolving time. Phys Med Biol. 2010;55:179–189. doi: 10.1088/0031-9155/55/7/N02. [DOI] [PubMed] [Google Scholar]
- 10.Catana C, Drzezga A, Heiss W-D, et al. PET/MR for neurologic applications. J Nucl Med. 2012;53:1916–1925. doi: 10.2967/jnumed.112.105346. [DOI] [PMC free article] [PubMed] [Google Scholar]
- 11.Meyer PT, Frings L, Rucker G, Hellwig S. 18-F-FDG PET in parkinsonism: differential diagnosis and evaluation of cognitive impairment. J Nucl Med. 2017;58(12):1888–1898. doi: 10.2967/jnumed.116.186403. [DOI] [PubMed] [Google Scholar]
- 12.Klyuzhin IS, Fu GJF, Hong A, Sacheli M, Shenkov N, et al. Data-driven, voxel-based analysis of brain PET images: application of PCA and LASSO methods to visualize and quantify patterns of neurodegeneration. PLoS One. 2018;13(11). 10.1371/journal.pone.0206607. [DOI] [PMC free article] [PubMed]
- 13.Gonzalez-Villa S, Oliver A, Valverde S, Wang LP, Zwiggelaar R, Llado X. A review on brain structures segmentation in magnetic resonance imaging. Artif Intell Med. 2016;73:45–69. doi: 10.1016/j.artmed.2016.09.001. [DOI] [PubMed] [Google Scholar]
- 14.Forstmann BU, Isaacs BR, Temel Y. Ultra high field MRI-guided deep brain stimulation. Trends Biotechnol. 2017;35(10):904–907. doi: 10.1016/j.tibtech.2017.06.010. [DOI] [PubMed] [Google Scholar]
- 15.Zwirner J, Mobius D, Bechmann I, Arendt T, Hoffmann KT, Jager C, et al. Subthalamic nucleus volumes are highly consistent but decrease age-dependentlya combined magnetic resonance imaging and stereology approach in humans. Hum Brain Mapp. 2017;38(2):909–922. doi: 10.1002/hbm.23427. [DOI] [PMC free article] [PubMed] [Google Scholar]
- 16.Chakravarty MM, Steadman P, van Eede MC, Calcott RD, Gu V, Shaw P, et al. Performing label-fusion-based segmentation using multiple automatically generated templates. Hum Brain Mapp. 2013;34(10):2635–2654. doi: 10.1002/hbm.22092. [DOI] [PMC free article] [PubMed] [Google Scholar]
- 17.Ewert S, Horn A, Finkel F, Li NF, Kuhn AA, Herrington TM. Optimization and comparative evaluation of nonlinear deformation algorithms for atlas-based segmentation of DBS target nuclei. Neuroimage. 2019;184:586–598. doi: 10.1016/j.neuroimage.2018.09.061. [DOI] [PMC free article] [PubMed] [Google Scholar]
- 18.Ewert S, Plettig P, Li N, Chakravarty MM, Collins DL, Herrington TM, et al. Toward defining deep brain stimulation targets in MNI space: a subcortical atlas based on multimodal MRI, histology and structural connectivity. Neuroimage. 2018;170:271–282. doi: 10.1016/j.neuroimage.2017.05.015. [DOI] [PubMed] [Google Scholar]
- 19.Nozadi SH, Kadoury S, Alzheimers Dis N. Classification of Alzheimer’s and MCI patients from semantically parcelled PET images: a comparison between AV45 and FDG-PET. Int J Biomed Imaging. 2018; 10.1155/2018/1247430. [DOI] [PMC free article] [PubMed]
- 20.Sun X, Liu F, Li Q, Gai Y, Ruan W, Wimalarathne DN, et al. Quantitative research of C-11-CFT and F-18-FDG PET in Parkinson’s disease: a pilot study with NeuroQ software. Front Neurosci. 2019. 10.3389/fnins.2019.00299. [DOI] [PMC free article] [PubMed]
- 21.Saint-Aubert L, Nemmi F, Peran P, Barbeau EJ, Payoux P, Chollet F, et al. Comparison between PET template-based method and MRI-based method for cortical quantification of florbetapir (AV-45) uptake in vivo. Eur J Nucl Med Mol Imaging. 2014;41:836–843. doi: 10.1007/s00259-013-2656-8. [DOI] [PMC free article] [PubMed] [Google Scholar]
- 22.Klein A, Andersson J, Ardekani BA, Ashburner J, Avants B, Chiang MC, et al. Evaluation of 14 nonlinear deformation algorithms applied to human brain MRI registration. Neuroimage. 2009;46(3):786–802. doi: 10.1016/j.neuroimage.2008.12.037. [DOI] [PMC free article] [PubMed] [Google Scholar]
- 23.Glasser MF, Coalson TS, Robinson EC, Hacker CD, Harwell J, Yacoub E, et al. A multi-modal parcellation of human cerebral cortex. Nature. 2016;536:171–178. doi: 10.1038/nature18933. [DOI] [PMC free article] [PubMed] [Google Scholar]
- 24.Karim HT, Andreescu C, MacCloud RL, Butters MA, Reynolds CF, Aizenstein HJ, et al. The effects of white matter disease on the accuracy of automated segmentation. Psychiatry Res Neuroimaging. 2016;253:7–14. doi: 10.1016/j.pscychresns.2016.05.003. [DOI] [PMC free article] [PubMed] [Google Scholar]
- 25.Kaneta T, Okamura N, Minoshima S, Furukawa K, Tashiro M, Furumoto S, et al. A modified method of 3D-SSP analysis for amyloid PET imaging using C-11 BF-227. Ann Nucl Med. 2011;25(10):732–739.25. doi: 10.1007/s12149-011-0518-7. [DOI] [PubMed] [Google Scholar]
- 26.Angulakshmi M, Lakshmi Priya GG. Automated brain tumour segmentation techniques-a review. Int J Imaging Syst Technol. 2017;27(1):66–77. doi: 10.1002/ima.22211. [DOI] [Google Scholar]
- 27.Leynes AP, Yang J, Shanbhag DD, Kaushik SS, Seo Y, Hope TA, et al. Hybrid ZTE/Dixon MR-based attenuation correction for quantitative uptake estimation of pelvic lesions in PET/MR. Med Phys. 2017;44(3):902–913. doi: 10.1002/mp.12122. [DOI] [PMC free article] [PubMed] [Google Scholar]
- 28.Kinahan PE, Fletcher JW. Positron emission tomography-computed tomography standardized uptake values in clinical practice and assessing response to therapy. Sem Ultrasound Ct Mri. 2010;31(6):496–505. doi: 10.1053/j.sult.2010.10.001. [DOI] [PMC free article] [PubMed] [Google Scholar]
- 29.Wang BT, Poirier S, Guo T, Parrent AG, Peters TM, Khan AR. Generation and evaluation of an ultra-high-field atlas with applications in DBS planning. Medical Imaging 2016: Image Processing, 97840H; doi:10.1117/12.2217126.
- 30.Adler CH, Beach TG, Hentz JG, Shill HA, Caviness JN, Driver-Dunckley E, et al. Low clinical diagnostic accuracy of early vs advanced Parkinson disease Clinicopathologic study. Neurology. 2014;83(5):406–412. doi: 10.1212/WNL.0000000000000641. [DOI] [PMC free article] [PubMed] [Google Scholar]
- 31.Wu P, Wang J, Peng SC, Ma YL, Zhang HW, Guan YH, et al. Metabolic brain network in the Chinese patients with Parkinson’s disease based on F-18-FDG PET imaging. Parkinsonism Relat Disord. 2013;19(6):622–627. doi: 10.1016/j.parkreldis.2013.02.013. [DOI] [PubMed] [Google Scholar]
- 32.Gu SC, Ye Q, Yuan CX. Metabolic pattern analysis of 18F-FDG PET as a marker for Parkinson’s disease: a systematic review and meta-analysis. Rev Neurosci. 2019. 10.1515/revneuro-2018-0061. [DOI] [PubMed]
- 33.Fonov V, Evans AC, Botteron K, Almli CR, McKinstry RC, Collins DL, et al. Unbiased average age-appropriate atlases for pediatric studies. Neuroimage. 2011;54(1):313–327. doi: 10.1016/j.neuroimage.2010.07.033. [DOI] [PMC free article] [PubMed] [Google Scholar]
- 34.Xiao YM, Fonov V, Beriault S, Al Subaie F, Chakravarty MM, Sadikot AF, et al. Multi-contrast unbiased MRI atlas of a Parkinson’s disease population. Int J Comput Assist Radiol Surg. 2015;10(3):329–341. doi: 10.1007/s11548-014-1068-y. [DOI] [PubMed] [Google Scholar]
Associated Data
This section collects any data citations, data availability statements, or supplementary materials included in this article.
Data Availability Statement
The datasets used and/or analyzed during the current study are available from the corresponding author on reasonable request.


