

Abstract
Social distancing is an effective means of containing the spread of COVID‐19, but only if we all participate. Who are the individuals who are least likely to adhere to social distancing recommendations, presently and in the long term? Such knowledge is important for policy makers looking to sustain the public's buy‐in to social distancing. Using survey data from a sample of U.S. residents (n = 1,449), the authors show that some demographic factors (gender, age, race, political party) help predict intent to adhere to social distancing. Yet demographic factors are relatively poor predictors compared with individual attitudes and media diets. Public officials should make efforts to inform and persuade the public of the importance of social distancing, targeting media such as television and radio, where audiences are less likely to currently engage in social distancing or are less likely to envision themselves sustaining strict social distancing for several weeks or months.
The coronavirus (COVID‐19) pandemic presents a major challenge to all societies. To curb the spread of the virus, governments have enacted policies aimed at regulating peoples’ behavior and social habits. In particular, citizens across the globe are intensely encouraged to engage in “social distancing” (also referred to as “physical distancing”) (Briscese et al. 2020; Merelli 2020; Paun et al. 2020). Health authorities and experts insist that maintaining a physical distance from others and avoiding crowds are crucial for mitigating both the extent and the speed of COVID‐19 spread (Ahmed, Zviedrite, and Uzicanin 2018; Chen et al. 2020; ECDC 2020; Fong et al. 2020; Rashid et al. 2014; WHO 2020; Zhang et al. 2020). Complementing other containment measures, such as hand hygiene and widespread testing, social distancing is key to reducing excessive demands on intensive health care services—and thus for ensuring the effective treatment of all who become infected.
Given the clear externalities that are created when individuals ignore social distancing guidelines, there is a compelling case for government regulation of such behavior during the COVID‐19 pandemic. Both the costs and the benefits of social distancing are widely distributed throughout the public (rather than concentrated), which indicates a case of “majoritarian politics” under James Q. Wilson's typology of the politics of regulation (see Wilson 1995). Yet because widespread, aggressive enforcement of social distancing rules may be impractical or perceived as unduly invasive, governments largely rely on residents to voluntarily comply with social distancing rules and guidelines.
Americans in general appear to be widely engaged in social distancing (Cortez 2020; Fetzer et al. 2020; Resnick 2020). However, notable variation is observed, suggesting that some individuals are far less compliant than others—a fact highlighted by protests of stay‐at‐home orders in many U.S. state capitals (Bosman, Tavernise, and Baker 2020). A Stanford‐led study (Moore et al. 2020) found that roughly 4 in 10 Americans were not complying with social distancing recommendations in mid‐March 2020. Although the most common reason for not following orders was work requirements for nonessential industries (28.2 percent), other explanations include worries about mental and physical well‐being (20.3 percent), the belief that other precautions, such as hand‐washing, are sufficient (18.8 percent), a wish to continue everyday activities (13.9 percent), and the belief that society is overreacting (12.7 percent). Similarly, a Gallup Poll from April 6, 2020 (McCarthy 2020), showed that a non‐negligible minority of Americans were still going to public places (11 percent) and were neither avoiding small gatherings (16 percent) nor travel by plane, bus, subway, or train (22 percent). Such findings raise important questions: Who are these noncompliers? What characterizes the people who are least inclined to adhere to social distancing recommendations, presently and in the long term?
Using survey data from a sample of 1,449 U.S. residents collected on April 3, 2020, this research note offers insights into the individual‐level predictors of citizens’ willingness to social distance. We examine potential predictors of one's willingness to social distance, including not only standard demographic characteristics and political identities but also measures of prosocial motivation, empathy, and news consumption. The role of news consumption in particular may be important given political communication research emphasizing news consumption as a key means through which voters learn information, with different types of news sources potentially promoting different reactions and degrees of learning (Kruikemeier, Lecheler, and Boyer 2018; Peterson 2019; Sobieraj and Berry 2011; Strömbäck, Falasca, and Kruikemeier 2018). In terms of outcomes, our analysis focuses on two distinct social distancing measures: (1) an index of social distancing behavior and (2) the duration (number of weeks) that people say they can see themselves staying at home and avoiding social contact.
The former measure (social distancing behavior) captures a set of key responses representing behavioral compliance with social distancing recommendations. Other COVID‐19‐related work uses similar item measures to evaluate, for example, different means of promoting social distancing (Lunn et al. 2020; Pfattheicher et al. 2020; Utych and Fowler 2020). Yet research is needed that directly and more robustly substantiates knowledge about the types of people who are not adhering to social distancing.
Our second outcome measure (social distancing anticipated duration) taps into an equally important but understudied issue directly relevant to efforts at mitigating the spread of COVID‐19 in the long term. To what extent are people mentally prepared to follow stay‐at‐home orders potentially lasting many weeks or months? Who are the individuals least inclined to sustain social distancing for longer periods, even if they might have been okay with initially staying at home and avoiding social contact?
Identifying the subpopulations of individuals who are the most likely social distancing noncompliers, presently and in the long term, is important for public officials who are tasked with safeguarding the public welfare. While public health experts, medical doctors, and virologists must provide policy makers with the information they need to make well‐informed decisions, social scientists should provide insights regarding how to best account for the human behavioral aspects of pandemic response that are so crucial for effectively curbing the COVID‐19 spread. Whether at the municipal, state, or federal level, governments face a regulatory task that requires the use of not just formal sanctions (e.g., fines) for noncompliance but also persuasion and positive inducements (e.g., enhanced unemployment benefits that encourage staying at home). Regulation—“the public administrative policing of a private activity with respect to a rule prescribed in the public interest” (Mitnick 1980, 7)—is one of the core functions of government (Christensen 2011). Thus, enforcing and regulating social distancing during COVID‐19 is a public task and responsibility that rests, first and foremost, with government and the public administration.
Public interventions specifically targeting both present and future noncompliers will be helpful—if not essential—for achieving control over the spread of COVID‐19 (i.e., maintaining a so‐called R0 (R‐naught) of 1 or less; see Eisenberg 2020). While forecasting is difficult, policies enforcing or incentivizing people anew to continued social distancing may assume prominent importance presently or in the near future. For example, a study published in Science suggests that prolonged or intermittent social distancing may be necessary into 2022 (Kissler et al. 2020), and much research supports the concept of “behavioral fatigue” for pandemic prevention measures. Several U.S. states have seen public protests against government stay‐at‐home orders (Bosman, Tavernise, and Baker 2020).
As noted by Bell (2020), risk perceptions during epidemics tend to track poorly with the actual risk. Sudden increases in infection risk make people initially overestimate the actual risk. However, even if the infection risk objectively increases further, people begin to adapt to the “new normal” as perceptions of risk decrease (Lowenstein and Mather 1990; Raude et al. 2019). In line with this notion, studies find attenuation over time in social distancing during public health epidemics (Ferrante et al. 2011; Springborn et al. 2015; Wong and Sam 2010).
Who Indicates the Most Willingness to Social Distance?
To measure American's intentions and attitudes regarding social distancing, we fielded a short online survey on April 3, 2020. 1 By this date, 42 states had issued stay‐at‐home orders, including high‐profile states (e.g., Florida, Georgia) where governors had resisted calls for such orders until that week (Fernandez 2020). We recruited 1,502 paid survey respondents (1,449 after dropping observations with unusable data) using Prolific, a professional crowdworking platform designed for academic and marketing researchers. Prolific offers a profiled participant pool comprising more than 15,800 U.S. nationals. Research suggests that “[Prolific] provides data quality that is comparable or not significantly different from MTurk's, and [Prolific's] participants seem to be more naïve to common experimental research tasks, and offer a more diverse population in terms of geographical location, ethnicity, etc.” (Peer et al. 2017, 161; see also Palan and Schitter 2018). Nevertheless, as with all nonprobability samples, we recognize that our respondents are not fully representative of the general U.S. population.
Indeed, certain demographic groups are overrepresented in our sample (i.e., young people, Democrats, Asians, well‐educated people). We have applied weights to our data to improve the generalizability of our findings in terms of demographics. Still, weighting may only enhance representativeness on observable characteristics, and even after our reweighting, our sample is somewhat younger, better educated, and more Democratic‐leaning on average than the broader U.S. public. Our primary interest is to specify the individual characteristics that can help predict social distancing intentions and attitudes during the COVID‐19 pandemic. We believe our sample is suitable for this purpose, though our results most directly describe these patterns among a set of people who signed up to participate in occasional online surveys. Inferences should be made with care and consideration of our sampling method. Relatedly, and though recent COVID‐19 research shows that self‐reported measures of social distancing track actual behavior both at the individual and at the U.S. state level (Gollwitzer et al. 2020), our results may be susceptible to common method bias (Favero and Bullock 2015). More details on our methodology—including similar results obtained from analyses without survey weights—are contained in the appendix, which also reports summary statistics (Table A1).
Average Willingness to Social Distance
Our respondents generally indicate an intention to engage in strict social distancing. On a scale ranging from 0 to 100, where 0 indicates “no intention to socially distance” and 100 indicates “maximum social distancing,” the average response is 87.8. This scale was constructed based on responses to five different statements about their behavior in the next few weeks. Table c shows the five statements. Variation is greatest for a statement about intentions to meet with friends or relatives. However, even for this statement, the average response (1.56 out of 10) indicates a general adherence to social distancing recommendations.
We also asked respondents to report the maximum duration (number of weeks) for which they could see themselves maintaining social distancing, if officials advised it (social distancing anticipated duration). Again, we see a relatively high willingness to socially distance. The average respondent can see herself avoiding social contact as much as possible for about 17 weeks (the median is 10 weeks). Still, we observe substantial variation: 30 percent of respondents indicate 6 weeks or fewer, while 17 percent indicate half a year (26 weeks) or longer.
The final five items in table 1 capture COVID‐19 news attentiveness as well as four measures of attitudes and beliefs about COVID‐19. Most respondents indicate they are following news about COVID‐19 quite closely (average 0.81 out of 1). We see strong agreement with the belief that COVID‐19 is “the single biggest threat to society” (average 0.71 out of 1). The next two items indicate that respondents generally believe that prioritizing saving lives over economic concerns is important. Finally, we see substantial support for regulatory policies requiring nonessential businesses to shut down for a time (average 0.85 out of 1).
Table 1.
Survey Questions Regarding COVID‐19
| Mean | SD | Range | |
|---|---|---|---|
| Social distancing behavior (index): | 87.78 | 14.86 | 0–100 |
| “I will meet with friends or relatives who live outside my own household.”* | 1.56 | 2.50 | 0–10 |
| “I will make the fewest possible trips to the grocery store.” | 8.90 | 1.76 | 0–10 |
| “I will be at places where other people will also be (café, restaurant, specialty shops, church, etc.).”* | 1.13 | 2.17 | 0–10 |
| “I will avoid all social gatherings (i.e., adhere to so‐called ‘social distancing’).” | 9.08 | 2.06 | 0–10 |
| “I will strongly encourage others to avoid all social contact (i.e., adhere to so‐called ‘social distancing’).” | 8.59 | 2.09 | 0–10 |
| Social distancing anticipated duration: “If officials advised it, I could see myself generally staying at home and avoiding social contact for up to ___ weeks.” | 16.92 | 19.94 | 0–104 |
| COVID‐19 news consumption: “How closely have you been following news about coronavirus (COVID‐19)?” | 0.81 | 0.21 | 0–1 |
| COVID‐19‐related attitudes and beliefs: | |||
| “The COVID‐19 pandemic is the single biggest threat to society in our time.” | 0.71 | 0.29 | 0–1 |
| “Reducing the number of deaths caused by COVID‐19 is more important than economic concerns.” | 0.82 | 0.22 | 0–1 |
| “We have to keep the economy going even if this means more people die from COVID‐19.” | 0.26 | 0.28 | 0–1 |
| “The government should require all nonessential businesses in my area to close their on‐site operations for at least the next 2 weeks.” | 0.85 | 0.23 | 0–1 |
Item was reversed to create the social distancing index.
In sum, we observe a public that is generally highly concerned about the dangers posed by COVID‐19 and generally highly willing to engage in social distancing, irrespective of the economic costs. Despite broad agreement on these matters, some respondents diverge in their attitudes and intended behaviors. We also detect considerable variation in how long individuals can see themselves remaining at home and avoiding social contact.
Predictors of Willingness to Social Distance
We now turn our attention to the individual‐level factors that may explain the variation we observe both in social distancing behavior and in the duration that people can see themselves maintaining social distancing. We ran a set of ordinary least squares (OLS) regressions, which can be found in the appendix. Figure 1 plots the main results.
Figure 1.
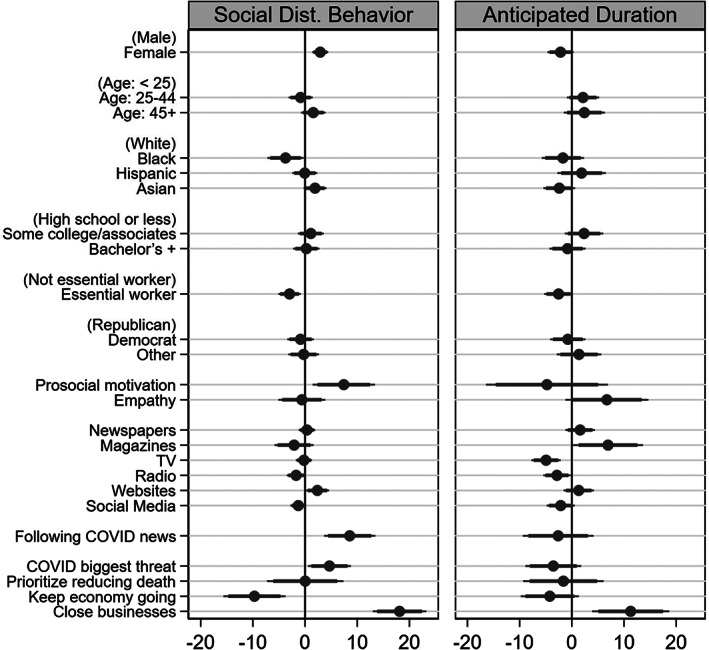
Notes: Plot of OLS regression estimates (see table A2, models 3 and 7 in the appendix). Dots indicate the relationship between an independent variable (such as gender or age) and the social distancing outcome identified at the top of the graph (i.e., coefficient point estimates). Dots to the right of the 0 line indicate a positive association with the outcome, while dots to the left of the 0 line indicate a negative association with the outcome. The horizontal bands around each dot indicate statistical uncertainty about the estimated relationship for that variable (i.e., 95% and 90% confidence intervals shown by thin and thick bands, respectively). Many of the independent variables have statistically indeterminate associations with the outcomes, which is why their bands overlap with the 0 lines. On the left side of the figure, values in parentheses shows the comparison groups for categorical variables. Predictors of Social Distancing Behaviors and Anticipated Duration of Isolation.
For social distancing behavior, women report higher levels of social distancing than men. This finding is in line with research suggesting that women are socialized toward a gender role that is more passive, rule abiding, and compassionate (Coffe and Bolzendahl 2010; Granié 2007) and that women tend to exhibit higher levels of organizational rule abidance than men (Portillo and DeHart‐Davis 2009). Conversely, we find some indication that men can see themselves remaining in isolation for more weeks than women. A possible explanation is that men tend to care less about interpersonal relationships than women (Yang and Girgus 2019) or that men tend to have smaller and less varied social networks with fewer friends and less contact frequency (Psylla et al. 2017; Shye et al. 1995).
We see no substantial associations for age in figure 1. However, in line with research observing a positive relation between age in adulthood and law‐abiding orientation (Fine et al. 2020), older respondents (age 45 and older) do indicate more social distancing in regression models with no or fewer independent, attitudinal variables (see table A2, models 1 and 2 in the appendix). This may indicate a mediation effect; older Americans socially distance to greater extents than younger Americans, but this difference may be mostly accounted for by age‐based differences in terms of COVID‐19 news attentiveness and COVID‐19‐related attitudes and beliefs.
Black individuals appear to socially distance somewhat less than others do, and Asians appear to socially distance slightly more. Education appears to have little association with social distancing. As one might expect, essential workers—who are less able to socially distance because of their jobs—report adhering to socially distancing behaviors less, and they also see themselves isolating for a fewer number of weeks.
Political partisanship appears to have little association with social distancing. However, as with age, regression models with fewer independent, attitudinal variables reveal a significant association. Specifically, before we include controls for COVID‐19 news attentiveness and COVID‐19‐related attitudes and beliefs, Democrats report doing more social distancing than either Republicans or those who identify with neither of the major U.S. political parties (see table A2, model 2 in the appendix).
People with high levels of prosocial motivation appear to engage in more social distancing, and there is some indication that people with high levels of empathy can see themselves isolating for longer.
Media consumption habits are associated with social distancing and anticipated duration of isolation in interesting ways. Those who primarily get their news from radio or social media tend to report slightly less social distancing, while those who primarily get their news from websites tend to report more. People who get their news from magazines can see themselves avoiding social contact for longer, while those who get their news from television or radio indicate a fewer number of weeks for which they can see themselves isolating. We recognize that each of these news media types are marked by within‐type variation in political ideology (e.g., different television channels are reflective of different political views). However, as we control for political partisanship, our findings indicate the predictive value of knowing that someone does or does not consume each type of media source while holding that person's partisanship constant. Finally, those who indicate they follow news about COVID‐19 more closely appear more engaged in social distancing.
Many of the strongest predictors of social distancing behavior are COVID‐19‐related attitudes and beliefs. This is perhaps unsurprising given the costs of social distancing—costs that people may be unwilling to bear absent a strong belief in the importance of addressing the health issues caused by the coronavirus. Those who believe that COVID‐19 is a monumental threat to society tend to socially distance more, and those who believe that government should require nonessential businesses to close for a time tend to socially distance much more. Those who think we must keep the economy going even if it means more COVID‐19 deaths report behavior less consistent with social distancing guidelines. Finally, those who believe in temporarily closing businesses also tend to say they can see themselves avoiding social contact for much longer.
Discussion and Conclusion
What characterizes the individuals who are the least inclined to adhere to social distancing recommendations, presently and in the long term? We find survey evidence (n = 1,449) suggesting that Americans’ willingness to socially distance is associated with sociodemographic, behavioral, and attitudinal characteristics. While we do find that some demographic characteristics (gender, age, race, political party) meaningfully predict social distancing intentions, the explanatory power of such variables is relatively modest. Furthermore, some demographic variables (age, political party) lose their predictive power once we account for attentiveness to COVID‐19 news and COVID‐19‐related attitudes and beliefs. Thus, older age and Democratic partisanship are likely associated “indirectly” with social distancing compliance; these groups appear to exhibit a greater concern about the COVID‐19 situation and associated health risks, factors that, in turn, are strongly associated with social distancing behaviors. While we do find evidence that partisanship matters to some extent when predicting social distancing behavior, our simple three‐category measure of partisanship (Democrat, Republic, other) (see Baker and Renno 2019) does not allow us to consider whether even greater differences emerge once one distinguishes between weak and strong partisans. Future research should consider whether, for example, strong supporters of President Donald Trump behave differently than those who somewhat reluctantly support him. We also note that education levels do not significantly predict social distancing outcomes in any of our models—despite the emerging importance of education as a social cleavage in recent years (see Schaffner, MacWilliams, and Nteta 2018).
Social distancing behaviors also appear to be higher on average among those who have strong prosocial motivation and those who get their news from websites rather than radio or social media. The significance of prosocial motivation suggests that people are motivated in part to social distance by concern for the well‐being of others. We are somewhat surprised by the positive association between social distancing and the use of websites because print media has traditionally been viewed as more conducive to learning than online media, although some recent studies have reached relatively optimistic conclusions about the ability of news websites to promote productive engagement of audiences with information (Kruikemeier, Lecheler, and Boyer 2018; Fletcher and Nielsen 2017). Our negative finding for radio could align with Sobieraj and Berry's (2011) work suggesting that political commentary on cable television and radio tends to be especially loaded with “outrage discourse,” or rhetoric intended to elicit visceral reactions. Such appeals to outrage may effectively crowd out the very sorts of presentations of factual information that promote learning in other news media. To the extent that social media also disproportionately directs people to outrage discourse, this same mechanism could account for our negative finding for social media.
Results for the duration (number of weeks) that people are willing to stay at home and avoid social contact are estimated with less precision. However, we do find some indications that men and those who are more empathetic are more mentally prepared to follow stay‐at‐home orders lasting many weeks or months. COVID‐19‐related attitudes and beliefs appear to be the best predictors of this outcome, alongside choice of news sources. Individuals who primarily get their news from television or radio can see themselves avoiding social contact for fewer weeks, whereas those who get their news from magazines can see themselves isolating for longer.
These insights may help inform decision‐making aimed at securing and maintaining social distancing compliance across a highly diverse and politically polarized society. A Gallup Poll from April 17–19, 2020, suggests that Americans are as likely to say that the coronavirus situation in the United Sates is getting better (41 percent) as to say that it is getting worse (39 percent) (Jones 2020). Only 10 days earlier, they were far more likely to say that it was getting worse (62 percent). Trends such as this may soon bring about a critical need for new regulatory approaches, including communicative interventions and behavioral incentives directed at motivating people to maintain their social distancing behavior. Any positive signs in the containment of COVID‐19 spread may quickly fade or dissipate in the face of a (too) rapid attenuation in social distancing caused by, for example, “behavioral fatigue” or perceptual underestimation of the actual risk (Bell 2020).
One possible approach to address concerns about noncompliance is to target messaging toward the demographic groups that are least willing or mentally prepared to engage in prolonged social distancing efforts. Yet our results suggest that demographic factors are not particularly strong predictors of social distancing compliance. Thus, while targeted messaging may be advisable, public officials should also take care to guard against stereotyping or exaggerating the extent to which certain groups are less likely to comply with social distancing. Attitudes are better predictors of social distancing behavior than demographic factors, and attitudes about COVID‐19 are only weakly associated with demographics. Furthermore, apparent noncompliance may be driven by practical constraints, such as those faced by essential workers and communities of color; thus, public officials should consider not just how to discourage activities that increase infection rates but also how to empower all residents to socially distance to the greatest extent possible (see Barari et al. 2020). More broadly, policy makers and administrators would do well to remember that effective and normatively laudable implementation of government regulatory functions requires an attention to social equity and due process considerations that can easily be lost amid the zeal to address pressing social ills (see Haque 2002; Meier and Smith 1994; Spicer 2002).
Given that attitudes appear to be primary drivers of social distancing behavior, public messaging may be particularly important for gaining compliance. While firmly held attitudes are difficult to change, our results regarding media consumption are suggestive of potential means by which public officials might win over residents reluctant to uphold social distancing. Given that consumers of written news media and those who follow COVID‐19 news very closely tend to report stronger social distancing behavioral intentions, perhaps public officials should devote more attention to engaging with television and radio stations—media forms whose audiences appear less inclined to engage in social distancing presently or in the future. The U.S. public typically expresses greater trust in local than federal government (Cole and Kincaid 2000; see also Baker 1995), so it may be especially important for residents to hear from local officials, even when such officials feel ill prepared to go on live television or radio.
While public officials dealing with the coronavirus response are undoubtedly short on time right now, maintaining public support for compliance with public health guidelines is crucial. Dr. Anthony Fauci serves as an inspiring role model in this regard. Despite the demands on his time, Dr. Fauci has sat for numerous interviews across a wide range of media platforms, allowing him to inform the public about the latest coronavirus developments and what we can do to mitigate its spread. The topic of public engagement is of particular importance to public administration since the populace may have greater trust in information coming from public servants—especially medical doctors and scientists—than in officials filling roles viewed as more political (Frewer et al. 1996). This notion is directly connected to the classical politics‐administration dichotomy (Gulick 1937; Wilson 1887). Yet, while a degree of separation between “administration” (scientifically informed advice and implementation) and “politics” (resolving clashes over political values and norms) may be crucial for the effectiveness of public health messaging during COVID‐19, complete segmentation of these tasks is impossible, perhaps more so than ever in the highly polarized U.S. political landscape of 2020. Indeed, research suggests that even before the present pandemic, President Trump had made numerous statements about health care and public policy that were unprecedentedly skewed by political interests (Hatcher 2019). Furthermore, all government health officials and scientists, including Dr. Fauci, are directed to strictly and tightly coordinate all statements and public appearances with the White House (Johnson, Pollock, and Rauhaus 2020; Shear and Haberman 2020), pointing to the political control that partisan officials can exert over career government employees.
When it comes to formulating content for effective public messaging, COVID‐19‐related research supports the utility of appealing to peoples’ prosocial motivation and empathy as means for promoting social distancing (Everett et al. 2020; Pfattheicher et al. 2020). However, research also emphasizes public messaging focused on ideas for how to ease the burden of isolation, rather than a lopsided perspective on only the health risks and dangers of not adhering to social distancing (Barari et al. 2020; Favero and Pedersen 2020). Moreover, use of charismatic leadership tactics—a set of specific rhetorical techniques in communication—may improve the effectiveness of both types of messaging (Jensen 2020). A mixed approach may be the way forward.
Biographies
Mogens Jin Pedersen is associate professor in the Department of Political Science, University of Copenhagen, and affiliate senior researcher at VIVE, the Danish Center for Social Science Research. His research focuses on work motivation, public management and performance, employee behavior and decision‐making, gender and racial biases, and research methodology.
Email: mp@ifs.ku.dk
Nathan Favero is assistant professor in the Department of Public Administration and Policy, School of Public Affairs, American University. His research interests include public administration and management, race and ethnicity, quantitative methodology, education policy, and formal theories of cooperation and policy making.
Email: favero@american.edu
Appendix 1.
Data Collection
Our survey sample comprises U.S. residents recruited via Prolific—a commercial crowdworking platform similar to Amazon's Mechanical Turk. In particular, participants were invited to complete a five‐minute survey on “Coronavirus (COVID‐19) Perceptions” in exchange for $0.55. Prolific has implemented extensive measures for preventing individuals from setting up multiple user accounts (Bradley 2018), and research supports that Prolific has a diverse participant pool and is suitable for online social science experimentation (Palan and Schitter 2018). Indeed, our survey included three attention check items (the item prompt read, “This is an attention check. Please click ‘[specified response option varying across attention check items]’”), each one embedded in separate item batteries, and analyses verify a high level of attentiveness (the pass rate was 99.1 percent for two or more attention checks and 94 percent for all three attention checks).
The survey was approved by the Institutional Review Board for Protection of Human Subjects in Research at American University (protocol #IRB‐2020‐299), and respondents gave informed consent to participate in research. Full replication materials for this study are available at Harvard Dataverse: https://doi.org/10.7910/DVN/CMC00M.
Survey Weights
Survey weights were constructed using poststratification raking based on gender, age, education level, and race. Prior to constructing weights, listwise deletion was used to eliminate any observations with missing values for variable used in this study (note: individuals who selected nonbinary gender in our survey were dropped because population figures for nonbinary gender identification are not available from the American Community Survey). Weights were constructed using the user‐written Stata command ipfraking (after convergence, weights were trimmed to a minimum of .5 and a maximum of 2 to avoid extreme weighting of observations). Population figures were based on 2018 American Community Survey one‐year estimates, which indicated the following population proportions:
Age: 18–24 = 0.121, 25–44 = 0.342, 45 + =0.537 (Census Table S0101)
Female (among adults): 0.513 (Census Table S0101)
Race (among adults): white = 0.632, black = 0.122, Latino = 0.163, Asian = 0.060, other = remainder (NCES Digest of Education Statistics Table 101.20)
Education (among adults): high school or less = 0.393, some college/associate's degree = 0.307, bachelor's degree = 0.300 (Census Table S1501)
Measures
Social distancing behavior was measured using an index comprising the five items appearing in the research note (table 1). We developed the items for the purpose of our survey. The five items were preceded by the following text: “To what extent do you agree with the following statements? During the next few weeks . . .” Item order was randomized, and item responses were captured on an 11‐point Likert scale, anchored at 0 = “strongly disagree” and 10 = “strongly agree.” The index was generated as a simple additive measure (Cronbach's α = .73), with each item having equal weight, and rescaled to a theoretical range of 0 to 100 by multiplying the additive scale by 2 (0 = “no intention to socially distance” and 100 = “maximum social distancing”).
Social distancing anticipated duration was measured using the following item: “What is the longest amount of time you could see yourself staying at home as much as possible and avoiding all social contact (i.e., adhering to so‐called “social distancing”)? If officials advised it, I could see myself generally staying at home and avoiding social contact for up to [text box requiring whole‐number] weeks.” We developed the item for the purpose of our survey. Responses were entered into an open textbox, because we did not want to prime respondents based on a set of preconstructed response options.
Both social distancing outcomes were preceded by a brief informational text passage involving experimental variation in degree of appeal to prosocial motivation and empathy (Favero and Pedersen 2020). Importantly, the minor difference in text did not appear to affect the survey responses in a meaningful way. ANOVA tests yield p‐values indicating nothing close to a significant difference in means across experimental condition (p = .93 for social distancing behavior; p = .98 for anticipated duration). Still, we decided on a cautious approach and, therefore, conduct our analyses controlling for treatment assignment. As a robustness check, we run regressions without treatment dummies (see table A2). We also tried controlling for the geographic region of residence and found no meaningful change in our results (these models not shown).
COVID‐19 news consumption was measured using the following item: “How closely have you been following news about coronavirus (COVID‐19)?” Response options were captured on a 4‐point scale (“very closely” = 1, “fairly closely” = 0.67, “not too closely” = 0.33), “not at all closely” = 0). Responses were assigned these values to make the scale range from 0 to 1.
COVID‐19‐related attitudes and beliefs were measured by the four individual items appearing in the research note (table 1). The four items were preceded by the following text: “To what extent do you agree with the following statements?” Item order was randomized, and item responses were captured on an 11‐point Likert scale, anchored at 0 = “strongly disagree” and 10 = “strongly agree.” Our measure of each attitude was then divided by 10 to produce a range of 0 to 1.
Political affiliation was measured using the following item: “What is your preferred political party?” Response options were “Republican,” “Democratic,” “Other” (in randomized order).
Prosocial motivation was measured using a slightly adapted version of a four‐item scale by Grant (2008) (Cronbach's α = .92), with four response options (“very closely,” “fairly closely,” “not too closely,” “not at all closely”). An additive index was created and then rescaled to a theoretical range of 0 to 1, with a 1 indicating “very closely” for all four items. The prosocial motivation items were presented in random order in a batter that also included our empathy measure (which used the same response options). Empathy was measured using the Singe Item Trait Empathy Scale (SITES)—an item developed and validated by Konrath, Meier, and Bushman (2018)—and was also scaled to range from 0 to 1, with 1 indicating “very closely.”
Primary news source was measured using the following item: “Where do you usually get information about the news? (Select all that apply).” Response options were newspapers, magazines, television, radio, websites, social media (e.g., Facebook, Twitter) (in randomized order).
In terms of question ordering, the following items appeared prior to the social distancing items: gender, age, education, prosocial motivation, empathy, political affiliation, and news consumption. Information about race and “essential worker” status was collected at the end of the survey.
Table A1.
Summary Statistics
| Using Weights | Not Using Weights | ||||
|---|---|---|---|---|---|
| Range | Mean | SD | Mean | SD | |
| Social distancing behavior (index) | 0–100 | 87.78 | 14.86 | 87.24 | 14.63 |
| Social distancing anticipated duration | 0–104 | 16.92 | 19.94 | 16.68 | 19.37 |
| Following COVID news | 0–1 | 0.81 | 0.21 | 0.80 | 0.21 |
| COVID biggest threat | 0–1 | 0.71 | 0.29 | 0.69 | 0.28 |
| Prioritize reducing death | 0–1 | 0.82 | 0.22 | 0.82 | 0.22 |
| Keep economy going | 0–1 | 0.26 | 0.28 | 0.26 | 0.27 |
| Close businesses | 0–1 | 0.85 | 0.23 | 0.85 | 0.22 |
| Male | 0–1 | 0.50 | 0.51 | ||
| Female | 0–1 | 0.50 | 0.49 | ||
| Age: < 24 | 0–1 | 0.19 | 0.24 | ||
| Age: 25–44 | 0–1 | 0.45 | 0.57 | ||
| Age: 45+ | 0–1 | 0.36 | 0.19 | ||
| White | 0–1 | 0.66 | 0.66 | ||
| Black | 0–1 | 0.09 | 0.07 | ||
| Hispanic | 0–1 | 0.13 | 0.10 | ||
| Asian | 0–1 | 0.09 | 0.11 | ||
| Other race | 0–1 | 0.04 | 0.05 | ||
| High school or less | 0–1 | 0.22 | 0.11 | ||
| Some college/associate's degree | 0–1 | 0.33 | 0.33 | ||
| Bachelor's degree+ | 0–1 | 0.45 | 0.55 | ||
| Not essential worker | 0–1 | 0.77 | 0.75 | ||
| Essential worker | 0–1 | 0.19 | 0.20 | ||
| Unsure if essential worker | 0–1 | 0.04 | 0.04 | ||
| Republican | 0–1 | 0.22 | 0.20 | ||
| Democrat | 0–1 | 0.61 | 0.63 | ||
| Other party | 0–1 | 0.17 | 0.17 | ||
| Prosocial motivation | 0–1 | 0.84 | 0.17 | 0.84 | 0.17 |
| Empathy | 0–1 | 0.82 | 0.22 | 0.81 | 0.22 |
| Newspapers* | 0–1 | 0.25 | 0.26 | ||
| Magazines* | 0–1 | 0.06 | 0.06 | ||
| Television* | 0–1 | 0.58 | 0.53 | ||
| Radio* | 0–1 | 0.23 | 0.22 | ||
| Websites* | 0–1 | 0.79 | 0.80 | ||
| Social media* | 0–1 | 0.60 | 0.64 | ||
Respondents could select multiple sources of news; the item prompt read, “Where do you usually get information about the news? (Select all that apply).”
n = 1,449.
Table A2.
OLS Regression Results
| DV: Social Distancing Behavior Index | DV: Anticipated Duration | |||||||
|---|---|---|---|---|---|---|---|---|
| (1)b/se | (2)b/se | (3)b/se | (4)b/se | (5)b/se | (6)b/se | (7)b/se | (8)b/se | |
| Female | 5.37** | 4.60** | 2.91** | 3.03** | −1.25 | −1.57 | −2.16+ | −2.40* |
| (0.92) | (0.95) | (0.78) | (0.66) | (1.28) | (1.27) | (1.28) | (1.03) | |
| Age: 25–44 | 1.48 | 1.00 | −0.84 | 0.51 | 2.47 | 2.37 | 2.14 | 1.78 |
| (1.24) | (1.26) | (1.17) | (0.89) | (1.58) | (1.57) | (1.57) | (1.35) | |
| Age: 45+ | 4.02** | 3.83** | 1.58 | 2.45* | 1.90 | 2.37 | 2.41 | 1.66 |
| (1.25) | (1.29) | (1.19) | (1.10) | (1.87) | (1.98) | (2.01) | (1.86) | |
| Black | −5.31* | −5.83** | −3.74* | −2.90* | −3.16 | −2.39 | −1.70 | −1.27 |
| (2.07) | (2.12) | (1.78) | (1.38) | (2.05) | (1.98) | (2.06) | (1.78) | |
| Hispanic | 0.41 | 0.23 | −0.05 | 0.27 | 1.40 | 2.17 | 1.88 | 1.71 |
| (1.24) | (1.31) | (1.22) | (1.10) | (2.37) | (2.34) | (2.36) | (1.88) | |
| Asian | 0.74 | 0.95 | 1.91+ | 1.80+ | −2.42+ | −2.89+ | −2.40 | −1.66 |
| (1.32) | (1.27) | (1.12) | (0.92) | (1.42) | (1.56) | (1.55) | (1.45) | |
| Other | −4.11+ | −3.80+ | −1.68 | −2.03 | 0.22 | 0.31 | 0.71 | 1.97 |
| (2.20) | (2.19) | (1.72) | (1.47) | (2.87) | (2.87) | (2.77) | (2.59) | |
| Some college/associate's degree | 1.82 | 1.43 | 1.11 | −0.10 | 2.75 | 2.57 | 2.34 | 0.76 |
| (1.52) | (1.47) | (1.26) | (1.22) | (1.93) | (1.90) | (1.88) | (1.84) | |
| Bachelor's degree+ | 0.88 | 0.55 | 0.24 | −0.53 | 0.26 | −0.48 | −0.82 | −1.16 |
| (1.58) | (1.52) | (1.28) | (1.20) | (1.75) | (1.73) | (1.76) | (1.76) | |
| Essential worker | −4.29** | −3.57** | −2.97** | −3.48** | −3.31* | −2.85* | −2.54+ | −3.31** |
| (1.31) | (1.35) | (1.09) | (0.88) | (1.40) | (1.41) | (1.40) | (1.21) | |
| Unsure if essential worker | −4.37* | −3.06 | −2.92+ | −2.51 | −5.70** | −4.94** | −4.46** | −4.29* |
| (1.89) | (1.88) | (1.72) | (1.64) | (1.72) | (1.69) | (1.68) | (1.95) | |
| Democrat | 3.73** | −0.86 | −0.21 | 0.85 | −0.77 | −2.57+ | ||
| (1.29) | (1.29) | (1.04) | (1.61) | (1.72) | (1.52) | |||
| Other Party | 0.60 | −0.27 | 0.79 | 2.15 | 1.38 | 1.61 | ||
| (1.70) | (1.49) | (1.22) | (2.15) | (2.18) | (2.02) | |||
| Prosocial motivation | 15.52** | 7.43* | 10.34** | −2.33 | −4.76 | −3.16 | ||
| (3.52) | (3.04) | (2.66) | (5.79) | (5.95) | (4.14) | |||
| Empathy | −1.35 | −0.61 | −1.51 | 5.70 | 6.72+ | 4.12 | ||
| (2.50) | (2.29) | (2.15) | (4.05) | (4.05) | (3.06) | |||
| Newspapers | 0.94 | 0.36 | 0.70 | 1.28 | 1.59 | 0.80 | ||
| (0.95) | (0.80) | (0.72) | (1.40) | (1.44) | (1.14) | |||
| Magazines | −3.84+ | −2.10 | −3.42* | 5.88+ | 6.94* | 5.90* | ||
| (2.02) | (1.91) | (1.62) | (3.34) | (3.42) | (2.94) | |||
| Television | 1.18 | −0.22 | 0.25 | −5.21** | −4.94** | −3.48** | ||
| (0.90) | (0.79) | (0.66) | (1.41) | (1.42) | (1.07) | |||
| Radio | −1.54 | −1.71+ | −1.62+ | −2.60* | −2.84* | −0.52 | ||
| (1.01) | (0.91) | (0.84) | (1.32) | (1.33) | (1.28) | |||
| Websites | 2.95* | 2.36* | 1.86+ | 1.35 | 1.32 | −0.15 | ||
| (1.44) | (1.14) | (0.97) | (1.47) | (1.48) | (1.33) | |||
| Social media | −1.00 | −1.29+ | −1.61* | −1.94 | −2.13 | −2.82* | ||
| (0.95) | (0.77) | (0.70) | (1.35) | (1.37) | (1.14) | |||
| Following COVID news | 8.56** | 7.31** | −2.61 | −2.78 | ||||
| (2.51) | (1.94) | (3.46) | (2.83) | |||||
| COVID biggest threat | 4.67* | 3.45* | −3.54 | −2.39 | ||||
| (2.10) | (1.52) | (2.73) | (2.25) | |||||
| Prioritize reducing death | 0.03 | 2.00 | −1.61 | −1.56 | ||||
| (3.73) | (2.91) | (3.93) | (3.20) | |||||
| Keep economy going | −9.69** | −8.05** | −4.22 | −7.29** | ||||
| (3.03) | (2.24) | (2.84) | (2.41) | |||||
| Close businesses | 18.11** | 19.06** | 11.28** | 12.11** | ||||
| (2.61) | (2.36) | (3.77) | (3.09) | |||||
| Treatment 1 | −0.63 | −0.33 | 0.20 | −0.84 | −0.52 | −0.25 | ||
| (1.43) | (1.38) | (1.20) | (2.27) | (2.17) | (2.18) | |||
| Treatment 2 | −0.35 | −0.20 | 0.38 | −0.96 | −0.88 | −0.83 | ||
| (1.51) | (1.46) | (1.24) | (2.21) | (2.16) | (2.12) | |||
| Treatment 3 | −0.92 | −0.71 | −0.67 | −0.56 | −0.79 | −0.83 | ||
| (1.37) | (1.34) | (1.24) | (2.35) | (2.32) | (2.33) | |||
| Treatment 4 | −0.12 | 0.12 | 0.87 | −1.45 | −0.96 | −0.69 | ||
| (1.57) | (1.52) | (1.29) | (2.07) | (1.99) | (1.99) | |||
| Constant | 83.93** | 68.13** | 57.63** | 54.65** | 16.67** | 16.14** | 16.20** | 18.57** |
| (1.72) | (4.26) | (4.68) | (3.73) | (2.29) | (4.10) | (5.61) | (4.79) | |
| Weights used | Yes | Yes | Yes | No | Yes | Yes | Yes | No |
| R 2 | 0.080 | 0.132 | 0.331 | 0.325 | 0.018 | 0.048 | 0.066 | 0.066 |
| N | 1,449 | 1,449 | 1,449 | 1,449 | 1,449 | 1,449 | 1,449 | 1,449 |
Notes: Standard errors in parentheses (robust option used for models 4 and 8). Comparison groups for categorical variables are: male, age < 24, white, high school or less, not essential worker, Republican.
p < .10;
p < .05;
p < .01 (two‐tailed).
Note
Replication materials for this study are available at https://doi.org/10.7910/DVN/CMC00M.
References
- Ahmed, Faruque , Zviedrite Nicole, and Uzicanin Amra. 2018. Effectiveness of Workplace Social Distancing Measures in Reducing Influenza Transmission: A Systematic Review. BMC Public Health 18: 518. [DOI] [PMC free article] [PubMed] [Google Scholar]
- Baker, Andy , and Renno Lucio. 2019. Nonpartisans as False Negatives: The Mismeasurement of Party Identification in Public Opinion Surveys. Journal of Politics 81(3): 906–22. [Google Scholar]
- Baker, Earl J. 1995. Public Response to Hurricane Probability Forecasts. The Professional Geographer 47(2): 137–47. [Google Scholar]
- Barari, Soubhik , Caria Stefano, Davola Antonio, Falco Paolo, Fetzer Thiemo, Fiorin Stefano, Hensel Lukas, et al. 2020. Evaluating COVID‐19 Public Health Messaging in Italy: Self‐Reported Compliance and Growing Mental Health Concerns. Working paper. https://gking.harvard.edu/covid‐italy [accessed June 2, 2020].
- Bell, Vaughan . 2020. Do We Suffer “Behavioral Fatigue” for Pandemic Prevention Measures? Mind Hacks, March 20. https://mindhacks.com/2020/03/20/do‐we‐suffer‐behavioural‐fatigue‐for‐pandemic‐prevention‐measures/ [accessed June 2, 2020].
- Bosman, Julie , Tavernise Sabrina, and Baker Mike. 2020. Why These Protesters Aren't Staying Home for Coronavirus Orders. New York Times, April 23. https://www.nytimes.com/2020/04/23/us/coronavirus‐protesters.html [accessed June 2, 2020].
- Bradley, Phelim . 2018. Bots and Data Quality on Crowdsourcing Platforms, Prolific Blog, August 10. https://blog.prolific.co/bots‐and‐data‐quality‐on‐crowdsourcing‐platforms/ [accessed June 2, 2020].
- Briscese, Guglielmo , Lacetera Nicola, Macis Mario, and Tonin Mirco. 2020. Compliance with COVID‐19 Social‐Distancing Measures in Italy: The Role of Expectations and Duration. Working Paper 26916, National Bureau of Economic Research. https://www.nber.org/papers/w26916 [accessed June 2, 2020].
- Chen, Simiao , Yang Juntao, Yang Weizhong, Wang Chen, and Bärnighausen Till. 2020. COVID‐19 Control in China during Mass Population Movements at New Year. The Lancet 395(10226): 764–6. [DOI] [PMC free article] [PubMed] [Google Scholar]
- Christensen, Jørgen G. 2011. Competing Theories of Regulatory Governance: Reconsidering Public Interest Theory of Regulation. In Handbook on the Politics of Regulation, edited by Levi‐Faur David, 96–112. Northampton, MA: Edward Elgar. [Google Scholar]
- Coffe, Hilde , and Bolzendahl Catherine. 2010. Same Game, Different Rules? Gender Differences in Political Participation. Sex Roles 62(5–6): 318–33. [DOI] [PMC free article] [PubMed] [Google Scholar]
- Cole, Richard L. , and Kincaid John. 2000. Public Opinion and American Federalism: Perspectives on Taxes, Spending, and Trust—An ACIR Update. Publius: The Journal of Federalism 30(1): 189–201. [Google Scholar]
- Cortez, Michelle F. 2020. Who Would Have Predicted This? Americans Excel at Staying Home. Bloomberg News, April 14. https://www.bloomberg.com/news/articles/2020‐04‐14/stay‐home‐during‐outbreak‐americans‐stick‐to‐social‐distancing [accessed June 2, 2020].
- Eisenberg, Joseph . 2020. How Scientists Quantify the Intensity of an Outbreak Like COVID‐19. University of Michigan Health Lab, March 17. https://labblog.uofmhealth.org/rounds/how‐scientists‐quantify‐intensity‐of‐an‐outbreak‐like‐covid‐19 [accessed June 2, 2020].
- European Centre for Disease Prevention and Control (ECDC) . 2020. Considerations Relating to Social Distancing Measures in Response to COVID‐19—Second Update. March 23. https://www.ecdc.europa.eu/en/publications‐data/considerations‐relating‐social‐distancing‐measures‐response‐covid‐19‐second [accessed June 2, 2020]. [Google Scholar]
- Everett, Jim A. C. , Colombatto Clara, Chituc Vladimir, Brady William J., and Crockett Molly J.. 2020. The Effectiveness of Moral Messages on Public Health Behavioral Intentions during the COVID‐19 Pandemic. https://psyarxiv.com/9yqs8 [accessed June 2, 2020].
- Favero, Nathan , and Bullock Justin B.. 2015. How (Not) to Solve the Problem: An Evaluation of Scholarly Responses to Common Source Bias. Journal of Public Administration Research and Theory 25(1): 285–308. [Google Scholar]
- Favero, Nathan , and Pedersen Mogens Jin. 2020. How to Encourage “Togetherness by Keeping Apart” amid COVID‐19? The Ineffectiveness of Prosocial and Empathy Appeals. Journal of Behavioral Public Administration 3(2). 10.30636/jbpa.32.167. [DOI] [Google Scholar]
- Fernandez, Marisa . 2020. More states issue stay‐at‐home orders as coronavirus crisis escalates. Axios, April 3. https://web.archive.org/web/20200403223552/ https://www.axios.com/states-shelter-in-place-coronavirus-66e9987a-a674-42bc-8d3f-070a1c0ee1a9.html.
- Ferrante, Gianluigi , Baldissera Sandro, Moghadam Pirous F., Carrozzi Giuliano, Trinito Massimo O., and Salmaso Stefania. 2011. Surveillance of Perceptions, Knowledge, Attitudes and Behaviors of the Italian Adult Population (18–69 Years) during the 2009–2010 A/H1N1 Influenza Pandemic. European Journal of Epidemiology 26: 211–9. [DOI] [PubMed] [Google Scholar]
- Fetzer, Thiemo , Witte Marc, Hensel Lukas, Jachimowicz Jon M., Haushofer Johannes, Ivchenko Andriy, Caria Stefano, et al. 2020. Global Behaviors and Perceptions in the COVID‐19 Pandemic. https://psyarxiv.com/3kfmh [accessed June 2, 2020].
- Fine, Adam , Thomas April, van Rooij Benjamin, and Cauffman Elizabeth. 2020. Age‐Graded Differences and Parental Influences on Adolescents’ Obligation to Obey the Law. Journal of Developmental and Life‐Course Criminology 6: 25–42. [Google Scholar]
- Fletcher, Richard , and Nielsen Rasmus Kleis. 2017. Are News Audiences Increasingly Fragmented? A Cross‐National Comparative Analysis of Cross‐Platform News Audience Fragmentation and Duplication. Journal of Communication 67(4): 476–98. [Google Scholar]
- Fong, Min W. , Gao Huizho, Wong Jessica Y., Xiao Jingyi, Shiu Eunice Y.C., Ryu Sukhyun, and Cowling Bejamin J.. 2020. Non‐pharmaceutical Measures for Pandemic Influenza in Nonhealthcare Settings—Social Distancing Measures. Emerging Infectious Diseases 26(5): 976–84. 10.3201/eid2605.190995. [DOI] [PMC free article] [PubMed] [Google Scholar]
- Frewer, Lynn J. , Howard Chaya, Hedderley Duncan, and Shepherd Richard. 1996. What Determines Trust in Information about Food‐Related Risks? Underlying Psychological Constructs. Risk Analysis 16(4): 473–86. [DOI] [PubMed] [Google Scholar]
- Gollwitzer, Anton , Martel Cameron, Marshall Julia, Höhs Johanna M., and Bargh John A.. 2020. Connecting Self‐Reported Social Distancing to Real‐World Behavior at the Individual and U.S. State Level. https://psyarxiv.com/kvnwp/ [accessed June 2, 2020].
- Granié, Marie‐Axelle . 2007. Gender Differences in Preschool Childrens’ Declared and Behavioral Compliance with Pedestrian Rules. Transportation Research Part F: Traffic Psychology and Behavior 10(5): 371–82. [Google Scholar]
- Grant, Adam M. 2008. Does Intrinsic Motivation Fuel the Prosocial Fire? Predicting Motivational Synergy in Persistence, Performance, and Productivity. Journal of Applied Psychology 93(1): 48–58. [DOI] [PubMed] [Google Scholar]
- Gulick, Luther . 1937. Science, Values and Public Administration. In Papers on the Science of Administration, edited by Gulick Luther and Urwick Lyndall, 189–95. New York: Institute of Public Administration. [Google Scholar]
- Hatcher, William . 2019. President Trump and Health Care: A Content Analysis of Misleading Statements. Journal of Public Health. 10.1093/pubmed/fdz176. [DOI] [PubMed] [Google Scholar]
- Haque, M. Shamsul . 2002. Government Responses to Terrorism: Critical Views of their Impacts on People and Public Administration. Special issue, Public Administration Review 62: 170–180. [Google Scholar]
- Jensen, Ulrich T . 2020. Leadership Communication in Times of Crisis: Can Charisma Increase Willingness to Social Distance? https://osf.io/be59w/?view_only=a48036a7bd364a91a04fc5ddde6eb011 [accessed June 2, 2020].
- Johnson, Andrew F. , Pollock Wendi, and Rauhaus Beth. 2020. Mass Casualty Event Scenarios and Political Shifts: 2020 Election Outcomes and the U.S. COVID‐19 Pandemic. Administrative Theory and Praxis 42(2): 249–264. 10.1080/10841806.2020.1752978. [DOI] [Google Scholar]
- Jones, Jeffrey M. 2020. American Less Pessimistic about COVID‐19 Situation. Gallup, April 16. https://news.gallup.com/poll/308495/americans‐less‐pessimistic‐covid‐situation.aspx [accessed June 2, 2020].
- Kissler, Stephen M. , Tedijanto Christine, Goldstein Edward, Grad Yonatan H., and Lipsitch Marc. 2020. Projecting the Transmission Dynamics of SARS‐CoV‐2 through the Postpandemic Period. Science 368(6493): 860–868. 10.1126/science.abb5793. [DOI] [PMC free article] [PubMed] [Google Scholar]
- Konrath, Sara , Meier Brian P., and Bushman Brad J.. 2018. Development and Validation of the Single Item Trait Empathy Scale (SITES). Journal of Research in Personality 73: 111–22. [DOI] [PMC free article] [PubMed] [Google Scholar]
- Kruikemeier, Sanne , Lecheler Sophie, and Boyer Ming M.. 2018. Learning from News on Different Media Platforms: An Eye‐Tracking Experiment. Political Communication 35(1): 75–96. [Google Scholar]
- Lowenstein, George , and Mather Jane. 1990. Dynamic Processes in Risk Perception. Journal of Risk and Uncertainty 3: 155–75. [Google Scholar]
- Lunn, Peter D. , Timmons Shane, Belton Cameron A., Barjaková Martina, Julienne Hannah, and Lavin Ciarán. 2020. Motivating Social Distancing during the Covid‐19 Pandemic: An Online Experiment. Working Paper 658, Economic and Social Research Institute, April 3. https://www.esri.ie/publications/motivating‐social‐distancing‐during‐the‐covid‐19‐pandemic‐an‐online‐experiment [accessed June 2, 2020]. [DOI] [PubMed]
- McCarthy, Justin . 2020. Social Distancing Efforts Have Cemented into U.S. Life. Gallup, April 13. https://news.gallup.com/poll/308252/social‐distancing‐efforts‐cemented‐life.aspx [accessed June 2, 2020].
- Meier, Kenneth J. , and Smith Kevin B.. 1994. Say It Ain't So, Moe: Institutional Design, Policy Effectiveness, and Drug Policy. Journal of Public Administration Research and Theory 4(4): 429–42. [Google Scholar]
- Merelli, Annalisa . 2020. For Most of the World, Social Distancing Is an Unimaginable Luxury. Quartz, March 27. https://qz.com/1822556/for‐most‐of‐the‐world‐social‐distancing‐is‐an‐unimaginable‐luxury/ [accessed June 2, 2020].
- Mitnick, Barry M. 1980. Incentive Systems in Environmental Regulation. Policy Studies Journal 9(3): 379–94. [Google Scholar]
- Moore, Ryan C. , Lee Angela, Hancock Jeffrey T., Halley Meghan, and Linos Eleni. 2020. Experience with Social Distancing Early in the COVID‐19 Pandemic in the United States: Implications for Public Health Messaging. https://www.medrxiv.org/content/10.1101/2020.04.08.20057067v1 [accessed June 2, 2020].
- Palan, Stefan , and Schitter Christina. 2018. Prolific.Ac—A Subject Pool for Online Experiment. Journal of Behavioral and Experimental Finance 17: 22–7. [Google Scholar]
- Paun, Carmen , Deutsch Jillian, Furlong Ashleigh, Wheaton Sarah, Mischke Judith, Cokelaere Hanne, Moens Barbara, et al. 2020. How Europe Is Responding to the Coronavirus Pandemic. Politico, March 13. https://www.politico.eu/article/how‐europe‐is‐responding‐to‐the‐coronavirus‐pandemic/ [accessed June 2, 2020].
- Peer, Eyal , Brandmarte Laura, Samat Sonam, and Acquisti Alessandro. 2017. Beyond the Turk: Alternative Platforms for Crowdsourcing Behavioral Research. Journal of Experimental Social Psychology 70: 153–63. [Google Scholar]
- Peterson, Erik . 2019. Not Dead Yet: Political Learning from Newspapers in a Changing Media Landscape. Political Behavior. Published online June 14. 10.1007/s11109-019-09556-7. [DOI] [Google Scholar]
- Pfattheicher, Stefan , Nockur Laila, Böhm Robert, Sassenrath Claudia, and Petersen Michael Bang. 2020. The Emotional Path to Action: Empathy Promotes Physical Distancing during the COVID‐19 Pandemic. https://psyarxiv.com/y2cg5/ [accessed June 2, 2020]. [DOI] [PubMed]
- Portillo, Shannon , and DeHart‐Davis Leisha. 2009. Gender and Organizational Rule Abidance. Public Administration Review 69(2): 339–47. [Google Scholar]
- Psylla, Ioanna , Sapiezynski Piotr, Mones Enys, and Lehmann Sune. 2017. The Role of Gender in Social Network Organization. PLOS ONE 12(12): e0189873. 10.1371/journal.pone.0189873. [DOI] [PMC free article] [PubMed] [Google Scholar]
- Rashid, Harunor , Ridda Iman, King Catherine, Begun Matt, Tekin Hatice, Wood James G., and Booy Robert. 2014. Evidence Compendium and Advice on Social Distancing and Other Related Measures for Response to an Influenza Pandemic. Paediatric Respiratory Reviews 16(2): 119–26. [DOI] [PubMed] [Google Scholar]
- Raude, Jocelyn , McColl Kathleen, Flamand Claude, and Apostolidis Themis. 2019. Understanding Health Behaviour Changes in Response to Outbreaks: Findings from a Longitudinal Study of a Large Epidemic of Mosquito‐Borne Disease. Social Science & Medicine 230: 184–93. [DOI] [PubMed] [Google Scholar]
- Resnick, Brian . 2020. Social Distancing Can't Last Forever. Here's What Should Come Next. Vox, March 30. https://www.vox.com/science‐and‐health/2020/3/26/21192211/coronavirus‐covid‐19‐social‐distancing‐end [accessed June 2, 2020].
- Schaffner, Brian F. , MacWilliams Matthew, and Nteta Tatishe. 2018. Understanding White Polarization in the 2016 Vote for President: The Sobering Role of Racism and Sexism. Political Science Quarterly 133(1): 9–34. [Google Scholar]
- Shear, Michael D. , and Haberman Maggie, 2020. Pence Will Control All Coronavirus Messaging from Health Officials. New York Times, February 27. https://www.nytimes.com/2020/02/27/us/politics/us‐coronavirus‐pence.html [accessed June 2, 2020].
- Shye, Diana , Mullooly John P., Freeborn Donald K., and Hope Clyde R.. 1995. Gender Differences in the Relationship between Social Network Support and Mortality: A Longitudinal Study of an Elderly Cohort. Social Science & Medicine 41(7): 935–47. [DOI] [PubMed] [Google Scholar]
- Sobieraj, Sarah , and Berry Jeffrey M.. 2011. From Incivility to Outrage: Political Discourse in Blogs, Talk Radio, and Cable News. Political Communication 28(1): 19–41. [Google Scholar]
- Spicer, Michael W. 2002. The War on Terrorism and the Administration of the American State. Special issue, Public Administration Review 62: 63–68. [Google Scholar]
- Springborn, Michael , Chowell Gerardo, MacLachlan Matthew, and Fenichel Eli P.. 2015. Accounting for Behavioral Responses during a Flu Epidemic Using Home Television Viewing. BMC Infectious Diseases 15(1): 21. [DOI] [PMC free article] [PubMed] [Google Scholar]
- Strömbäck, Jesper , Falasca Kajsa, and Kruikemeier Sanne. 2018. The Mix of Media Use Matters: Investigating the Effects of Individual News Repertoires on Offline and Online Political Participation. Political Communication 35(3): 413–32. [Google Scholar]
- Utych, Stephen M. , and Fowler Luke. 2020. Age‐Based Messaging Strategies for Communication about COVID‐19. Journal of Behavioral Public Administration 3(1). 10.30636/jbpa.31.151. [DOI] [Google Scholar]
- Wilson, James Q. 1995. Political Organizations. Princeton, NJ: Princeton University Press. [Google Scholar]
- Wilson, Woodrow . 1887. The Study of Administration. Political Science Quarterly 2(2): 197–222. [Google Scholar]
- Wong, Li Ping , and Sam I‐Ching. 2010. Temporal Changes in Psychobehavioral Responses during the 2009 H1N1 Influenze Pandemic. Preventive Medicine 51(1): 92–3. [DOI] [PMC free article] [PubMed] [Google Scholar]
- World Health Organization (WHO) . 2020. Coronavirus Disease (COVID‐19) Advice for the Public. March 18. https://www.who.int/emergencies/diseases/novel‐coronavirus‐2019/advice‐for‐public [accessed June 2, 2020].
- Yang, Kaite , and Girgus Joan S.. 2019. Are Women more Likely than Men Are to Care Excessively about Maintaining Positive Social Relationships? A Meta‐analytical Review of the Gender Difference in Sociotropy. Sex Roles 81(3–4): 157–172. [Google Scholar]
- Zhang, Yuzhen , Jiang Bin, Yuan Jiamin, and Tao Yanyun. 2020. The Impact of Social Distancing and Epicenter Lockdown on the COVID‐19 Epidemic in Mainland China: A Data‐Driven SEIQR Model Study. https://www.medrxiv.org/content/10.1101/2020.03.04.20031187v1 [accessed June 2, 2020].