

Abstract
To study the relationship between clinical indexes and the severity of coronavirus disease 2019 (COVID‐19), and to explore its role in predicting the severity of COVID‐19. Clinical data of 443 patients with COVID‐19 admitted to our hospital were retrospectively analyzed, which were divided into nonsevere group (n = 304) and severe group (n = 139) according to their condition. Clinical indicators were compared between different groups. The differences in sex, age, the proportion of patients with combined heart disease, leukocyte, neutrophil‐to‐lymphocyte ratio (NLR), neutrophil, lymphocyte, platelet, D‐dimer, C‐reactive protein (CRP), procalcitonin, lactate dehydrogenase, and albumin on admission between the two groups were statistically significant (P < .05). Multivariate logistic regression analysis showed NLR and CRP were independent risk factors for severe COVID‐19. Platelets were independent protective factors for severe COVID‐19. The receiver operating characteristic (ROC) curve analysis demonstrated area under the curve of NLR, platelet, CRP, and combination was 0.737, 0.634, 0.734, and 0.774, respectively. NLR, CRP, and platelets can effectively assess the severity of COVID‐19, among which NLR is the best predictor of severe COVID‐19, and the combination of three clinical indicators can further predict severe COVID‐19.
Keywords: clinical characteristics, coronavirus disease 2019, COVID‐19, novel coronavirus pneumonia
Research Highlight
We aim to study the relationship between clinical parameters and severity of COVID‐19 to explore its role in predicting the severity of COVID‐19.
NLR, CRP and platelets can effectively assess the severity of COVID‐19, among which NLR is the best predictor of severe COVID‐19.
1. INTRODUCTION
Since December 2019, a series of patients with pneumonia with unknown causes have been found in Wuhan, Hubei Province, China. Soon after, a novel coronavirus was detected in samples of bronchoalveolar lavage fluid from a patient in Wuhan, which was named “2019 new coronavirus (2019‐nCov)”, presently known as “severe acute respiratory syndrome coronavirus 2 (SARS‐CoV‐2). 1 , 2 Coronavirus disease 2019 (COVID‐19) is a major infectious disease that seriously endangers people's life and health due to its high incidence and high infectivity. About 81% of patients with novel coronavirus infection were mild. However, 14% were severe and 5% were critical. Severe illness often experienced dyspnea and/or hypoxemia after 1 week. Critically ill patients progressed rapidly to acute respiratory distress syndrome, metabolic acidosis, coagulopathy, and septic shock. Patients with severe disease have high mortality and poor prognosis. 3 , 4 As of 2 March, 2020, a total of 80 151 cases of COVID‐19 in China have been confirmed and 2943 patients have died of the disease. It is worth noting that on the same day, there were 49 426 confirmed cases and 2251 deaths of COVID‐19 in Wuhan on that same day. 5 According to data from the Chinese Center for Disease Control and Prevention, as of 11 February, 2020, the case‐fatality rate of COVID‐19 patients was 2.3% and that of critical cases was 49%. 4 A previous study suggested that white blood cell count, neutrophil count, lymphocyte count, D‐dimer, albumin, and procalcitonin were risk factors for intensive care unit (ICU) care in patients with COVID‐19. 6 Therefore, it is crucial to evaluate the possible factors affecting the progression of disease in COVID‐19 patients. We studied the relationship between clinical indicators and severity of COVID‐19 to explore its role in predicting the severity of COVID‐19.
2. METHODS
2.1. Patients and inclusion criteria
This study was approved by the institutional ethics board of Wuhan Forth Hospital (KY 2020‐011‐01) and written informed consent was waived. The clinical data of patients diagnosed with COVID‐19 in Wuhan Forth Hospital from 16 January to 28 February, 2020 were retrospectively analyzed. The selected patients all met the diagnostic criteria of diagnosis and treatment program of novel coronavirus pneumonia (trial sixth edition). The clinical classification was divided into light, ordinary, intensive, and critical types. Light type: no pneumonia on imaging; Ordinary type: fever and respiratory tract symptoms with pneumonia in imaging; Intensive type met any of the following: shortness of breath, respiratory rate more than 30 times/min; resting state, oxygen saturation less than equal to 93%; or partial pressure of arterial oxygen (PaO2)/oxygen concentration (FiO2)≤ 30 mm Hg (1 mm Hg = 0.133 kPa); the critical type was defined as respiratory failure requiring mechanical ventilation, shock, or other organ failure requiring ICU monitoring and treatment. 7 According to the severity of the disease, it was divided into severe group and nonsevere group. The light and ordinary types were classified as the nonsevere group. The intensive and critical types were classified as a severe group.
2.2. Data collection
The general condition of the patients and the results of leukocyte, neutrophils, lymphocytes, neutrophil‐to‐lymphocyte ratio (NLR), hemoglobin, platelets, D‐dimer, erythrocyte sedimentation rate (ESR), C‐reactive protein (CRP), procalcitonin, lactate dehydrogenase (LDH), uric acid, creatinine, albumin, chest computed tomographic (CT) scans on the first test during the period of hospitalization, and real‐time reverse transcriptase polymerase chain reaction results of respiratory viruses were collected from electronic medical records. The diagnosis of COVID‐19 was confirmed by RNA detection of the SARS‐CoV‐2 in the Wuhan Institute of Virology, Chinese Academy of Sciences.
2.3. Statistical analysis
All data were entered twice into a computer using Epidata 3.1 for the double check to ensure accuracy. The counting data were expressed as a proportion, and χ 2 statistic was used to compare between severe group and nonsevere group. For the data of continuous variables, the normality test was first conducted. After the normal distribution test, the only albumin conformed to the normal distribution, the variable was expressed by mean (SD), and t test was used to compare between the two groups. The rest of the continuous variables that did not conform to the normal distribution were represented by the median (interquartile range, IQR), and the rank‐sum test was used for clinical parameters comparison between the two groups. Binary logistic regression (step forward likelihood ratio approach into analysis) was used to perform multifactor analysis and calculate OR values and 95% confidence intervals of the risk factors that were chosen on the basis of likely and relevant confounders after univariate analysis. We depicted the receiver operating characteristic (ROC) curve of statistically significant variables after binary logistic regression analysis and calculate the area under curve (AUC) to evaluate the sensitivity and specificity of each parameter/model in predicting the severity of COVID‐19. All statistical analyses were performed using IBM SPSS statistics version 21.0, and findings were considered statistically significant if P < .05.
3. RESULTS
A total of 443 cases were included in this study, including 220 males and 223 females. The median age was 56.00 years (IQR, 43.25‐66.75). There were 139 cases in the severe group and 304 cases in the nonsevere group. There were statistically significant differences in the distribution of sex, whether patients had heart disease or not between the two groups (P < .05). The differences in age, leukocyte, NLR, neutrophil, lymphocyte, platelet, D‐dimer, CRP, procalcitonin, LDH, creatinine, and albumin on admission between the two groups were statistically significant (P < .05). The differences between the other parameters were not statistically significant (P > .05) (Table 1).
Table 1.
Comparison of baseline data and clinical parameters between severe group and nonsevere group of COVID‐19
| Parameters | Severe group (n = 139) | Non‐severe group (n = 304) | P value |
|---|---|---|---|
| Sex (female) | 57 (41.01%) | 166 (54.61%) | .008 |
| Age (y) | 64.00 (54.00‐73.00) | 58.00 (47.00‐67.00) | <.001 |
| Comorbidities (n, %) | |||
| Hypertension | 45 (32.37%) | 86 (28.29%) | .382 |
| Diabetes | 20 (14.39%) | 43 (14.14%) | .946 |
| Heart diseases | 25 (17.99%) | 19 (6.25%) | <.001 |
| Malignancy | 5 (3.60%) | 6 (1.97%) | .332* |
| Pulmonary disease | 5 (3.60%) | 7 (2.30%) | .529* |
| Leukocyte (109/L) | 6.01 (4.20‐7.80) | 5.03 (4.05‐6.33) | .002 |
| NLR | 4.75 (2.51‐9.42) | 2.38 (1.57‐3.72) | <.001 |
| Neutrophil (109/L) | 4.27 (2.65‐6.24) | 3.07 (2.35‐4.15) | <.001 |
| Lymphocyte (109/L) | 0.87 (0.56‐1.25) | 1.27 (0.96‐1.74) | <.001 |
| Hemoglobin (g/L) | 128.00 (114.00‐141.00) | 127.00 (116.00‐139.00) | .644 |
| Platelet (109/L) | 181.00 (142.00‐244.00) | 227.50 (172.00‐293.25) | <.001 |
| D‐dimer (mg/L) | 0.84 (0.35‐2.76) | 0.51 (0.28‐1.04) | .003 |
| ESR (mm/H) | 26.50 (17.00‐53.00) | 30.00 (16.50‐52.50) | .579 |
| CRP (mg/L) | 43.15 (9.78‐97.27) | 10.05 (2.92‐27.11) | <.001 |
| Procalcitonin (ng/mL) | 0.07 (0.04‐0.24) | 0.03 (0.02‐0.05) | <.001 |
| LDH (U/L) | 277.00 (207.00‐450.00) | 206.00 (179.75‐262.25) | <.001 |
| Uric acid (μmol/L) | 264.00 (205.00‐340.00) | 266.00 (214.00‐325.00) | .529 |
| Creatinine (μmol/L) | 69.70 (60.00‐89.50) | 62.00 (51.90‐76.10) | <.001 |
| Albumin (g/L) | 33.19 ± 5.23 | 35.75 ± 4.31 | <.001 |
| Unilateral involvement of chest CT (n, %) | 9 (6.47%) | 19 (6.25%) | .928 |
Abbreviations: CRP, C‐reactive protein; CT, computed tomography; ESR, erythrocyte sedimentation rate; LDH, lactate dehydrogenase; NLR, neutrophil‐to‐lymphocyte ratio.
About 25% cells had expectation values under 5, thus the Fisher exact test method was used.
As shown in Table 2, parameters with P < .1 in Table 1 were included in the logistic regression model, that is, sex, age, whether patients had heart disease or not, leukocyte, NLR, neutrophil, lymphocyte, platelet, D‐dimer, CRP, procalcitonin, LDH, creatinine, and albumin. And a forward step (likelihood ratio) method was used for binary logistic regression analysis. Results showed that NLR and CRP were independent risk factors for severe COVID‐19, and their OR values were 1.222 and 1.017, respectively. In addition, platelet was an independent protective factor for severe COVID‐19 with an OR value of 0.995.
Table 2.
Binary logistic regression analysis of factors associated with severe COVID‐19
| Parameters | OR | 95%CI | P value |
|---|---|---|---|
| NLR | 1.222 | 1.065‐1.402 | .004 |
| Platelets, 109/L | 0.995 | 0.991‐0.999 | .028 |
| CRP, mg/L | 1.017 | 1.004‐1.030 | .012 |
Abbreviations: CRP, C‐reactive protein; NLR, neutrophil‐to‐lymphocyte ratio; OR, odds ratio.
The ROC curves were drawn for severe COVID‐19 based on the logistic regression analysis model in Table 2. The curves were shown in Figure 1. Since the platelet was a protective factor, all patients’ platelet values were multiplied by ‐1 to make its ROC curve above the reference line. The above parameters were all valuable for predicting the severity of COVID‐19 (P < .05). The AUC of the logistic regression model was 0.774 (95%CI: 0.722‐0.827). The AUC and optimal thresholds of each independent risk or protection factors can be found in Table 3.
Figure 1.
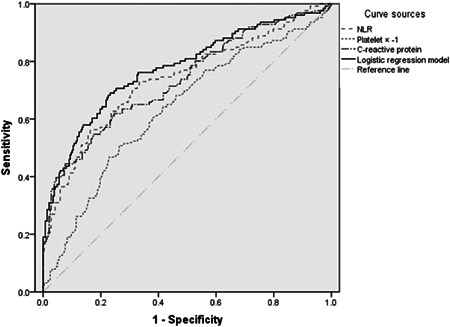
ROC curves of NLR, platelet, CRP, and logistic regression model in patients with severe COVID‐19. CRP, C‐reactive protein; NLR, neutrophil‐to‐lymphocyte ratio; ROC, reactive oxygen curve
Table 3.
The AUC and optimal thresholds of each independent risk or protection factors
| Indicators | AUC | P value | Optimal threshold | Sensitivity | Specificity | Youden index |
|---|---|---|---|---|---|---|
| NLR | 0.737 | <.001 | ≥4.283 | 0.563 | 0.837 | 0.400 |
| Platelet, 109/L | 0.634 | <.001 | ≤177.5 | 0.508 | 0.736 | 0.244 |
| CRP, mg/L | 0.734 | <.001 | ≥38.55 | 0.548 | 0.826 | 0.374 |
| Logistic regression model | 0.774 | <.001 | ≥0.305 | 0.690 | 0.767 | 0.457 |
Abbreviations: AUC, area under curve; CRP, C‐reactive protein; NLR, neutrophil‐to‐lymphocyte ratio.
4. DISCUSSION
There are six previously identified coronaviruses that infect humans, four of which are more common and less pathogenic in humans. The other two are known as SARS‐Cov‐1 and MERS‐Cov, which cause severe respiratory diseases. The mortality of SARS has been reported as more than 10% and MERS at more than 35%. 8 , 9 The SARS‐CoV‐2, known as the seventh human coronavirus, belongs to β coronavirus. The case fatality rate of hospitalized COVID‐19 patients has been reported to be 4.3% to 15%. 6 , 10 , 11 , 12 Therefore, early identification and timely treatment of severe cases are vitally important.
In terms of laboratory tests, the main characteristics of COVID‐19 were normal or decreased total number of white blood cells, decreased lymphocyte count, increased CRP, increased ESR, and increased liver enzymes and myoenzymes in some patients. As a new inflammatory indicator, NLR changes can not only reflect the role of neutrophils in infection but also reflect the changes of lymphocytes in vivo. It has been reported that NLR has some predictive value in the diagnosis of disease and severity in patients with influenza virus and other inflammation‐related diseases. 13 , 14 , 15 , 16 Our results showed that the NLR in the severe group was significantly higher than that in the nonsevere group. The area under the ROC curve of the NLR predicting the severity of COVID‐19 was the largest. The optimal working point was 4.283, and the sensitivity and specificity to predict the severity of COVID‐19 were 56.3% and 83.7%, respectively. Recently, the meta‐analysis performed by Lagunas‐Rangel 17 has shown that the NLR values were found to increase significantly in COVID‐19 patients with severe disease (SMD = 2.404, 95% CI: 0.98‐3.82). Therefore, the detection of NLR levels in COVID‐19 patients was of great value in assessing the severity of their condition.
CRP is a useful inflammatory marker and indicator that plays an important role in host resistance to invading pathogens and inflammation. 18 CRP was highly correlated to the acute lung injury in 2019‐nCoV‐infected patients. 19 Our study showed that CRP in the severe group was significantly higher than that in the nonsevere group, and CRP was an independent risk factor for severe COVID‐19. The optimal working point was 38.55 mg/L. This is consistent with previous research showing that hypoalbuminemia, lymphopenia, and CRP more than equal to 40 mg/L were the predictive factors for pneumonia progression to respiratory failure in MERS‐CoV‐infected patients. 20 Besides, higher CRP has been linked to unfavorable aspects of COVID‐19 diseases, such as cardiac injury, and ARDS development, and death. 21 Therefore, the detection of CRP levels in COVID‐19 patients is of great value in assessing the severity of their condition.
Our study also found that platelet count was lower in the severe group than in the nonsevere group. Binary logistic regression analysis showed platelet count was an independent protective factor for severe COVID‐19. The optimal working point was 177.5 (109/L). This partially matches the results of Georges et al 22 who conducted a multicenter retrospective study showing that severe thrombocytopenia was an independent predictor of mortality for severe community‐acquired pneumonia. But Elmaraghy's study showed that both thrombocytopenia and thrombocytopenia were significantly associated with mortality in patients with community‐acquired pneumonia. 23 Therefore, whether platelets are protective factors for severe COVID‐19 needs to be further verified.
This study has several limitations. First, our study was a single‐center retrospective study, which may affect the generalization of the results due to the limitation of enrolled patients. Second, some patients are still hospitalized among the 443 cases. Therefore, it is difficult to assess risk factors for poor outcomes. Third, the sample size was relatively small, which may have some impact on the statistical results.
In conclusion, NLR, CRP, and platelets can effectively assess the severity of COVID‐19, among which NLR is the best predictor of severe COVID‐19, and the combination of three clinical indicators can further predict severe COVID‐19. To date, there is no specific antiviral drug for COVID‐19, and the case fatality rate is still high. Therefore, clinicians need to carry out a timely and accurate assessment of the disease at an early stage, identify severe patients, and take active treatment measures as soon as possible, so as to reduce the case fatality rate.
CONFLICT OF INTERESTS
The authors declare that there are no conflict of interests.
Shang W, Dong J, Ren Y, et al. The value of clinical parameters in predicting the severity of COVID‐19. J Med Virol. 2020;92:2188–2192. 10.1002/jmv.26031
Weifang Shang, Junwu Dong, and Yali Ren contributed equally to this study.
REFERENCES
- 1. Zhu N, Zhang D, Wang W, et al. A novel coronavirus from patients with pneumonia in China, 2019. N Engl J Med. 2020;382(8):727‐733. 10.1056/NEJMoa2001017 [DOI] [PMC free article] [PubMed] [Google Scholar]
- 2. Wu F, Zhao S, Yu B, et al. A new coronavirus associated with human respiratory disease in China. Nature. 2020;579(7798):265‐269. 10.1038/s41586-020-2008-3 [DOI] [PMC free article] [PubMed] [Google Scholar]
- 3. Sun P, Lu X, Xu C, Sun W, Pan B. Understanding of COVID‐19 based on current evidence. J Med Virol. 2020;92:548‐551. 10.1002/jmv.25722 [DOI] [PMC free article] [PubMed] [Google Scholar]
- 4. Wu Z, McGoogan JM. Characteristics of and important lessons from the coronavirus disease 2019 (COVID‐19) outbreak in China: summary of a report of 72314 cases from the Chinese Center for Disease Control and Prevention. JAMA. 2020;323:1239. 10.1001/jama.2020.2648 [DOI] [PubMed] [Google Scholar]
- 5. National Health Commission of the People's Republic of China . Update on novel coronavirus infected pneumonia situation as of 24:00 on March 20, 2020. http://www.nhc.gov.cn/xcs/yqtb/202003/097e6e91ecb6464ea69fd1a324c9b1b4.shtml
- 6. Huang C, Wang Y, Li X, et al. Clinical features of patients infected with 2019 novel coronavirus in Wuhan, China. Lancet. 2020;395(10223):497‐506. 10.1016/s0140-6736(20)30183-5 [DOI] [PMC free article] [PubMed] [Google Scholar]
- 7.National Health Commission of China. New coronavirus pneumonia prevention and control program (trial sixth edition). http://www.nhc.gov.cn/yzygj/s7653p/202002/8334a8326dd94d329df351d7da8aefc2/files/b218cfeb1bc54639af227f922bf6b817.pdf. Accessed on February 18, 2020.
- 8. Song Z, Xu Y, Bao L, et al. From SARS to MERS, thrusting coronaviruses into the spotlight. Viruses. 2019;11(1):59. 10.3390/v11010059 [DOI] [PMC free article] [PubMed] [Google Scholar]
- 9. Yin Y, Wunderink RG. MERS, SARS and other coronaviruses as causes of pneumonia. Respirology. 2018;23(2):130‐137. 10.1111/resp.13196 [DOI] [PMC free article] [PubMed] [Google Scholar]
- 10. Wang D, Hu B, Hu C, et al. Clinical characteristics of 138 hospitalized patients with 2019 novel coronavirus–infected pneumonia in Wuhan, China. JAMA. 2020;323:1061. 10.1001/jama.2020.1585 [DOI] [PMC free article] [PubMed] [Google Scholar]
- 11. Liu K, Fang YY, Deng Y, et al. Clinical characteristics of novel coronavirus cases in tertiary hospitals in Hubei Province. Chin Med J (Engl). 2020;133:1025‐1031. 10.1097/CM9.0000000000000744 [DOI] [PMC free article] [PubMed] [Google Scholar]
- 12. Chen N, Zhou M, Dong X, et al. Epidemiological and clinical characteristics of 99 cases of 2019 novel coronavirus pneumonia in Wuhan, China: a descriptive study. The Lancet. 2020;395(10223):507‐513. 10.1016/s0140-6736(20)30211-7 [DOI] [PMC free article] [PubMed] [Google Scholar]
- 13. Han Q, Wen X, Wang L, et al. Role of hematological parameters in the diagnosis of influenza virus infection in patients with respiratory tract infection symptoms. J Clin Lab Anal. 2020:e23191. 10.1002/jcla.23191 [DOI] [PMC free article] [PubMed] [Google Scholar]
- 14. Bao X, Zhou G, Xu W, Liu X, Ye Z, Jiang F. Neutrophil‐to‐lymphocyte ratio and platelet‐to‐lymphocyte ratio: novel markers for the diagnosis and prognosis in patients with restenosis following CAS. Biomark Med. 2020;14:271‐282. 10.2217/bmm-2019-0155 [DOI] [PubMed] [Google Scholar]
- 15. Zhang Y, Zou P, Gao H, et al. Neutrophil‐lymphocyte ratio as an early new marker in AIV‐H7N9‐infected patients: a retrospective study. Ther Clin Risk Manag. 2019;15:911‐919. 10.2147/tcrm.s206930 [DOI] [PMC free article] [PubMed] [Google Scholar]
- 16. Tanrıverdi H, Örnek T, Erboy F, et al. Comparison of diagnostic values of procalcitonin, C‐reactive protein and blood neutrophil/lymphocyte ratio levels in predicting bacterial infection in hospitalized patients with acute exacerbations of COPD. Wien Klin Wochenschr. 2015;127(19‐20):756‐763. 10.1007/s00508-014-0690-6 [DOI] [PubMed] [Google Scholar]
- 17. Lagunas‐Rangel FA. Neutrophil‐to‐lymphocyte ratio and lymphocyte‐to‐C‐reactive protein ratio in patients with severe coronavirus disease 2019 (COVID‐19): a meta‐analysis. J Med Virol. 2020. 10.1002/jmv.25819 [DOI] [PMC free article] [PubMed] [Google Scholar]
- 18. Wu Y, Potempa LA, El Kebir D, Filep JG. C‐reactive protein and inflammation: conformational changes affect function. Biol Chem. 2015;396(11):1181‐1197. [DOI] [PubMed] [Google Scholar]
- 19. Liu Y, Yang Y, Zhang C, et al. Clinical and biochemical indexes from 2019‐nCoV infected patients linked to viral loads and lung injury. Science China Life Sci. 2020;63(3):364‐374. 10.1007/s11427-020-1643-8 [DOI] [PMC free article] [PubMed] [Google Scholar]
- 20. Ko JH, Park GE, Lee JY, et al. Predictive factors for pneumonia development and progression to respiratory failure in MERS‐CoV infected patients. J Infect. 2016;73(5):468‐475. 10.1016/j.jinf.2016.08.005 [DOI] [PMC free article] [PubMed] [Google Scholar]
- 21. Terpos E, Ntanasis‐Stathopoulos I, Elalamy I, et al. Hematological findings and complications of COVID‐19. Am J Hematol. 2020. [DOI] [PMC free article] [PubMed] [Google Scholar]
- 22. Georges H, Brogly N, Olive D, Leroy O. Thrombocytosis in patients with severe community‐acquired pneumonia. Chest. 2010;138(5):1279. 10.1378/chest.10-0871 [DOI] [PubMed] [Google Scholar]
- 23. ElMaraghy AA, AbdelFattah EB, Ahmed MS. Platelet count: is it a possible marker for severity and outcome of community acquired pneumonia? Egypt J Chest Dis Tuberc. 2016;65(2):499‐504. 10.1016/j.ejcdt.2015.09.001 [DOI] [Google Scholar]