

Abstract
Although emerging data demonstrated mortality of young COVID‐19 patients, no data have reported the risk factors of mortality for these young patients, and whether obesity is a risk for young COVID‐19 patients remains unknown. We conducted a retrospective study including 13 young patients who died of COVID‐19 and 40 matched survivors. Logistic regression was employed to characterize the risk factors of mortality in young obese COVID‐19 patients. Most of the young deceased COVID‐19 patients were mild cases at the time of admission, but the disease progressed rapidly featured by a higher severity of patchy shadows (100.00% vs 48.70%; P = .006), pleural thickening (61.50% vs 12.80%; P = .012), and mild pericardial effusion (76.90% vs 0.00%; P < .001). Most importantly, the deceased patients manifested higher body mass index (odds ratio [OR] = 1.354; 95% confidence interval [CI] = 1.075‐1.704; P = .010), inflammation‐related index C‐reactive protein (OR = 1.014; 95% CI = 1.003‐1.025; P = .014), cardiac injury biomarker hs‐cTnI (OR = 1.420; 95% CI = 1.112‐1.814; P = .005), and increased coagulation activity biomarker D‐dimer (OR = 418.7; P = .047), as compared with that of survivors. Our data support that obesity could be a risk factor associated with high mortality in young COVID‐19 patients, whereas aggravated inflammatory response, enhanced cardiac injury, and increased coagulation activity are likely to be the mechanisms contributing to the high mortality.
Keywords: cardiac damage, coagulation activity, COVID‐19, inflammatory responses, obesity
1. INTRODUCTION
Since the initial outbreak of the 2019 novel coronavirus (SARS‐CoV‐2), approximately 2.7 million people have been diagnosed with coronavirus disease 2019 (COVID‐19), which caused 190 000 deaths worldwide. 1 , 2 Earlier data suggested that aged subjects, particularly those with comorbidities, are at a higher risk of developing a severe or critical type of COVID‐19 than that of the younger subjects. 3 In contrast, young subjects are considered to only have a mild type of COVID‐19 without hospitalized treatment that is unlikely to cause death. 4 As such, the infected young subjects were usually subjected to more optimistic and less apprehensive treatment. The truth that we observed, however, was unfulfilling.
A 33‐year‐old young obese male patient was diagnosed with COVID‐19 based on the nucleic acid assays and was then arranged by the Outbreak Control Center for hospitalized treatment in Tongji Hospital at the end of January 2020. He had stable vital signs and mild flu‐like symptoms without underlying disease on admission. Moreover, his computed tomography (CT) imaging only manifested slight ground‐glass opacity. In general, we considered this patient to be optimistic during the conversation on his first day of admission. Unexpectedly, the disease progressed so rapidly that he died of respiratory failure within a week of admission, which really surprised us remarkably. To dissect the causative factors relevant to rapid disease progression and death, our team reviewed all of his clinical records. We first noted that he was overweight. This finding brought to our attention for the first time of obesity in young COVID‐19 patients. Indeed, obesity has been suggested to increase the risk of influenza complications, such as cardiovascular disorders along with reduced natural killer cell activity, thereby leading to higher morbidity and mortality following viral infection. 5 , 6 , 7 , 8 , 9 However, whether obesity is a risk for young COVID‐19 patients remains unknown.
As the pandemic progresses, more and more young COVID‐19 patients (20 to 45 years old) were noted necessary for hospitalized treatment. Particularly, the mortality rate for young COVID‐19 patients ranged from 0.19% to 0.44% as reported in China, the United States, and Italy. 2 To dissect the risk factors relevant to the mortality in young COVID‐19 patients, we, thus, conducted a retrospective survey of young COVID‐19 patients admitted in Tongji Hospital and Wuhan Pulmonary Hospital from 7 February to 27 March 2020, which included 13 deceased patients and 40 matched survivors.
2. METHODS
2.1. Patients
From 7 February to 27 March 2020, Tongji Hospital received 3201 COVID‐19 patients, 285 of whom were deceased, whereas 11 of 285 deceased patients were young patients (14 to 45 years old). During the same period, Wuhan Pulmonary Hospital admitted 753 COVID‐19 patients, 55 of whom were deceased, and 2 of 55 deceased patients were young patients. In this retrospective study, we included all 13 young deceased patients and 40 matched young COVID‐19 survivors. The clinical features, laboratory results, CT imaging, and management data were extracted from each patient. The COVID‐19 nucleic acid assays were conducted in Tongji Hospital and Wuhan Pulmonary Hospital. The study was approved by the Human Assurance Committee of Tongji Hospital and Wuhan Pulmonary Hospital.
According to the COVID‐19 Diagnosis and Treatment Protocol, 10 a mild case was defined as moderate clinical symptoms with the absence of typical pneumonia changes on CT scans. A severe case was defined as follows: (a) respiratory distress (RR) ≥ 30 times per minute; (b) oxygen saturation less than or equal to 93% at rest; and (c) PaO2/FiO2 ≤ 300 mm Hg (1 mm Hg = 0.133 kPa). A critical case was defined as follows: (a) respiratory failure requiring mechanical ventilation; (b) occurrence of shock; and (c) functional failure of other organs and ICU care was required.
2.2. Data collection
Epidemiological data including patients' age, sex, body mass index (BMI), clinical symptoms, blood routine results, and CT scans were collected through the standardized data collection tables from the electronic medical records. BMI was calculated using self‐reported height and weight from the National Population Health Survey (NPHS) or Canadian Community Health Survey (CCHS). In general, there is a high correlation between self‐reported and measured height and weight. 11 Overweight and obesity were calculated by BMI definition recommended by the Working Group on Obesity in China (BMI: normal weight, 18.5‐23.9; overweight, 24‐27.9; and obesity, ≥28). 12 In case some of the data were missed from the records or specific clarification was necessary, those data were obtained by directly communicating with the attending doctors and health care providers.
2.3. Statistical analysis
Continuous variables were presented as median and interquartile range (IQR) for skewed distributed data or mean and standard deviation (SD) for normal distributed data. Categorical variables were expressed as number (%). For continuous variables, Student's t test was used for normal distributed data, whereas the Mann‐Whitney U nonparameter test was used for skewed distributed data. Pearson's χ 2 test or Fisher's exact test were applied for categorical variables. Unconditional logistic regression was applied to estimate odds ratios (ORs) and 95% confidence intervals (CIs) for the association between factors and the clinical outcomes of COVID‐19. A two‐sided P < .05 was considered statistically significant. All statistical analyses were performed using the SPSS (22.0) software.
3. RESULTS
Generally, the mortality rate of COVID‐19 patients admitted in Tongji Hospital was 8.9% (285 of 3201), whereas it was only 0.34% in young COVID‐19 patients, which accounted for 3.8% (11 of 285) of all deceased patients. The mortality rate in Wuhan Pulmonary Hospital was 7.3% (55 of 753), but only two young patients died of COVID‐19 (0.26%). Surprisingly, nine deceased young COVID‐19 patients only displayed mild type infection at the time of admission, but died within a week of admission, whereas three cases diagnosed as the severe type and one case as the critical type. Among all admitted patients, 40 young COVID‐19 survivors were statistically matched with those deceased young COVID‐19 patients at an approximate ratio of 4:1 based on age, sex, and disease severity at the time of admission. All demographic data and clinical features of these subjects are summarized in Table 1.
Table 1.
Demographic, clinical, laboratory, and radiographic findings of patients
| Indicators | Total | Alive | Dead | P value | |||
|---|---|---|---|---|---|---|---|
| Characteristics | |||||||
| BMI | N = 43 | 24.38 ± 4.00 | N = 31 | 23.38 ± 3.02 | N = 12 | 27.79 ± 5.18 | .036 a |
| N = 43 | 23.39 (21.62‐26.34) | N = 31 | 23.18 (21.62‐24.59) | N = 12 | 29.32 (28.91‐29.40) | .021 b | |
| Initial symptoms | |||||||
| Fever | N = 53 | 40 (81.6%) | N = 40 | 33 (82.5%) | N = 13 | 10 (76.9%) | .663 c |
| Chill | N = 53 | 1 (2.0%) | N = 40 | 0 (0%) | N = 13 | 2 (15.4%) | .184 c |
| Dry cough | N = 53 | 13 (26.5%) | N = 40 | 8 (20%) | N = 13 | 8 (61.5%) | .043 c |
| Expectoration | N = 53 | 2 (4.1%) | N = 40 | 0 (0%) | N = 13 | 3 (23.1%) | .031 c |
| Fatigue | N = 53 | 2 (4.1%) | N = 40 | 1 (2.5%) | N = 13 | 2 (15.4%) | .337 c |
| Dyspnea | N = 53 | 4 (8.2%) | N = 40 | 0 (0%) | N = 13 | 6 (46.2%) | 5.94 × 10⁻⁴ c |
| Diarrhea | N = 53 | 3 (6.1%) | N = 40 | 2 (5%) | N = 13 | 2 (15.4%) | .464 c |
| Muscle ache | N = 53 | 2 (4.1%) | N = 40 | 1 (2.5%) | N = 13 | 2 (15.4%) | .337 c |
| Chest pain | N = 53 | 0 (0) | N = 40 | 0 (0%) | N = 13 | 0 (0%) | 1.000 c |
| Sore throat | N = 53 | 1 (2.1%) | N = 40 | 1 (2.5%) | N = 13 | 0 (0%) | 1.000 c |
| Vomiting | N = 53 | 1 (2.0%) | N = 40 | 0 (0%) | N = 13 | 2 (15.4%) | .184 c |
| Headache | N = 53 | 0 (0) | N = 40 | 0 (0%) | N = 13 | 0 (0%) | 1.000 c |
| Dizziness | N = 53 | 0 (0) | N = 40 | 0 (0%) | N = 13 | 0 (0%) | 1.000 c |
| Others | N = 53 | 3 (6.1%) | N = 40 | 1 (2.5%) | N = 13 | 3 (23.1%) | .083 c |
| CT findings | N = 52 | N = 39 | N = 13 | ||||
| Ground‐glass opacity | 34 (65.4%) | 24 (61.5%) | 10 (76.9%) | .460 c | |||
| Patchy shadows | 32 (61.5%) | 19 (48.7%) | 13 (100%) | .006 c | |||
| Fibrous stripes | 10 (19.2%) | 10 (25.6%) | 0 (0%) | .172 c | |||
| Pericardial effusion | 10 (19.2%) | 0 (0%) | 10 (76.9%) | .000 c | |||
| Pleural thickening | 13 (25.0%) | 5 (12.8%) | 8 (61.5%) | .012 c | |||
| Lymphadenia | 13 (25.0%) | 3 (7.7%) | 10 (76.9%) | .000 c | |||
| Bilateral pulmonary | 39 (75.0%) | 29 (74.4%) | 10 (76.9%) | .662 c | |||
| Right lung | 19 (36.5%) | 11 (28.2%) | 8 (61.5%) | .051 c | |||
| Left lung | 16 (30.8%) | 7 (17.9%) | 9 (69.2%) | .007 c | |||
| Laboratory examination | |||||||
| Cytokines | |||||||
| IL‐6, pg/mL | N = 34 | 11.27 (2.11‐20.91) | N = 27 | 9.50 (1.79‐18.09) | N = 7 | 22.88 (18.90‐27.76) | .117 b |
| IL‐10, pg/mL | N = 34 | 5.20 (5.00‐13.05) | N = 27 | 5.00 (5.00‐7.90) | N = 7 | 22.00 (14.73‐60.00) | .008 b |
| IL‐8, pg/mL | N = 34 | 9.50 (6.55‐17.35) | N = 27 | 9.40 (6.55‐15.85) | N = 7 | 29.05 (14.35‐56.75) | .118 b |
| TNF‐α, pg/mL | N = 34 | 7.70 (6.10‐10.10) | N = 27 | 7.60 (5.65‐9.00) | N = 7 | 23.00 (9.65‐44.23) | .042 b |
| IL‐1β, pg/mL | N = 34 | 5.00 (5.00‐5.00) | N = 27 | 5.00 (5.00‐5.00) | N = 7 | 5.00 (5.00‐25.88) | .390 b |
| IL‐2R, U/mL | N = 34 | 536.00 (426.00‐825.00) | N = 27 | 529.00 (385.00‐754.50) | N = 7 | 1729.50 (1277.25‐2181.75) | .078 b |
| Inflammatory factors | |||||||
| CRP, mg/L | N = 53 | 25.80 (7.23‐57.73) | N = 40 | 13.05 (4.70‐47.68) | N = 13 | 58.40 (51.45‐141.25) | .002 b |
| Organ damage index | |||||||
| ALT, U/L | N = 53 | 19.50 (11.00‐36.50) | N = 40 | 19.50 (11.00‐32.00) | N = 13 | 19.50 (12.50‐44.50) | .855 b |
| AST, U/L | N = 53 | 27.00 (20.00‐41.00) | N = 40 | 25.00 (20.00‐35.00) | N = 13 | 38.00 (28.75‐64.50) | .069 b |
| Urea, mmol/L | N = 53 | 3.85 (2.80‐5.00) | N = 40 | 3.75 (2.80‐4.50) | N = 13 | 5.50 (2.75‐7.48) | .104 b |
| Estimated glomerular filtration rate | N = 52 | 114.10 (103.80‐120.00) | N = 40 | 114.80 (102.83‐118.85) | N = 12 | 112.70 (107.90‐129.50) | .308 b |
| Total cholesterol, mmol/L | N = 53 | 3.51 (3.01‐4.08) | N = 40 | 3.66 (3.26‐4.15) | N = 13 | 2.97 (2.90‐3.34) | .016 b |
| Triglyceride, mmol/L | N = 31 | 1.56 (0.95‐2.08) | N = 23 | 1.42 (0.89‐1.93) | N = 9 | 1.88 (1.57‐3.52) | .118 b |
| Creatinine, μmol/L | N = 53 | 62.50 (55.25‐76.00) | N = 40 | 63.00 (56.75‐77.50) | N = 13 | 61.50 (51.25‐67.50) | .331 b |
| NT‐proBNP, pg/mL | N = 35 | 41.50 (11.50‐333.50) | N = 23 | 29.00 (8.00‐47.50) | N = 12 | 639.00 (504.00‐1602.00) | 1.55 × 10⁻⁵ b |
| hs‐cTnI, pg/mL | N = 38 | 2.10 (1.90‐4.45) | N = 27 | 1.90 (1.90‐2.30) | N = 11 | 19.45 (12.55‐98.67) | 3.26 × 10⁻⁵ b |
| Creatine kinase, U/L | N = 33 | 78.50 (47.25‐180.25) | N = 25 | 83.00 (52.00‐181.00) | N = 8 | 27.00 (19.00‐120.00) | .278 b |
| Immune globulin | |||||||
| Albumin, g/L | N = 53 | 36.91 ± 5.67 | N = 40 | 38.63 ± 4.59 | N = 13 | 30.02 ± 4.22 | 4.66 × 10⁻⁵ a |
| Blood routine | |||||||
| Lymphocytes count, per μL | N = 53 | 1.11 ± 0.53 | N = 40 | 1.25 ± 0.49 | N = 13 | 0.58 ± 0.35 | 9.63 × 10⁻⁵ a |
| Monocytes count, ×109/L | N = 53 | 0.41 (0.32‐0.53) | N = 40 | 0.39 (0.31‐0.51) | N = 13 | 0.51 (0.37‐0.60) | .403 b |
| Neutrophils count, ×109/L | N = 53 | 2.98 (1.95‐5.58) | N = 40 | 2.63 (1.98‐4.19) | N = 13 | 5.58 (1.76‐5.87) | .291 b |
| Eosinophils count, ×109/L | N = 53 | 0.01 (0‐0.03) | N = 40 | 0.01 (0‐0.05) | N = 13 | 0 | .022 b |
| N = 53 | 0.035 ± 0.092 | N = 40 | 0.042 ± 0.102 | N = 13 | 0.004 ± 0.010 | .024 a | |
| Platelets count, ×109/L | N = 53 | 165.50 (138.00‐213.00) | N = 40 | 170.00 (144.75‐215.50) | N = 13 | 126 (33.50‐168.75) | .055 b |
| Coagulation | |||||||
| APTT, s | N = 42 | 40.21 ± 5.06 | N = 32 | 40.25 ± 4.65 | N = 10 | 39.99 ± 7.12 | .927 a |
| PT, s | N = 53 | 13.75 (13.20‐14.68) | N = 40 | 13.60 (13.08‐14.43) | N = 13 | 14.50 (14.15‐16.20) | .006 b |
| D‐dimer, μg/mL | N = 51 | 0.47 (0.36‐1.09) | N = 40 | 0.44 (0.31‐0.57) | N = 11 | 2.42 (1.55‐5.59) | 1.89 × 10⁻⁵ b |
| Fibrinogen, g/L | N = 42 | 4.15 ± 1.42 | N = 32 | 4.68 ± 1.19 | N = 10 | 3.77 ± 2.15 | .316 a |
Note: Continuous variables were described as median and IQR or mean and SD. Categorical variables were described as number (%).
Abbreviations: ALT, alanine aminotransferase; APTT, activated partial thromboplastin time; AST, aspartate aminotransferase; BMI, body mass index; BNP, brain natriuretic peptide; CRP, C‐reactive protein; hs‐cTnI, hypersensitive cardiac troponin; IgA, immunoglobulin A; IgG, immunoglobulin G; IgM, immunoglobulin M; IL‐6, interleukin 6; IL‐10, interleukin 10; IL‐8, interleukin 8; IL‐1β, interleukin 1β; IL‐2R, interleukin 2 receptor; IQR, interquartile range; PT, plasma prothrombin time; SD, standard deviation; TNF, tumor necrosis factor.
Calculated by Student's t test.
Calculated by the Wilcoxon sum‐rank test.
Calculated by Fisher's exact test.
Fever was the predominant symptom both in the deceased young COVID‐19 patients (76.90%) and survived counterparts (82.50%). Similarly, the comparison of other symptoms between the two groups failed to detect a significant difference such as chill (15.40% vs 0.00%), fatigue (15.40% vs 2.50%), diarrhea (15.40% vs 5.00%), muscle ache (15.40% vs 2.50%), sore throat (0.00% vs 2.50%), and vomiting (15.40% vs 0.00%). However, a higher proportion of these deceased young COVID‐19 patients displayed dry cough (61.50% vs 20.00%; P = .043), expectoration (23.10% vs 0.00%; P = .031), dyspnea (46.20% vs 0.00%; P < .001), as compared with those of survivors (Table 1).
The typical CT images derived from either deceased young COVID‐19 patients or survivors were characterized by the ground‐glass opacity (76.90% vs 61.50%). Remarkably, these deceased young COVID‐19 patients were featured by a higher severity of patchy shadows (100.00% vs 48.70%; P = .006), pleural thickening (61.50% vs 12.80%; P = .012), mild pericardial effusion (76.90% vs 0.00%; P < .001), and lymphadenia (76.90% vs 7.70%; P < .001), as compared with the young counterparts. Further analysis of the lesion sites revealed that these deceased young COVID‐19 patients were more likely to exhibit lesions in the left lung (69.20% vs 17.90%; P = .007) (Table 1).
To characterize the mechanisms that predispose young obese COVID‐19 patients to death, we compared laboratory results between the two groups. The deceased young COVID‐19 patients displayed comparable neutrophils as their counterparts (5.58 × 10⁹ vs 2.63 × 10⁹/L), and similarly for the counts of monocytes and platelets, the level of creatine kinase, renal function, and liver function. In sharp contrast, these deceased young COVID‐19 patients displayed a significantly lower level of lymphocytes (0.58 ± 0.35 × 10⁹ vs 1.25 ± 0.49 × 10⁹/L; P < .001), eosinophils (0.00 × 10⁹ vs 0.01 × 10⁹/L; P = .022), total cholesterol/albumin (2.97 vs 3.66 mmol/L; P = .016), albumin (30.02 ± 4.22 vs 38.63 ± 4.59 g/L; P < .001), but significantly higher level of BMI (29.32 vs 23.18; P = .021), IL‐10 (22.00 vs 5.00 pg/mL; P = .008), TNF‐α (23.00 vs 7.60 pg/mL; P = .042), CRP (58.40 vs 13.05 mg/mL; P = .002), D‐dimer (2.42 vs 0.44 µg/mL; P < .001), PT (14.50 vs 13.60 seconds; P = .006), NT‐proBNP (639.00 vs 29.00 pg/mL; P < .001), and hs‐cTnI (19.45 vs 1.90 pg/mL; P < .001) (Table 1).
Logistic regression models were then constructed to establish the correlation between risk factors and clinical outcomes in young COVID‐19 patients (Figure 1). Remarkably, BMI seemed to be the factor predisposing young COVID‐19 patients to the risk of mortality (OR = 1.354; 95% CI = 1.075‐1.704; P = .010). Other factors relevant to obesity are also highly correlated with mortality, such as hs‐cTnI (a marker for cardiac injury; OR = 1.420; 95% CI = 1.112‐1.814; P = .005), NT‐proBNP (OR = 147.5; P = .008), and coagulation activity (D‐dimer; OR = 418.7; P = .047) (Figure 1). In contrast, albumin (OR = 0.644; 95% CI = 0.492‐0.843; P = .001), eosinophils count (OR = 0.167; 95% CI = 0.031‐0.889; P = .036), and lymphocytes count (OR = 1.001; 95% CI = 1.001‐1.002; P = .024) were negatively associated with the poor outcomes of COVID‐19 (Figure 1). Collectively, these findings suggest that obesity could be a risk factor contributing to high mortality in young COVID‐19 patients. In addition, we interestingly observed that ACE2 is widely expressed in adipocytes by the analyses of single‐cell sequencing data (Figure S1).
Figure 1.
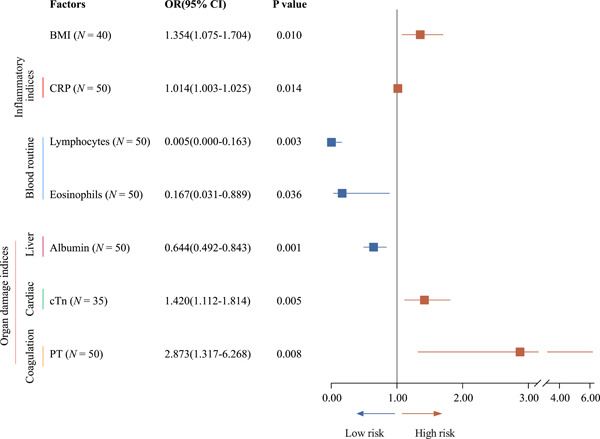
Logistic regression models were constructed to establish the correlation between risk factors and clinical outcomes in young COVID‐19 patients. BMI, body mass index; CI, confidence interval; CRP, C‐reactive protein; cTN, cardiac troponin; OR, odds ratio; PT, plasma prothrombin time
4. DISCUSSION
In this retrospective study, we compared the clinical features between the deceased young COVID‐19 patients and their survival counterparts in Tongji Hospital and Wuhan Pulmonary Hospital from 7 February to 27 March 2020 for the absence of pre‐existing diseases. A total of 53 young COVID‐19 patients were included, 13 of whom died from COVID‐19, whereas the rest of them survived. Among these deceased patients, nine cases were mild type, three cases with severe type, and one case of critical type in terms of disease severity at the time of admission, but all patients died of COVID‐19 within a week of admission. Remarkably, obesity was characterized as the critical factor contributing to the death of these patients, as evidenced by the fact that the BMI of the young deceased patients was significantly higher than that of the survivors. Previous studies have revealed that, during the 2009 H1N1 influenza pandemic, 13 , 14 , 15 , 16 obesity was epidemiologically associated with an increased risk of the disease. Furthermore, obese individuals had a greater risk of hospitalization and death due to H1N1 than individuals with normal weight. 17 Notably, the prevalence of pneumonia by COVID‐19 (53%) is higher than that of H1N1 influenza (11%) 18 ; therefore, the risk of COVID‐19 patients with obesity should not be underestimated. Moreover, according to the data analysis of single‐cell sequencing, the expression of SARS‐CoV‐2 receptor ACE2 in fat cells is found to be high, which supports the assumption that obesity may be a risk factor for the poor prognosis of young COVID‐19 patients.
Despite the fact that the deceased COVID‐19 patients (77.80%) and the survivors (82.50%) shared similar primary symptoms such as fever; the deceased patients, however, were more likely to be mostly presented with cough, sputum, and dyspnea. Ground‐glass–like opacity was visible in the CT scans in both the groups, but the severity in deceased patients was significantly higher. This discrepancy was mainly reflected by the increase in inflammation and enlarged lymph nodes. More significantly, pericardial effusion occurred in 7 out of 13 patients (77.80%), and laboratory results further illustrated these phenomena.
The significant abnormality of the laboratory results secondary to obesity in the young deceased patients was the expression of inflammatory factors. Specifically, the levels of IL‐10, TNF‐α, and CRP in the young deceased patients were much higher than those of the survivors, which logically explained the increase in consolidation and enlarged lymph nodes in CT scans. 19 Moreover, both hs‐cTnI and BNP, indicators of myocardial damage, 20 were much higher than those of young survivors. Furthermore, D‐dimer, an indicator of secondary fibrinolysis, was also significantly increased, suggesting that the patients had abnormal coagulation and fibrinolysis such as disseminated intravascular coagulation, pulmonary embolism, and so on, 20 which might be the reason of pericardial effusion noticed in the CT images. Peng and his colleagues demonstrated that the D‐Dimer of survivors remained within the normal range for 13 days, whereas the level of D‐dimer of deceased patients continued to rise and exceeded the normal level within 7 to 9 days. 21 Similarly, Cao and his colleagues revealed that a significant increase in D‐Dimer is one of the high‐risk factors for higher mortality in COVID‐19 patients. 22 Therefore, it is of great importance to control and treat microcirculation disorders as soon as possible so as to reduce the risk.
In addition, the number of lymphocytes and eosinophils in the deceased young COVID‐19 patients was significantly lower. Previous studies suggested that lymphocytes could be directly infected by the COVID‐19 virus and are consumed greatly during the antiviral process. 23 However, the underlying mechanism of reduced eosinophils in COVID‐19 patients is currently unknown. There is evidence that eosinophils act as innate immune cells and are able to efficiently eliminate respiratory syncytial virus, 24 whereas our studies revealed that SARS‐CoV‐2 could also directly infect eosinophils (unpublished data). Therefore, it would be logical to assume that the reduction of eosinophils could also be the exhaustion caused by the infection of SARS‐CoV‐2.
A logistic regression model was adopted to identify the factors for addressing the mechanisms underlying obesity in predisposing young COVID‐19 patients to death. Through which, the inflammation‐related index CRP, cardiac damage, and increased coagulation activity are characterized to be significantly associated with the adverse clinical outcomes in young COVID‐19 patients with abnormal BMI. Moreover, the decrease of lymphocytes and eosinophils or total globulin levels is also correlated with the poor prognosis in these COVID‐19 patients. One major limitation of our study is the limited number of patients included in the study. Therefore, the cardiac insufficiency index NT‐proBNP (OR = 147.5; P = .008) and the increase of thrombus index D‐dimer (OR = 418.7; P = .047) observed in the deceased COVID‐19 patients might be affected by the sample size. It should be warranted to further validate the data in larger samples in the future.
In summary, our retrospective study included 13 young patients who died from COVID‐19 and 40 matched controls. Obesity is characterized to be a high risk predisposing young patients to death, which involves aggravated inflammatory responses, cardiac damage, and increased coagulation activity.
CONFLICT OF INTERESTS
The authors declare that there are no conflict of interests.
Supporting information
Supporting information
Zhang F, Xiong Y, Wei Y, et al. Obesity predisposes to the risk of higher mortality in young COVID‐19 patients. J Med Virol. 2020;92:2536–2542. 10.1002/jmv.26039
Contributor Information
Feng Wang, Email: fengwang@tjh.tjmu.edu.cn.
Gang Li, Email: ligang@tjh.tjmu.edu.cn.
Kui Liu, Email: 15926325345@163.com.
Ronghui Du, Email: bluesearh006@sina.com.
Cong‐Yi Wang, Email: wangcy@tjh.tjmu.edu.cn.
Wenzhen Zhu, Email: yanqiuw01@163.com.
REFERENCES
- 1. Huang C, Wang Y, Li X, et al. Clinical features of patients infected with 2019 novel coronavirus in Wuhan, China. Lancet. 2020;395:497‐506. 10.1016/S0140-6736(20)30183-5 [DOI] [PMC free article] [PubMed] [Google Scholar]
- 2.Johns Hopkins University. Coronavirus COVID‐19 Global Cases by the Center for Systems Science and Engineering (CSSE) at Johns Hopkins University (JHU). https://coronavirus.jhu.edu/map.html. Accessed 26 April 2020.
- 3. Verity R, Okell LC, Dorigatti I, et al. Estimates of the severity of coronavirus disease 2019: a model‐based analysis. Lancet Infect Dis. 2020;S1473‐3099(20):30243‐7. [DOI] [PMC free article] [PubMed] [Google Scholar]
- 4. Novel Coronavirus Pneumonia Emergency Response Epidemiology Team . The epidemiological characteristics of an outbreak of 2019 novel coronavirus diseases (COVID‐19) in China [Chinese]. Chin Cent Dis Control Prev Wkly. 2020;41:145‐151. [Google Scholar]
- 5. Napolitano LM, Park PK, Sihler KC, et al. Intensive‐care patients with severe novel influenza A (H1N1) virus infection—Michigan, June 2009. Morb Mortal Wkly Rep. 2009;58:749‐752. [PubMed] [Google Scholar]
- 6. Smith AG, Sheridan PA, Harp JB, Beck MA. Diet‐induced obese mice have increased mortality and altered immune responses when infected with influenza virus. J Nutr. 2007;137:1236‐1243. [DOI] [PubMed] [Google Scholar]
- 7. Guh DP, Zhang W, Bansback N, Amarsi Z, Birmingham CL, Anis AH. The incidence of co‐morbidities related to obesity and overweight: a systematic review and meta‐analysis. BMC Public Health. 2009;9:88. [DOI] [PMC free article] [PubMed] [Google Scholar]
- 8. Murugan A, Sharma G. Obesity and respiratory diseases. Chron Respir Dis. 2008;5:233‐242. [DOI] [PubMed] [Google Scholar]
- 9. Poulain M, Doucet M, Major GC. The effect of obesity on chronic respiratory diseases: pathophysiology and therapeutic strategies. CMAJ. 2006;174:1293‐1299. [DOI] [PMC free article] [PubMed] [Google Scholar]
- 10. Notice on Issuing a New Coronavirus Infected Pneumonia Diagnosis and Treatment Plan (Trial Version 5). http://www.gov.cn/zhengce/zhengceku/2020-02/05/content_5474791.htm. Accessed 26 April 2020.
- 11. Nawaz H, Chan W, Abdulrahman M, Larson D, Katz DL. Self‐reported weight and height: implications for obesity research. Am J Prev Med. 2001;20:294‐298. [DOI] [PubMed] [Google Scholar]
- 12. Li X, Xu J, Yao H, Guo Y, Chen M, Lu W. Obesity and overweight prevalence and its association with undiagnosed hypertension in Shanghai population, China: a cross‐sectional population‐based survey. Front Med. 2012;6(3):322‐328. [DOI] [PubMed] [Google Scholar]
- 13. Morgan OW, Bramley A, Fowlkes A, et al. Morbid obesity as a risk factor for hospitalization and death due to 2009 pandemic influenza A (H1N1) disease. PLOS One. 2010;5:e9694. [DOI] [PMC free article] [PubMed] [Google Scholar]
- 14. Jain S, Kamimoto L, Bramley AM, et al. Hospitalized patients with 2009 H1N1 influenza in the United States. N Engl J Med. 2009;361:1935‐1944. [DOI] [PubMed] [Google Scholar]
- 15. Kumar A, Zarychanski R, Canadian Critical Care Trials Group H1N1 Collaborative, et al. Critically ill patients with 2009 influenza A (H1N1) infection in Canada. JAMA. 2009;302:1872‐1879. [DOI] [PubMed] [Google Scholar]
- 16. Louie JK, Acosta M, Winter K, et al. Factors associated with death or hospitalization due to pandemic 2009 influenza A (H1N1) infection in California. JAMA. 2009;302:1896‐1902. [DOI] [PubMed] [Google Scholar]
- 17. Van Kerkhove MD, Vandemaele KAH, Shinde V, et al. Risk factors for severe outcomes following 2009 influenza A (H1N1) infection: a global pooled analysis. PLOS Med. 2011;8:e1001053. [DOI] [PMC free article] [PubMed] [Google Scholar]
- 18. Luan RS, Wang X, Sun X, et al. Epidemiology, treatment, and epidemic prevention and control of the coronavirus disease 2019: a review. Sichuan Da Xue Xue Bao Yi Xue Ban. 2020;51(2):131‐138. [DOI] [PubMed] [Google Scholar]
- 19. Taraz M, Khatami MR, Gharekhani A, Abdollahi A, Khalili H, Dashti‐Khavidaki S. Relationship between a pro‐ and anti‐inflammatory cytokine imbalance and depression in haemodialysis patients. Eur Cytokine Netw. 2013;23(4):179‐186. [DOI] [PubMed] [Google Scholar]
- 20. Farbod S, Elham K, Lutz F, et al. Biomarker changes after strenuous exercise can mimic pulmonary embolism and cardiac injury—a metaanalysis of 45 studies. Clin Chem. 2015;61:1246‐1255. [DOI] [PubMed] [Google Scholar]
- 21. Adema E, Gebert U. Pooled patient samples as reference material for D‐Dimer. Thromb Res. 1995;80(1):85‐88. [DOI] [PubMed] [Google Scholar]
- 22. Zhou F, Yu T, Du R, et al. Clinical course and risk factors for mortality of adult inpatients with COVID‐19 in Wuhan, China: a retrospective cohort study. Lancet. 2020;395:1054‐1062. [DOI] [PMC free article] [PubMed] [Google Scholar]
- 23. Welsh RM, Yang H, Bukowski JF, et al. The role of interferon in the regulation of virus infections by cytotoxic lymphocytes. Bioessays. 1988;8(1):10‐13. [DOI] [PubMed] [Google Scholar]
- 24. Phipps S, Lam CE, Mahalingam S, et al. Eosinophils contribute to innate antiviral immunity and promote clearance of respiratory syncytial virus. Blood. 2007;110(5):1578‐1586. [DOI] [PubMed] [Google Scholar]
- 25.Liu W, Wei Y, Li G, et al. Analysis of 2019 novel coronavirus infection and clinical characteristics of outpatients: an epidemiological study from a fever clinic in Wuhan, China. [DOI] [PMC free article] [PubMed]
Associated Data
This section collects any data citations, data availability statements, or supplementary materials included in this article.
Supplementary Materials
Supporting information