

Abstract
Although the number of SARS‐CoV‐2 infections has been rising amid the current pandemic of COVID‐19, the low infection rate of SARS‐CoV‐2 in children has been low. By examining the clinical data available in the public domain, the present work clarifies the clinical presentations in children with COVID‐19 in China. Statistical significance tests and adjusted odds ratios estimation were performed on the children (age below 18) and adults (age 18 or above) cohorts in China. SARS‐CoV and SARS‐CoV‐2 shared similar clinical features. Lower respiratory tract infection was less prominent in children as evidenced by the relatively low prevalence in chest pain/discomfort and dyspnea. Similar to SARS, younger children had a less aggressive clinical course, compared with adolescents. While fewer symptoms were observed in children compared to adults, there is not yet sufficient evidence to conclude shorter hospital stay in children.
Keywords: clinical characteristics, COVID‐19, epidemiology, SARS‐CoV, SARS‐CoV‐2
1. BACKGROUND
In December 2019, a number of viral pneumonia was reported in China. It was later named by the WHO as COVID‐19 and the causative agent was named as SARS‐CoV‐2. The first case of COVID‐19 was reported in Hubei province, China, about 1000 km north of Guangdong province, the origin of SARS. Although geographical relevance may not play a role in the evolution of the virus, it has been hypothesized that SARS‐CoV and SARS‐CoV‐2 share similar pathogenesis and epidemiology due to genetic similarity between the two. 1 , 2 For instance, fever was observed in about 99% of patients infected with SARS‐CoV 3 and SARS‐CoV‐2. 4
Like SARS‐CoV, SARS‐CoV‐2 is one of the seven human coronaviruses, a group of viruses of Alphacoronavirus and Betacoronavirus genera. While it is associated with higher mortality compared with the common cold‐related strains NL63, OC43, HKU1, and 229E as well as SARS‐CoV, 5 it also caused the largest outbreak of human coronavirus up to date, more prevalent than SARS‐CoV. Consequently, it has been suggested that the basic reproductive number (R0) of SARS‐CoV‐2 was higher compared to SARS‐CoV. 6
Partly because of the lack of available clinical data, clinical features of SARS‐CoV‐2 infections in children remain little known. For instance, it is not clear if they are more susceptible to SARS‐CoV‐2 and if the clinical presentation differs in children compared with adults. 7 Against this background, the present study aims to clarify the clinical features of COVID‐19 in children.
2. METHODS
As a comparative study, both adults and children were considered. A child was defined as a patient of age below 18. As of 17 April 2020, there are still no confirmed sources regarding deaths in pediatric patients with COVID‐19 in China but the United States, the United Kingdom, and the Philippines. Moreover, it was suggested that advanced age was associated with deaths. 8 To reduce the systematic bias driven by the difference in the clinical features between surviving and deceased adult patients, the present study considered discharged patients with COVID‐19.
As most of the cases were reported by the media rather than by the local health authorities in China, a few searches were performed on Google between 13 February 2020 and 17 April 2020 with search terms “pneumonia” AND “novel coronavirus” AND “age” AND “discharge” in Chinese.
The following data were abstracted: (a) travel history to Hubei, (b) gender, (c) age, (d) time from symptom onset to hospital admission, (e) time from hospital admission to discharge, and (f) symptoms on admission.
An individual case was included if all following inclusion criteria were met: (a) the patient was infected with SARS‐CoV‐2, (b) the exact age of the patient was stated, (c) the date of discharge was stated, and (d) symptoms on admission were stated. There was no language restriction.
All statistical tests and estimation were performed on the abstracted data by R software. To investigate any significant difference in the central tendency measure between children and adults, the Student t tests and the Mann‐Whitney tests were performed on interval data, such as time from hospital admission to discharge, whereas z‐tests were performed on nominal data, such as symptoms on admission. To take into account possible confounding relationships, adjusted odds ratio (OR) were estimated using logistic regression with the stepwise regression procedure for independent variable selection. 9
3. RESULTS
A total of 451 patients in 22 provinces, municipalities, and autonomous regions from 122 sources were included for study. Data granularity varied greatly among provinces. For example, symptoms were commonly reported in Shanghai whereas they were usually disregarded in Hubei.
Table 1 shows the summary statistics about the two groups. The minimum and maximum age of the patients included in the study were 9 hours and 96 years, respectively. Children accounted for 9.5% (95% CI, 7.0‐12.6) of all patients. Figure 1 (left panel) graphically illustrates the cumulative relative frequency of the age of patients in this study as well as the general Chinese population. 10 The difference in the cumulative relative frequency between the two groups widened until the group “Age 29 or below” (gray solid line). The difference started to narrow after, suggesting a more prominent infection of SARS‐CoV‐2 in patients of age above 29.
Table 1.
Patients’ characteristics and symptoms on admission
| Age below 18 (n) | Age 18 or above (n) | P‐value* | Adjusted OR (children/adult) | ||
|---|---|---|---|---|---|
| Age (min, max; y) | 9 h,17 (43) | 18,96 (408) | |||
| Male | 51.3% (20/39) | 53.1% (215/405) | .962 | ||
| Travel history to Hubei | 45.0% (18/40) | 56.0% (216/386) | .246 | ||
| Median time from symptom onset to admission a , d | 1.0 (16) | 3.0 (79) | .248 | ||
| Median time from admission to discharge a , d | 16.0 (27) | 15.0 (131) | .710 | ||
| Number of symptoms a | Median | 1.0 (41) | 1.0 (385) | .164 | 0.51 (0.27,0.97) |
| Mean | 1.3(41) | 1.5(385) | .039 | ||
| Abdominal pain/discomfort | 0.0% (0/40) | 0.8% (3/385) | 1.000 | ||
| Anorexia | 0.0% (0/40) | 0.5% (2/385) | 1.000 | ||
| Chest pain/discomfort | 2.5% (1/40) | 3.6% (14/387) | 1.000 | ||
| Chill | 0.0% (0/40) | 3.9% (15/388) | .415 | ||
| Cough | 35.7% (15/42) | 41.2% (164/398) | .600 | ||
| Diarrhea | 5.0% (2/40) | 1.3% (5/386) | .271 | ||
| Dizziness | 0.0% (0/40) | 1.3% (5/386) | 1.000 | ||
| Dyspnea | 2.5% (1/40) | 3.9% (15/387) | 1.000 | ||
| Fever | 67.4% (29/43) | 82.9% (334/403) | .023 | 0.50 (0.24,1.05) | |
| Headache | 0.0% (0/40) | 2.8% (11/386) | .577 | ||
| Lethargy | 2.5% (1/40) | 9.9% (39/392) | .207 | ||
| Myalgia | 2.4% (1/41) | 3.3% (13/390) | 1.000 | ||
| Nasal congestion/rhinorrhoea | 9.8% (4/41) | 1.0% (4/385) | .001 | 16.44 (3.15,85.76) | |
| Sore throat | 7.3% (3/41) | 3.9% (15/385) | .531 | ||
| Vomiting/nausea | 5.0% (2/40) | 1.0% (4/387) | .186 |
Abbreviation: OR, odds ratio.
Data not normally distributed.
Rounded to 3 decimal places.
Figure 1.
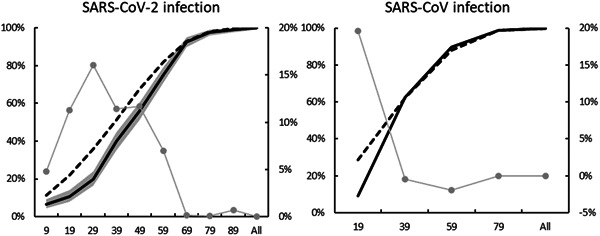
Cumulative relative frequency of age in (left panel) SARS‐CoV‐2: Patients in the present work with 95% CI (solid black line and shaded in gray), the Chinese population (dash line), and the difference between the two (solid gray line, RHS) (right panel), and SARS‐CoV: 5256 patients in Feng et al 11 the Chinese population (dash line), and the difference between the two (solid gray line, RHS). CI, confidence interval
There was no significant difference in the proportion of patients with travel history to Hubei between the children and the adult group. Similarly, there was no significant difference in the male proportion between the two groups. Given similar median time from symptom onset to admission between children and adults, the insignificant difference in the median time from symptom onset to admission suggested similar length of clinical course. Time from symptom onset to admission and time from admission to discharge were excluded by the stepwise regression procedure, suggestive of a possible correlation between the two variables.
A significant difference in the number of symptoms was also observed. Both the Student t test and Mann‐Whitney test concluded fewer symptoms in children. The fever remained the most commonly seen symptom followed by cough but was not significant between the two groups. Nasal congestion/rhinorrhoea was observed in nearly 10% of all children and was significantly more prominent than in adults. After taking into account possible confounding relationships, the 95% CI of the adjusted ORs suggested that nasal congestion/rhinorrhea was more commonly seen in children whereas cough was less prominent. However, no significant difference was observed in other symptoms. Although contradicting results were observed in the difference in the median and the mean of the number of symptoms, the 95% CI of the adjusted OR showed that children did have few symptoms than adults did.
4. DISCUSSION
The present study clarifies the clinical characteristics of children with COVID‐19 using the clinical data reported by the media in China. A total of 451 patients including 43 patients of age below 18 were included in the study.
The data showed that patients of age below 30 were less susceptible to SARS‐CoV‐2 infection, as suggested by Figure 1 (left panel). This was slightly different from the case of SARS‐CoV where children of age below 18 were less susceptible. Figure 1 (right panel) was created using the data reported in a study that considered more than 5000 Chinese patients infected with SARS‐CoV between November 2002 and May 2003. 11 The figure graphically illustrates the cumulative relative frequency of age. SARS‐CoV infection was less prominent in patients of age 19 or below, as suggested by the difference in cumulative relative frequency (solid gray line) between the studied cohort (solid black line) and the Chinese population 12 (dashed line). With SARS‐CoV infection more prominent in patients of age above 19, the difference in cumulative relative frequency disappeared rapidly.
The shorter clinical course was observed in children with SARS, as evidenced by the similar average time from symptom onset to admission yet different average time from admission to discharge between age groups. The average time from symptom onset to admission was similar between different age groups, 4 days for patients age below 20 and between 3.1 and 4 days for other Chinese patients. The average time from admission to discharge for patients of age below 20 and other patients were 24.9 days and 26.5 to 30.9 days, respectively. 11 In contrast, our results failed to reach a similar conclusion in COVID‐19. No significant difference was found in the median time from symptom onset to admission and from admission to discharge.
However, SARS‐CoV and SARS‐CoV‐2 infection in children might be similar in other aspects. For instance, upper respiratory tract infection was more commonly seen in children with SARS, as evidenced by the absence of chest radiograph abnormalities. 13 Table 2 shows the comparison of clinical features between the two diseases in children from different studies. 14 , 15 , 16 , 17 , 18 , 19 , 20 , 21 While fever and cough remained the most prominent symptoms, relatively low prevalence in chest pain/discomfort, and dyspnea was observed in both diseases, suggestive of less common lower respiratory tract infection in children. In addition, patients with nasal congestion/rhinorrhoea were 16 times more likely to be children while patients with cough were two times more likely to be adults, as shown in Table 1.
Table 2.
Comparison of clinical features between SARS‐CoV and SARS‐CoV‐2 in children of age below 18, unless stated otherwise
| SARS‐CoV | SARS‐CoV‐2 | ||||||||
|---|---|---|---|---|---|---|---|---|---|
| Leung and Chiu 14 | Li et al 15 | Babyn et al 16 | Present study | Zhu et al 17 | Du et al 18 | Lu et al 19 (age below 16) | Shen et al 20 (age below 14) | Tan et al 21 (age below 13) | |
| Infection | |||||||||
| Sample size | 64 | 47 | 62 | 43 | 10 | 14 | 171 | 9 | 10 |
| Median (mean) age, years | 11.7 (12) | 13.6 (N/A) | N/A (6.8) | 4.0 (5.7) | 9.5 (9.2) | 6.2 (N/A) | 6.7 (N/A) | 8 (7.6) | 8.8 (7.6) |
| Male to female ratio | 29:35 | 26:21 | 30:32 | 20:19 b | 5:5 | 6:8 | 104:67 | 3:6 | 3:7 |
| Location | Hong Kong | Hong Kong | Toronto, Singapore, Hong Kong | China | Jiangsu, China | Shandong, China | Wuhan, China | Hunan, China | Hunan, China |
| Symptom, % | |||||||||
| Abdominal pain/discomfort | 6.3 | 1.3 | N/A | 0.0 | N/A | 0.0 | N/A | 0.0 | 10.0 |
| Anorexia | 23.4 | 21.8 | 0.0 | 0.0 | N/A | 0.0 | N/A | 0.0 | N/A |
| Chest pain/discomfort | 1.6 | 0.0 | 0.0 | 2.5 | N/A | 0.0 | N/A | 0.0 | N/A |
| Chill | 32.8 | 40.0 | 14.5 | 0.0 | N/A | N/A | N/A | 0.0 | N/A |
| Cough | 56.3 | 56.4 | 62.9 | 35.7 | 30.0 | 21.4 c | 48.5 | 11.1 | 30.0 |
| Diarrhea | 17.2 | 23.6 | 9.7 a | 5.0 | 0.0 | 0.0 | 8.8 | 22.2 | N/A |
| Dizziness | 18.8 | 18.2 | 0.0 | 0.0 | N/A | 0.0 | N/A | 0.0 | N/A |
| Dyspnea | 9.4 | 1.3 | 0.0 | 2.5 | 0.0 | 0.0 | N/A | 0.0 | N/A |
| Fever | 96.9 | 98.0 | 100.0 | 67.4 | 40.0 | 35.7 | 41.5 | 44.4 | 30.0 |
| Headache | 28.1 | 0.0 | 11.3 | 0.0 | 20.0 | 7.1 | N/A | 0.0 | N/A |
| Lethargy | 4.7 | 0.0 | 6.5 | 2.5 | N/A | 7.1 | 7.6 | 0.0 | N/A |
| Myalgia | 28.1 | 29.1 | 17.7 | 2.4 | N/A | 7.1 | N/A | 0.0 | N/A |
| Nasal congestion/rhinorrhoea | 40.6 | 31.0 | 22.6 | 9.8 | N/A | N/A | 5.3/7.6 | 0.0 | N/A |
| Sore throat | 10.9 | 11.0 | 9.7 | 7.3 | 0.0 | N/A | N/A | 11.1 | N/A |
| Vomiting/nausea | 20.3 | 12.7 | 9.7 a | 5.0 | 0.0 | 0.0 | 6.4 d | 0.0 | 10.0 |
Gastrointestinal symptoms.
Gender of four patients not known.
Dry cough.
Vomiting only.
It is also important to note that nonspecific symptoms such as anorexia, dizziness, abdominal pain/discomfort, and headache were observed in children with SARS. It is possible that these nonspecific symptoms may also be observed in children with COVID‐19. In particular, gastrointestinal symptoms in patients with COVID‐19 may imply the route of infection. A study in SARS‐related diarrhea found that patients infected via the fecal‐oral route were more likely to develop diarrhea. 22 If COVID‐19 shares a similar aetiopathogenesis, the varying prevalence of diarrhea in children with COVID‐19 between 0% to 22%, as shown in Table 2, might be explained by fecal‐oral transmission. As a respiratory disease, COVID‐19 is predominately transmitted via respiratory droplets and hence respiratory tract symptoms were commonly observed in patients. By the same token, the incidental fecal‐oral transmission of COVID‐19 should see different prevalence rates of gastrointestinal symptoms in different clinical studies.
Another similarity between SARS and COVID‐19 in children is that younger children had a less aggressive clinical course, compared with adolescents. This finding in SARS has been well documented. 23 , 24 For instance, symptoms such as chills, rigor, and myalgia were more common in adolescents yet rare in younger children with SARS. 25 As shown in Table 2, chill, dizziness, and myalgia were less commonly observed in Babyn et al 16 where the studied cohort comprised of younger children with an average age of 6.8 years. In contrast, these symptoms were shown more prevalent in Leung and Chiu 14 and Li et al 15 where the studied cohorts had a median age of 11.7 and 13.6 years, respectively. The cohort in the present study comprised of younger children with a median age of 4 years. Chill and dizziness were not observed while myalgia was observed in only 2.4% of patients of age below 18 years. In another two clinical studies concerning children infected with SARS‐CoV‐2, chill and dizziness were not observed whereas myalgia was seen in 0% to 7.1% of the children. 18 , 20
The mechanism behind the reduced susceptibility in children remains an active area for research. A number of studies have aimed to understand the pathogenesis by considering the association between age‐related susceptibility to COVID‐19 and angiotensin‐converting enzyme 2 (ACE2), a negative regular of the renin‐angiotensin system (RAS) that was found to mediate the host cell entry of SARS‐CoV and SARS‐CoV‐2. However, contradicting findings have been observed. For example, expression of ACE2 was found higher in Asian females yet lowered during aging 26 whereas another study found that increased expression was associated with age yet not with gender. 27 Similarly, a study found increased expression of ACE2 with age in females as well as higher expression in males compared to females. 28 However, this finding failed to explain the lower prevalence of SARS observed in men, 46% (n = 483) in Taiwan, 29 44% (n = 1755) in Hong Kong, 30 and 34% (n = 201) in Singapore. 31 The opposite view has also been proposed. For instance, it has been suggested that ACE2 produced the heptapeptide angiotensin (1‐7), the abundant peptide of the RAS, which had favorable effects on the pulmonary endothelial cells and might provide resilience from the development of pulmonary failure in COVID‐19. 32
Another possible explanation is that children are less likely smokers. Recent studies suggested that higher levels of ACE2 expression was found in smokers 33 , 34 and after SARS‐CoV infection, suggestive of a role of postinfectious regulation. 34 The mechanism behind remains uncertain because nicotine was found to downregulate the expression of ACE2 35 and contradicting findings concerning the levels of ACE2 expression in individuals with chronic obstructive pulmonary disease. 33 , 34
Finally, the hypothesized links between cytokine storm syndrome and mortality may also explain the reduced fatality risk of children with COVID‐19. 36 , 37 On one hand, a number of studies have proposed the association between aging and increased cytokine production, interferon‐γ (IFN‐γ) for example, 38 , 39 meaning that children are less susceptible to cytokine storm syndrome. On the other hand, a recent study found that SARS‐CoV‐2 generally triggered lower levels of cytokines, including IFN‐γ and IL‐12 (an interleukin induces the production of IFN‐γ 40 ), compared to SARS‐CoV infection. 41 In addition, this study also suggested that SARS‐CoV‐2 was capable of infecting and replicating more robustly than SARS‐CoV in human lung tissues because the nucleocapsid antigens of SARS‐CoV‐2 were detected in higher abundance and in broader areas of human lung tissues than that of SARS‐CoV. Taken together, these findings might explain the less severity in children with COVID‐19, as demonstrated by a lower prevalence of cough, fever, and nasal congestion/rhinorrhoea compared to SARS, as shown in Table 2.
This study has some limitations. The size of the children's cohort was small hence some symptoms such as headache and abdominal pain/discomfort were not observed. However, it was expected the prevalence of these symptoms to remain low since the sample in the study is sufficiently random to reduce any symptom‐related systematic bias. Comorbidities were not considered in the study as they were not reported by the media. Still, chronic diseases are uncommon in children.
CONFLICT OF INTERESTS
The authors declare that there are no conflict of interests.
Leung C. Clinical characteristics of COVID‐19 in children: Are they similar to those of SARS? Pediatric Pulmonology. 2020;55:1592–1597. 10.1002/ppul.24855
REFERENCES
- 1. Zhu N, Zhang D, Wang W, et al. A novel coronavirus from patients with pneumonia in China, 2019. N Engl J Med. 2020;382:727‐733. 10.1056/NEJMoa2001017 [DOI] [PMC free article] [PubMed] [Google Scholar]
- 2. Jiang S, Shi Z. The first disease X is caused by a highly transmissible acute respiratory syndrome coronavirus. Virol Sin. 2020. 10.1007/s12250-020-00206-5 [DOI] [PMC free article] [PubMed] [Google Scholar]
- 3. Hui DSC, Zumla A. Severe acute respiratory syndrome. Infect Dis Clin North Am. 2019;33(4):869‐889. 10.1016/j.idc.2019.07.001 [DOI] [PMC free article] [PubMed] [Google Scholar]
- 4. Wang D, Hu B, Hu C, et al. Clinical characteristics of 138 hospitalized patients with 2019 novel coronavirus–infected pneumonia in Wuhan, China. JAMA. 2020;323:1061. 10.1001/jama.2020.1585 [DOI] [PMC free article] [PubMed] [Google Scholar]
- 5. Mahase E. Coronavirus: COVID‐19 has killed more people than SARS and MERS combined, despite lower case fatality rate. BMJ. 2020;368:m641. 10.1136/bmj.m641 [DOI] [PubMed] [Google Scholar]
- 6. Liu Y, Gayle AA, Wilder‐Smith A, Rocklöv J. The reproductive number of COVID‐19 is higher compared to SARS coronavirus. J Travel Med. 2020;27(2):taaa021. 10.1093/jtm/taaa021 [DOI] [PMC free article] [PubMed] [Google Scholar]
- 7. Centers for Disease Control and Prevention . Frequently Asked Questions and Answers: Coronavirus Disease‐2019 (COVID‐19) and Children . https://www.cdc.gov/coronavirus/2019‐ncov/specific‐groups/children‐faq.html. Accessed 12 March 2020.
- 8. Leung C. Clinical features of deaths in the novel coronavirus epidemic in China. Rev Med Virol. 2020;30(3):e2103. 10.1002/rmv.2103 [DOI] [PMC free article] [PubMed] [Google Scholar]
- 9. Le CT. Applied Categorical Data Analysis. New York: Wiley; 1998. [Google Scholar]
- 10. National Bureau of Statistics of China . China Statistical Yearbook 2019. Beijing: China Statistics Press; 2019. [Google Scholar]
- 11. Feng D, Jia N, Fang L, et al. Duration of symptom onset to hospital admission and admission to discharge or death in SARS in mainland China: a descriptive study. Trop Med Int Health. 2009;14(1):28‐35. 10.1111/j.1365-3156.2008.02188.x. [DOI] [PubMed] [Google Scholar]
- 12. National Bureau of Statistics of China . China Statistical Yearbook 2004. Beijing: China Statistics Press; 2004. [Google Scholar]
- 13. Bitnun A, Allen U, Heurter H, et al. Children hospitalized with severe acute respiratory syndrome‐related illness in Toronto. Pediatrics. 2003;112(4):e261. 10.1542/peds.112.4.e261 [DOI] [PubMed] [Google Scholar]
- 14. Leung CW, Chiu WK. Clinical picture, diagnosis, treatment and outcome of severe acute respiratory syndrome (SARS) in children. Paediatr Respir Rev. 2004;5(4):275‐288. 10.1016/j.prrv.2004.07.010 [DOI] [PMC free article] [PubMed] [Google Scholar]
- 15. Li AM, So HK, Chu W, et al. Radiological and pulmonary function outcomes of children with SARS. Pediatr Pulmonol. 2004;38(6):427‐433. 10.1002/ppul.20078 [DOI] [PMC free article] [PubMed] [Google Scholar]
- 16. Babyn PS, Chu WCW, Tsou IYY, et al. Severe acute respiratory syndrome (SARS): chest radiographic features in children. Pediatr Radiol. 2004;34(1):47‐58. 10.1007/s00247-003-1081-8 [DOI] [PMC free article] [PubMed] [Google Scholar]
- 17. Zhu L, Wang J, Huang R, et al. Clinical characteristics of a case series of children with coronavirus disease 2019. Pediatr Pulmonol. 2020;55:1430‐1432. 10.1002/ppul.24767 [DOI] [PMC free article] [PubMed] [Google Scholar]
- 18. Du W, Yu J, Wang H, et al. Clinical characteristics of COVID‐19 in children compared with adults in Shandong Province, China. Infection. 2020. 10.1007/s15010-020-01427-2 [DOI] [PMC free article] [PubMed] [Google Scholar]
- 19. Lu X, Zhang L, Du H, et al. SARS‐CoV‐2 infection in children. N Engl J Med. 2020;382:1663‐1665. 10.1056/NEJMc2005073 [DOI] [PMC free article] [PubMed] [Google Scholar]
- 20. Shen Q, Guo W, Guo T, et al. Novel coronavirus infection in children outside of Wuhan, China. Pediatr Pulmonol. 2020;55:1424‐1429. 10.1002/ppul.24762 [DOI] [PMC free article] [PubMed] [Google Scholar]
- 21. Tan YP, Tan BY, Pan J, Wu J, Zeng SZ, Wei HY. Epidemiologic and clinical characteristics of 10 children with coronavirus disease 2019 in Changsha, China. J Clin Virol. 2020;127:104353. 10.1016/j.jcv.2020.104353 [DOI] [PMC free article] [PubMed] [Google Scholar]
- 22. Kwan AC, Chau TN, Tong WL, et al. Severe acute respiratory syndrome‐related diarrhea. J Gastroenterol Hepatol. 2005;20(4):606‐610. 10.1111/j.1440-1746.2005.03775.x [DOI] [PMC free article] [PubMed] [Google Scholar]
- 23. Ng PC, Leung CW, Chiu WK, Wong SF, Hon EKL. SARS in newborns and children. Neonatology. 2004;85(4):293‐298. 10.1159/000078174 [DOI] [PubMed] [Google Scholar]
- 24. Leung TF, Wong GW, Hon KL, Fok TF. Severe acute respiratory syndrome (SARS) in children: epidemiology, presentation and management. Paediatr Respir Rev. 2003;4(4):334‐339. 10.1016/s1526-0542(03)00088-5 [DOI] [PMC free article] [PubMed] [Google Scholar]
- 25. Li AM. Severe acute respiratory syndrome (SARS) in neonates and children. Arch Dis Child Fetal Neonatal Ed. 2005;90(6):F461‐F465. 10.1136/adc.2005.075309 [DOI] [PMC free article] [PubMed] [Google Scholar]
- 26. Chen J, Jiang Q, Xia X, et al. Individual variation of the SARS‐CoV2 receptor ACE2 gene expression and regulation. Preprints. 2020:2020030191. [DOI] [PMC free article] [PubMed] [Google Scholar]
- 27. Chen Y, Shan K, Qian W. Asians and other races express similar levels of and share the same genetic polymorphisms of the SARS‐CoV‐2 cell‐entry receptor. Preprints. 2020:2020020258. 10.20944/preprints202002.0258.v1 [DOI] [Google Scholar]
- 28. Lukassen S, Chua RL, Trefzer T, et al. SARS‐CoV‐2 receptor ACE2 and TMPRSS2 are primarily expressed in bronchial transient secretory cells. EMBO J. 2020;39:e105114. 10.15252/embj.20105114 [DOI] [PMC free article] [PubMed] [Google Scholar]
- 29. Lee ML, Chen CJ, Su IJ, et al. Severe acute respiratory syndrome — Taiwan, 2003. MMWR Morb Mortal Wkly Rep. 2003;52(20):461‐466. [PubMed] [Google Scholar]
- 30. Leung GM, Hedley AJ, Ho LM, et al. The epidemiology of severe acute respiratory syndrome in the 2003 Hong Kong epidemic: an analysis of all 1755 patients. Ann Intern Med. 2004;141(9):662‐673. 10.7326/0003-4819-141-9-200411020-00006 [DOI] [PubMed] [Google Scholar]
- 31. Leo YS, Chen M, Heng BH, et al. Severe acute respiratory syndrome — Singapore, 2003. MMWR Morb Mortal Wkly Rep. 2003;52(18):405‐411. [PubMed] [Google Scholar]
- 32. Lo KB, McCullough PA, Rangaswami J. Antihypertensive drugs and risk of COVID‐19? Lancet Respir Med. 2020;8:e29. 10.1016/S2213-2600(20)30156-9 [DOI] [PMC free article] [PubMed] [Google Scholar]
- 33. Leung JM, Yang CX, Tam A, et al. ACE‐2 expression in the small airway epithelia of smokers and COPD patients: implications for COVID‐19. Eur Respir J. 2020;55:2000688. 10.1183/13993003.00688-2020 [DOI] [PMC free article] [PubMed] [Google Scholar]
- 34. Li G, He X, Zhang L, et al. Assessing ACE2 expression patterns in lung tissues in the pathogenesis of COVID‐19. J Autoimmun. 2020:102463. 10.1016/j.jaut.2020.102463 [DOI] [PMC free article] [PubMed] [Google Scholar]
- 35. Oakes JM, Fuchs RM, Gardner JD, Lazartigues E, Yue X. Nicotine and the renin‐angiotensin system. Am J Physiol Regul Integr Comp Physiol. 2018;315(5):R895‐R906. 10.1152/ajpregu.00099.2018 [DOI] [PMC free article] [PubMed] [Google Scholar]
- 36. Mehta P, McAuley DF, Brown M, Sanchez E, Tattersall RS, Manson JJ. COVID‐19: consider cytokine storm syndromes and immunosuppression. Lancet. 2020;395(10229):1033‐1034. 10.1016/S0140-6736(20)30628-0 [DOI] [PMC free article] [PubMed] [Google Scholar]
- 37. Ruan Q, Yang K, Wang W, Jiang L, Song J. Clinical predictors of mortality due to COVID‐19 based on an analysis of data of 150 patients from Wuhan, China. Intensive Care Med. 2020;46:1‐3. 10.1007/s00134-020-05991-x [DOI] [PMC free article] [PubMed] [Google Scholar]
- 38. Smart JM, Kemp AS. Ontogeny of T‐helper 1 and T‐helper 2 cytokine production in childhood. Pediatr Allergy Immunol. 2001;12(4):181‐187. 10.1034/j.1399-3038.2001.012004181.x [DOI] [PubMed] [Google Scholar]
- 39. Djuardi Y, Supali T, Wibowo H, et al. Maternal and child cytokine relationship in early life is not altered by cytokine gene polymorphisms. Genes Immun. 2016;17(7):380‐385. 10.1038/gene.2016.35 [DOI] [PMC free article] [PubMed] [Google Scholar]
- 40. Hazelzet JA, Kornelisse RF, van der Pouw Kraan TCTM, et al. Interleukin 12 levels during the initial phase of septic shock with purpura in children: relation to severity of disease. Cytokine. 1997;9(9):711‐716. 10.1006/cyto.1997.0215. [DOI] [PubMed] [Google Scholar]
- 41. Chu H, Chan JFW, Wang Y, et al. Comparative replication and immune activation profiles of SARS‐CoV‐2 and SARS‐CoV in human lungs: an ex vivo study with implications for the pathogenesis of COVID‐19. Clin Infect Dis. 2020:ciaa410. 10.1093/cid/ciaa410 [DOI] [PMC free article] [PubMed] [Google Scholar]