

Abstract
The new coronavirus (COVID‐19) infection reported in China in December 2019 has become a pandemic in a few weeks, affecting the entire world. In this respect, it is crucial to determine the case‐increase, case‐fatality, and case‐recovery rates to control COVID‐19. In this study, the case‐increase, case‐fatality, and case‐recovery rates of COVID‐19 in 36 European countries were analyzed with the meta‐analysis method using data released by the health organizations and WHO. The data were obtained from the website of health organizations of 36 European countries and the website of WHO until 11 May 2020. The analyses were carried out on 1 744 704 COVID‐19‐diagnosed cases in 36 European countries. The case‐increase, case‐fatality and case‐recovery rates of COVID‐19 were calculated using 95% confidence intervals (95% CI), single‐arm meta‐analysis, cross‐temporal meta‐analysis, and meta‐regression random‐effects model. The standardized case‐increase rate of COVID‐19 is 5% (95% CI [0.040, 0.063]) and the average case‐increase rate in European countries has started to decline by around 3% (95% CI [0.047, 0.083]) weekly. The countries with the highest rate of case increase are Belgium, Sweden, Russia, the Netherlands and the United Kingdom. Although the case‐fatality rate of COVID‐19 patients was 4.5% as of May 11 (95% CI [0.037‐0.055]), this rate is 6.3% (95% CI [0.047, 0.083]) in standardized time (6th week). The case‐recovery rates of patients are 46% (95% CI [0.376‐0.547]). This study presents important results regarding the COVID‐19 pandemic in Europe. Although the rate of increase in new COVID‐19 cases has dropped, there is not much decline in the case‐fatality rates and no increase in case‐recovery rates. The case‐fatality rate of COVID‐19 in Europe was estimated to be in the range of 4% to 4.5% and a minimum of 4 weeks (as of 11 May) is expected to have the figure below 1% in a country with an average case‐increase rate. Monitoring case fatalities in Belgium, the Netherlands and Sweden, and treatment successes in Germany and Austria play a role of utmost importance.
Keywords: case‐fatality rate, case‐increase rate, case‐recovery rate, COVID‐19, Europe
1. BACKGROUND
China reported the discovery of a new coronavirus (SARS‐CoV‐2) infected pneumonia, (COVID‐19) causing serious sickness and death in Wuhan, to the World Health Organization (WHO) on 31 December 2019. 1 Clinical trials showed that COVID‐19 symptoms included fever, cough, shortness of breath, and sometimes watery diarrhea. 2 In January 2020, the COVID‐19 infection became a pandemic affecting more than 160 countries in a few weeks. Although the measures taken have significantly reduced new COVID‐19 cases in China, the decline has not been similar in Europe and the US. The first identified cases of COVID‐19 infection in Europe were in France on 24 January, Germany on 27 January, Finland on 29 January, and Italy on 31 January. Since then, the number of cases identified in Europe has risen rapidly, particularly in Spain, Italy, France, Germany, the United Kingdom, and Turkey. Patients with COVID‐19 were reported in 50 European countries as of 11 May 2020. Half of the current 4.1 million COVID‐19 cases (1.75 million) are in Europe. Spain and Italy have taken the second and third places in the world with the most number of COVID‐19 cases. These countries have also a very high case‐fatality rate. 3 It has been assumed that the virus has been circulating within the European population since January based on the number of cases and the advanced stage of the disease. 4
Estimating the rates of case increase, case fatality, and case recovery are key parameters for understanding the basic epidemiological characteristics of the pandemic. 5 Although several studies have been conducted to determine the case‐increase, case‐fatality, and case‐recovery rates at various stages of the outbreak, studies involving reliable rates of case increase, case fatality, and case recovery on the basis of meta‐analysis in the European specific for COVID‐19 are limited. 6 , 7 The available evidence on the contagiousness, case fatality, and case recovery of COVID‐19 is focused on China. 8 , 9 In initial studies, the case‐fatality rates were reported as 15%. 2 However, this figure was calculated with a small group of inpatients. Afterward, as more data found, the case‐fatality rate dropped to 11.0% and to 4.3% and then to 3.4%. Serious attention has not been paid to these basic epidemiological characteristics in Europe, 1 and considering the rapid increase in COVID‐19 in Europe, it is of paramount importance to understand the rate of the case increase, case fatality and case recovery in Europe to guide the applications of prior prevention and control measures.
Therefore, the epidemiological characteristics, case‐increase, case‐fatality, and case‐recovery rate of COVID‐19 in Europe using the data of a 3‐month period from 24 January until today were found using the method of meta‐analysis. Data were analyzed using Microsoft Excel and Comprehensive Meta‐Analysis 3.3®.
2. DATA AND METHODS
2.1. Data search and selection
The health organizations of European countries and WHO conducted a comprehensive systematic literature review in their online databases on 11 May 2020 to provide the data required for meta‐analysis. The search terms are COVID‐19; 2019‐nCoV; the number of daily cases, deaths, and discharges. In addition, laboratory‐approved COVID‐19 cases were included in the analyses to guarantee the comprehensiveness and accuracy of the research. All search results were evaluated (Figure 1) according to the Preferred Reporting Items for Systematic Reviews and Meta‐Analyses (PRISMA) and the final analysis was conducted on 1 744 704 COVID‐19 diagnosed cases in 36 countries.
Figure 1.
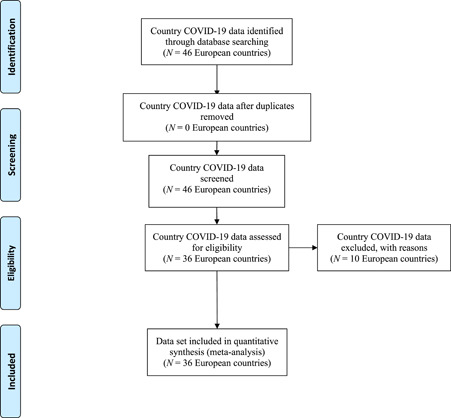
Preferred Reporting Items for Systematic Reviews and Meta‐Analyses flow diagram
2.2. Bias risk assessment
To minimize the potential for biases such as sampling or measurement bias in undertaking a meta‐analysis study, rigorous methods should be used to locate, select, and aggregate the results of individual studies. Incorporating an assessment of the risk of bias of these studies is essential in interpreting their results and may help to avoid underestimating or overestimating the parameter of interest. 10 In this study, AHRQ's Guidance on Constructs to include or Exclude from Risk‐of‐Bias Assessment 11 was taken into account in evaluating the risk of bias. As the country dataset was used instead of research data, the guideline was adapted according to the study. Therefore, the risk of bias of each country's data included in this study were evaluated as follows:
-
▪
In terms of the risk of precision, the laboratory‐confirmed COVID‐19 cases, deaths, and recovered cases in each country were taken into account. The cases which were not laboratory‐confirmed were excluded.
-
▪
The number of cases, deaths, and recoveries announced by the health organizations of the countries were confirmed by data from WHO and other health institutions. Unconfirmed data were excluded from the analysis because of the risk of biased, bad, or inadequate reporting.
-
▪
A standard calendar has been created for COVID‐19 cases, deaths, and recovered cases in countries for applicability risk (see Section 2.3 for details).
-
▪
Publication bias was assessed using the funnel chart and the Trim and Fill test. No evidence of bias was observed in the data included in the meta‐analysis according to funnel graphs. In addition, there was no difference between the size of the effects observed in the Trim and Fill test 12 conducted according to 95% CI in the random‐effects model and the size of the virtual effects generated according to the random‐effects model to correct the effects caused by bias.
2.3. Statistical analysis of data
There are different methods to calculate the case‐increase rate. However, as the COVID‐19 outbreak only has a 5‐month period, the rate of new cases diagnosed daily in this study was calculated as the ratio ofthe new cases to the total number of cases. The first COVID‐19 cases were not detected on the same date in the European countries and the rate of new cases/total cases was very high in the first days of the pandemic, therefore, the analyses were standardized as day 0 on the 100th day in all countries. In addition, case rate analyses were standardized by population, as the populations of case countries were not similar. The weighted average of the case‐increase rate calculated for each day of the week was used for the case‐increase rate of each week.
The case‐fatality rate was determined as the ratio of those who died from COVID‐19 disease to the patients with COVID‐19. In calculating weekly case‐fatality rates, the average of fatality rates calculated for each day of that week was used for the fatality rate of each week, starting from the day following the first death. The use of epidemiological velocity terms interchangeably in the literature has become a common nomenclature error. Therefore, the fatality rate should not be confused with the mortality rate. A mortality rate—often confused with a case‐fatality rate—is a measure of the number of deaths (in general, or due to a specific cause) in a population scaled to the size of that population per unit of time. 13 A case‐fatality rate, in contrast, is the number of dead among the number of diagnosed cases. 14
The case‐recovery rate was determined as the ratio of the number of patients recovering with the diagnosis of COVID‐19 disease. In the calculation of the case‐recovery rates, the day of the 100th incident was accepted as the 0th day and calculated as the ratio of the total number of case recovery to the relevant day for the case‐recovery rate on the 1st, 8th, 15th, 22nd, 29th and 36th days.
Meta‐analyses were carried using Microsoft Excel and Comprehensive Meta‐Analysis 3.3® software. Heterogeneity between the studies was tested using the Cochran χ 2 test and I 2, when I 2 was below 50%, a stabilization model was used. When I 2 was over 50%, a random effect model was selected. The combined case‐increase rate and 95% confidence intervals (95% CI) single‐arm meta‐analysis and the cross‐temporal meta‐analysis random‐effects model (weighting, case sizes of each country were taken into account) weighted effect size were calculated. To investigate the heterogeneity, the percentage of population the over 70‐year‐olds, and the population growth rate to the rate of increase in cases, the rate of case fatality and case recovery were tested using the meta‐regression random‐effects model. P < .05 was considered statistically significant.
3. RESULTS
3.1. The increase rate of cases1
The study examined the increase of COVID‐19 cases in European countries using cross‐temporal meta‐analysis. 1 744 704 cases of 36 European countries were included in the analysis. The results of random effect model meta‐analysis COVID‐19 presented a daily case increase of 22.7% (95% CI [0.200, 0.256]) in the first week; a daily case increase of 15.6% (95% CI [0.135, 0.179]) in the second week; a daily case increase of 11.2% (95% CI [0.094, 0.132]) daily in the third week; a daily case increase of 8.1% (95% CI [0.066, 0.099]) daily in the fourth week and 5% (95% CI [0.040, 0.063]) in the fifth week (Table 1) following the 100th case. The sensitivity analysis showed that none of the literature reports significantly interfered with the results of this meta‐analysis. Funnel charts were drawn to test each week's publication bias. Publication bias test results: Duval and Tweedies’ trim and fill test showed no publication bias.
Table 1.
The increase rate of cases: Meta‐analysis results
| Weeks | Number of countries | ES | 95% CI | Q a | I 2 b | T 2 c | P value |
|---|---|---|---|---|---|---|---|
| 1st | 36 | 0.227 | 0.200‐0.256 | 139.13 | 74.84 | 0.17 | <.001 |
| 2nd | 36 | 0.156 | 0.135‐0.179 | 11.808 | 69.51 | 0.17 | <.001 |
| 3rd | 36 | 0.112 | 0.094‐0.132 | 110.58 | 68.35 | 0.22 | <.001 |
| 4th | 36 | 0.081 | 0.066‐0.099 | 112.43 | 68.87 | 0.29 | <.001 |
| 5th | 36 | 0.050 | 0.040‐0.063 | 75.00 | 53.33 | 0.25 | <.001 |
Abbreviations: CI, confidence interval; ES, effect size.
Cochran's Q statistic for heterogeneity.
I 2 Index for the degree of heterogeneity.
T 2 measure of heterogeneity.
The results of the analysis, carried out on a standardized calendar, showed that the countries with the highest case‐increase rate in the fifth week were Belgium, Sweden, Russia, the Netherlands, and the United Kingdom. The countries with the lowest case‐increase rate are Belarus, Ukraine, Iceland, Luxembourg, and Bosnia and Herzegovina. See Appendix 1 for the weekly case‐increase rates of countries.
The meta‐regression analysis showed no statistically significant effect of the population density of the countries on the average case‐increase rate in the first and second weeks (P > .05). However, in the third, fourth, and fifth weeks, the population density of the countries had a statistically significant effect on the average case‐increase rate (P < .05). The variance rate announced as a result of the calculation made by the formula regarding how much of the variance in the effect size of the population density of the countries is R 2 = 0.12 in the third week; R 2 = 0.21 in the fourth week and R 2 = 0.34 in the fifth week. According to this result, the population densities of countries can explain 12%, 21%, and 34% of the variance between countries’ COVID‐19 case‐increase rates, respectively. In addition, the meta‐regression analysis shows no statistically significant effect of the population rate above 70‐year‐olds on average case‐increase rates (P > .05).
3.2. Differences in case increase rates over weeks
Considering the day on which the 100th case was seen as the zeroth day, the weekly case‐growth rate, increase difference, standard deviations, and effect size (ES) were used to define d and r 2 of the difference.
| (1) |
| (2) |
Compared to the first week, the case‐increase rate was 7.1% lower per day in the second week (d = −2.241, r 2 = .557) in European countries, the case‐increase rate in the third week was 4.4% per day compared to the previous week (d = −2.948, r 2 = .685), the case‐increase rate in the fourth week was 3.1% lower per day (d = −3.282, r 2 = .729), and the case‐increase rate in the fifth week was 3.1% lower per day (d = −2.615, r 2 = .631) (Table 2).
Table 2.
Differences in case‐increase rate on a weekly basis
| Cross‐temporal, wk | ESchange | SD | d | r 2 |
|---|---|---|---|---|
| 1st‐2nd | −0.071 | 0.032 | −2.241 | .557 |
| 2nd‐3rd | −0.044 | 0.015 | −2.948 | .685 |
| 3rd‐4th | −0.031 | 0.009 | −3.282 | .729 |
| 4th‐5th | −0.031 | 0.012 | −2.615 | .631 |
Abbreviation: ES, effect size.
3.3. Case‐fatality rate
The results of the random effect model meta‐analysis showed that the case‐fatality rate of COVID‐19 patients was 1.5% (95% CI [0.009, 0.025]) in the first week; 2.5% (95% CI [0.019, 0.031]) in the second week; 3% (95% CI [0.024, 0.037]) in the third week; 3.8% (95% CI [0.031, 0.047]) in the fourth week; 4.3% (95% CI [0.034, 0.055]) in the fifth week and 6.3% (95% CI [0.047, 0.083]) in the sixth following the first death. Also, as of 11 May 2020, the case‐fatality rate of COVID‐19 patients in 36 European countries is 4.5% (95% CI [0.037‐0.055]) (Table 3). The sensitivity analysis showed that none of the literature reports had significantly interfered with the results of this meta‐analysis. Funnel charts were drawn to test each week's publication bias. Publication bias test results: Duval and Tweedies’ trim and fill test showed no publication bias.
Table 3.
Case‐fatality rate: Meta‐analysis results
| Weeks | Number of countries | ES | 95% CI | Q a | I 2 b | T 2 c | P value |
|---|---|---|---|---|---|---|---|
| 1st | 36 | 0.015 | 0.009‐0.025 | 126.46 | 72.32 | 1.51 | <.001 |
| 2nd | 36 | 0.025 | 0.019‐0.031 | 116.23 | 66.70 | 0.16 | <.001 |
| 3rd | 36 | 0.030 | 0.024‐0.037 | 91.59 | 63.00 | 0.26 | <.001 |
| 4th | 34 | 0.038 | 0.031‐0.047 | 92.37 | 64.17 | 0.29 | <.001 |
| 5th | 34 | 0.043 | 0.034‐0.055 | 64.71 | 49.00 | 0.24 | <.001 |
| 6th | 20 | 0.063 | 0.047‐0.083 | 75.24 | 53.70 | 0.24 | <.001 |
| 11 May 2020 | 36 | 0.045 | 0.037‐0.055 | 47 278.60 | 99.92 | 0.40 | <.001 |
Abbreviations: CI, confidence interval; ES, effect size.
Cochran's Q statistic for heterogeneity.
I 2 Index for the degree of heterogeneity.
T 2 measure of heterogeneity.
According to the results of the analysis carried out on a standardized calendar, Iceland, Norway, Ukraine, Germany, and Austria were the countries where COVID‐19 patients had the lowest case‐fatality rate in the sixth week following the first death. The countries with the highest case‐fatality rate were Spain, Sweden, the Netherlands, Italy, the United Kingdom, and Belgium. See Appendix 2 for the weekly case‐fatality rates of the countries.
In the meta‐regression analysis, a statistically significant effect was not found on the average case‐fatality rates of countries over 70‐year‐olds in the first, second, third, and fourth week (P > .05). On the contrary, compared to the fifth and sixth weeks and 11 May 2020, a statistically significant effect was found on the case‐fatality rates of countries over 70‐year‐olds (P < .05). The variance rate announced as a result of the calculation made with the formula regarding how much of the variance in the effect size of the population above 70‐year‐olds is found as R 2 = 0.04 in the fifth week, R 2 = 0.05 in the sixth week, and R 2 = 0.06 as of 11 May 2020. According to this result, the population ratio over 70‐year‐olds can explain 4%, 5%, and 6% of the variance between countries' COVID‐19 case‐fatality rates, respectively. In addition, meta‐regression analysis did not find a statistically significant effect on the population density of countries on case‐fatality rates (P > .05).
According to the results of the subgroup analysis, as of 11 May 2020, the case‐fatality rates differ according to the geographical locations of the countries. (Q b = 9.56, P < .05). Moderator analysis shows that the case‐fatality rate in Eastern European countries are 3% (95% CI [0.018, 0.049]) whereas it is 4.1% in Northern Europe Countries 4.1% (95% CI [0.028, 0.059]); 5.8% in Southern Europe Countries (95% CI [0.047, 0.072]) and 7.2% in Western Europe Countries (95% CI [0.045, 0.113]).
3.4. Differences in case‐fatality rates over weeks
Considering the day, on which the first case‐fatality was seen as the zeroth day, the weekly case‐fatality rate, case‐increase difference, standard deviations, and effect size (ES) were used to define d and r 2 of the difference (Equations 1 and 2).
The case‐fatality rate in Europe was found to be 1% higher in the second week (d = .307, r 2 = .023) compared to the first week. The case‐fatality rate was 0.5% higher in the third week compared to the previous week (d = .327, r 2 = .026) and the case‐fatality rate was 0.8% higher in the fourth week compared to the previous week (d = −.847, r 2 = .152). The daily case‐fatality rate was 0.5% higher in the fifth week (d = −0.422, r 2 = .043) compared to that of the fourth week (Table 4).
Table 4.
Differences in case‐fatality rate on a weekly basis
| Cross‐temporal, wk | ESchange | SD | d | r 2 |
|---|---|---|---|---|
| 1st‐2nd | 0.010 | 0.033 | 0.307 | .023 |
| 2nd‐3rd | 0.005 | 0.015 | 0.327 | .026 |
| 3rd‐4th | 0.008 | 0.009 | 0.847 | .152 |
| 4th‐5th | 0.005 | 0.012 | 0.422 | .043 |
Abbreviation: ES, effect size.
3.5. Case‐recovery rate
Considering the day on which the 100th case was seen as the zeroth day, results of random effect model meta‐analysis showed that the case‐recovery rate of COVID‐19 patients was 2.1% (95% CI [0.012, 0.037]) on the 1st day; 1.6% (95% CI [0.011, 0.022]) on the 8th day; 1.8% (95% CI [0.13, 0.025]) on the 15th day; 3.4% (95% CI [0.026, 0.044]) on the 22nd day; 10.2% (95% CI [0.086, 0.123]) on the 29th day and 13% (95% CI [0.103, 0.164]) on the 36th day. Also, as of 11 May 2020, the case‐recovery rate of COVID‐19 patients in 34 European countries was 46% (95% CI [0.376‐0.547]) (Table 5). The sensitivity analysis showed that no literature reports had significantly interfered with the results of this meta‐analysis. Funnel charts were drawn to test each week's publication bias. Publication bias test results: Duval and Tweedies’ trim and fill test showed no publication bias.
Table 5.
Case recovery rate: Meta‐analysis results
| Days, d | Number of Country | ES | 95% CI | Q a | I 2 b | T 2 c | P value |
|---|---|---|---|---|---|---|---|
| 1st | 35 | 0.021 | 0.012‐0.037 | 188.80 | 82.52 | 2.04 | <.001 |
| 8th | 35 | 0.016 | 0.011‐0.022 | 335.96 | 90.17 | 0.87 | <.001 |
| 15th | 34 | 0.018 | 0.130‐0.025 | 1598.46 | 97.99 | 0.79 | <.001 |
| 22nd | 34 | 0.034 | 0.026‐0.044 | 4869.29 | 99.34 | 0.55 | <.001 |
| 29th | 33 | 0.102 | 0.086‐0.123 | 1127.39 | 99.73 | 0.26 | <.001 |
| 36th | 25 | 0.130 | 0.103‐0.164 | 37795.49 | 99.44 | 0.41 | <.001 |
| 11 May 2020 | 34 | 0.460 | 0.376‐0.547 | 68 617.90 | 99.98 | 1.07 | <.001 |
Abbreviations: CI, confidence interval; ES, effect size.
Cochran's Q statistic for heterogeneity.
I 2 Index for the degree of heterogeneity.
T 2 measure of heterogeneity.
The results of the analysis, carried out on a standardized calendar, showed that the countries with the highest case‐recovery rate of COVID‐19 patients as from 22 days were Iceland, Finland, Austria, Germany, Switzerland, and Denmark. The countries with the lowest case‐recovery rate are Norway, Ireland, the Netherlands, Portugal, and Sweden. See Appendix 3 for the weekly case‐fatality rates of the countries.
In the meta‐regression analysis, no statistically significant effect was found in countries with the population rate of the above 70‐year‐olds and the population density on the case‐recovery rates (P > .05).
3.6. Differences in case‐recovery rates over weeks
Considering the day, on which the 100th case was seen as the zeroth day, the weekly case‐growth rate increase difference, standard deviations, and effect size were used to define d and r 2 of the difference (Equations 1 and 2).
It has been noted that the case‐recovery rate on the 8‐day in the European countries was 0.5% lower (d = −0.080, r 2 = .002) compared to the first day. The case‐recovery rate on the 15th day was 0.2% higher compared to the 8th day (d = 0.092, r 2 = .002), the case‐recovery rate on the 22nd day was 1.6% higher compared to 15th day (d = 0.349, r 2 = .030), the case‐recovery rate was 6.8% higher in the 29th day compared to the 22nd day (d = 0.830, r 2 = .147) and the case‐recovery rate was 2.8% higher in the 36th day compared to 29th day (d = 0.197, r 2 = .010) (see Table 6).
Table 6.
Differences in case‐recovery rate on a weekly basis
| Cross‐temporal, d | ESchange | SD | d | r 2 |
|---|---|---|---|---|
| 1st‐8th | −0.005 | 0.062 | −0.080 | .002 |
| 8th‐15th | 0.002 | 0.022 | 0.092 | .002 |
| 15th‐22nd | 0.016 | 0.046 | 0.349 | .030 |
| 22nd‐29th | 0.068 | 0.082 | 0.830 | .147 |
| 29th‐36th | 0.028 | 0.142 | 0.197 | .010 |
Abbreviation: ES, effect size.
4. DISCUSSION
This meta‐analysis includes laboratory‐approved case data obtained between January 2019 and 11 May 2020 to analyze the epidemiological characteristics of COVID‐19 in Europe. This study, covering 36 European countries and 1 744 704 cases, reflects the latest data since the emergence of COVID‐19. The results showed relatively low heterogeneity in terms of single‐arm meta‐analysis. The sensitivity analysis also showed that the results were not affected by countries' data and that there was no bias. Furthermore, meta‐analyses of randomized controlled data were not found to be superior to nonrandomized data in terms of evidence level. 15
The cases included in the analysis were between 24 January and 11 May. The meta‐analysis based on the random effect model showed that COVID‐19 had a case‐increase rate of 5%. It was also noted that the discharge rate of patients was 17%, and the case‐fatality rate was 4%. The results of the cross‐temporal meta‐analysis in Europe showed a decline in the case‐increase rate of cases. A country with a European average case‐increase rate was estimated to have a minimum of 4 weeks (as of 11 May) to experience a decline below 1%.
There is not much variation in weekly case‐fatality rates at COVID‐19 according to the results of a cross‐temporal meta‐analysis. The analysis estimated that the case‐fatality rate of COVID‐19 in Europe would range between 4% and 4.5%. The case‐fatality rate of SARS‐COV, which was a similar outbreak, was 10%, while the case‐fatality rate of MERS‐CoV was over 35%. 16 , 17 In contrast to the two viruses, COVID‐19 has a lower case‐fatality rate. According to the clinical trials, it has been observed that the elderly (>60 years) were reported to be in the majority of deceased patients 18 , 19 and it has been consistent with high case‐fatality rates in Italy, Spain, Sweden, the Netherlands, Italy, the United Kingdom, and Belgium having the oldest population in Europe. Nearly 23% of the Italian population was 65 years of age and over in 2019. COVID‐19 is more fatal in older patients, 20 thus the old age distribution in Italy may partly explain Italy's higher case‐fatality rate compared to other countries. However, Germany and Austria having the oldest population in Europe after Italy and with similar case‐increase rates have not experienced the same process compared to Italy and other similar countries. According to the standardized calendar, the case‐fatality rate in Europe at the end of the sixth week is 6.3%, while it is 3% in Germany and Austria. In addition, while the case‐recovery rate in Europe is 17%, Austria (71%) and Germany (66%) are among the top five countries in terms of case‐recovery rate both in the world and in Europe. This can be attributed to the measurements taken, health infrastructure, and different treatment strategies. The fact that the case‐fatality rate in Turkey, very similar to Italy, Spain, and the United Kingdom, is very low (2%) and the case‐recovery rate is close to the European average (15%) can be explained by the country's age factor. All the world authorities should investigate and learn from Germany and Austria about the success of their treatment strategy.
In conclusion, while there is a negative trend in the increased rate of cases in European countries, differences in population characteristics, treatment methods and health infrastructure affect case‐fatality and case‐recovery rates. Even though the first 3 months of the pandemic has ended, the case‐recovery rate of patients is relatively low. Although the clinical effect of some drugs has been discussed in recent days, it has been reported that plasma therapy had a definite healing effect for survivors, especially in severe, cases. 21 This indicates that countries having a case increase in the number of patients recovering with plasma treatment will recover faster from the pandemic. In addition, while Italy, Spain, and the United Kingdom are more involved in the number of deaths in research, reports and other studies, Belgium, the Netherlands, and Sweden, where case‐increase and case‐fatality rates are high and the rate of case‐recovering patients is relatively low, should be followed carefully.
Some limitations of the study should be taken into consideration. First of all, our results are limited to the early term of the pandemic on a country basis. In addition, a country is an extremely rough unit of analysis. Also, the number of confirmed cases may be biased for various factors, whereas these factors were probably stable in our case over a short period of time when they were analyzed.
Supporting information
Supporting information
Karadag E. Increase in COVID‐19 cases and case‐fatality and case‐recovery rates in Europe: A cross‐temporal meta‐analysis. J Med Virol. 2020;92:1511–1517. 10.1002/jmv.26035
Footnotes
COVID‐19 diagnosed cases in each country have not been identified on the same date. Therefore, analyses were standardized to the 100th day, on which the case was spotted, as the zeroth day. The reason for starting the analyses from the 100th case is that the increase rate below 100 cases is very high due to the small numbers. In addition, case increase analyses have been standardized by the population due to the fact that the populations of case countries are not similar.
REFERENCES
- 1. Yuan J, Li M, Lu ZK. Monitoring transmissibility and mortality of COVID‐19 in Europe. Int J Infect Dis. 2020;95:311‐315. 10.1016/j.ijid.2020.03.050 [DOI] [PMC free article] [PubMed] [Google Scholar]
- 2. Huang C, Wang Y, Li X, et al. Clinical features of patients infected with 2019 novel coronavirus in Wuhan, China. Lancet. 2020;395:497‐506. 10.1016/S0140-6736(20)30183-5 [DOI] [PMC free article] [PubMed] [Google Scholar]
- 3. Livingston E, Bucher K. Coronavirus disease 2019 (COVID‐19) in Italy. JAMA. 2020;323(14):1335. 10.1001/jama.2020.4344 [DOI] [PubMed] [Google Scholar]
- 4. Onder G, Rezza G, Brusaferro S. Case‐Fatality Rate and Characteristics of Patients Dying in Relation to COVID‐19 in Italy. JAMA. 2020;323(18):1775–1776. 10.1001/jama.2020.4683 [DOI] [PubMed] [Google Scholar]
- 5. Wallinga J, Teunis P. Different epidemic curves for severe acute respiratory syndrome reveal similar impacts of control measures. Am J Epidemiol. 2004;160:509‐516. 10.1093/aje/kwh255 [DOI] [PMC free article] [PubMed] [Google Scholar]
- 6. Wu JT, Leung K, Leung GM. Nowcasting and forecasting the potential domestic and international spread of the 2019‐nCoV outbreak originating in Wuhan, China: a modelling study. Lancet. 2020;395:689‐697. 10.1016/S0140-6736(20)30260 [DOI] [PMC free article] [PubMed] [Google Scholar]
- 7. Imperial College London MRC Centre for Global Infectious Disease Analysis. News/Wuhan Coronavirus, 2020. https://www.imperial.ac.uk/mrc-global-infectious-disease-analysis/news--wuhan-coronavirus/. Accessed on 21 April 2020.
- 8. Liu Y, Gayle AA, Wilder‐Smith A, Rocklöv J. The reproductive number of COVID‐19 is higher compared to SARS coronavirus. Journal of Travel Medicine. 2020;27(2):1–4. 10.1093/jtm/taaa021 [DOI] [PMC free article] [PubMed] [Google Scholar]
- 9. Long‐quan L, Tian H, Yong‐qing W, et al. COVID‐19 patients’ clinical characteristics, discharge rate,and fatality rate of meta‐analysis. J Med Virol. 2020;92:577‐583. 10.1002/jmv.25757 [DOI] [PMC free article] [PubMed] [Google Scholar]
- 10. Hoy D, Brooks P, Woolf A, et al. Assessing risk of bias in prevalence studies: modification of an existing tool and evidence of interrater agreement. J Clin Epidemiol. 2012;65(9):934‐939. [DOI] [PubMed] [Google Scholar]
- 11. Viswanathan M, Ansari MT, Berkman ND, et al. Assessing the Risk of Bias of Individual Studies in Systematic Reviews of Health Care Interventions. Agency for Healthcare Research and Quality Methods Guide for Comparative Effectiveness Reviews. March 2012. AHRQ Publication No. 12‐EHC047‐EF. www.effectivehealthcare.ahrq.gov. [published online ahead of print May 1, 2020].
- 12. Duval S, Tweedie R. Trim and fill: a simple funnel‐plot–based method of testing and adjusting for publication bias in meta‐analysis. Biometrics. 2000;56(2):455‐463. [DOI] [PubMed] [Google Scholar]
- 13. Last JM. A dictionary of epidemiology. Oxford, UK: Oxford University Press; 2001. [Google Scholar]
- 14. Hennekens CH, Julie EB. Epidemiology in medicine. Boston, MA: Little, Brown and Company; 1987. [Google Scholar]
- 15. Abraham NS, Byrne CJ, Young JM, Solomon MJ. Meta‐analysis of well‐designed nonrandomized comparative studies of surgical procedures is as good as randomized controlled trials. J Clin Epidemiol. 2010;63(3):238‐245. [DOI] [PubMed] [Google Scholar]
- 16. Song Z, Xu Y, Bao L, et al. From SARS to MERS, thrusting coronaviruses into the spotlight. Viruses. 2019;11(1):59. [DOI] [PMC free article] [PubMed] [Google Scholar]
- 17. Yin Y, Wunderink RG. MERS, SARS and other coronaviruses as causes of pneumonia. Respirology. 2018;23(2):130‐137. [DOI] [PMC free article] [PubMed] [Google Scholar]
- 18. Wang XF, Shi GC, Wan HY, et al. Clinical features of three avian influenza H7N9 virus‐infected patients in Shanghai. Clin Respir J. 2014;8(4):410‐416. [DOI] [PMC free article] [PubMed] [Google Scholar]
- 19. Kui L, Fang YY, Deng Y, et al. Clinical characteristics of novel coronavirus cases in tertiary hospitals in Hubei Province. Chin Med J. 2020;133(9):1025‐1031. 10.1097/CM9.0000000000000744 [DOI] [PMC free article] [PubMed] [Google Scholar]
- 20. Amariles P, Grandos J, Ceballos M, et al. COVID‐19 in Colombia endpoints. Are we different, like Europe? Res Soc Administrat Pharm. 2020;20:79. 10.1016/j.sapharm.2020.03.013 [DOI] [PMC free article] [PubMed] [Google Scholar]
- 21. National Health Commission of the People's Republic of China's main website . 2020. https://www.nhc.gov.cn. Accessed on 21 April 2020.
Associated Data
This section collects any data citations, data availability statements, or supplementary materials included in this article.
Supplementary Materials
Supporting information