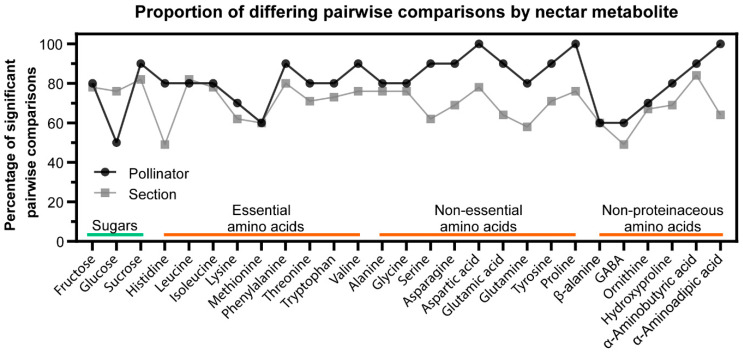
Figure 7.
Proportion of significant pairwise comparisons (q-values < 0.05) for each Nicotiana nectar metabolite when summarized by phylogenetic section (grey, a total of 45 possible pairwise comparisons, Table S3) or preferred pollinator (black, a total of 10 possible pairwise comparisons, Table S4).

