Abstract
Background:
Human saliva has been identified as a novel, practical, and noninvasive source of biomarkers and genetic materials. However, it is equally challenging due to the availability of an abundance of impurities in the form of microbes and other proteinaceous compounds. The objective of this study was to develop a robust, reproducible, and economic method of extracting high-yield and high-quality RNA from whole human saliva.
Methods:
The modified TRIzol protocol was developed to extract RNA from saliva (n = 14), followed by complementary DNA synthesis and reverse transcription quantitative polymerase chain reaction analyses for the genes encoding IL1B, ALPL, RUNX2, and ACTB. To compare our protocol with the spin column–based method, we used Qiagen Salivary Protect Micro-RNA spin columns (n = 6). To evaluate and compare the yields and quality of extracted RNAs from both methods, we used (1) Experion Bioanalyzer, (2) QuantiFluor RNA dye, and (3) NanoDrop 2000 Spectrometer.
Results:
With the modified TRIzol lysis protocol, a high yield of total RNA, on average 12.34 μg, from saliva was extracted compared with on average 0.2 μg with a spin column–based method. The average RQI (RNA quality index) with the TRIzol method was 7.86, which is also comparable with that of the spin column–based method (RQI = 7.58). QuantiFluor dye used for RNA quantification showed a 16-fold higher yield of RNA concentration using our TRIzol protocol.
Conclusions:
Our modified TRIzol protocol is a reproducible method to extract RNA from whole human saliva which can be used for gene expression analysis. This method allows also ensures the quality of RNA required for specific applications such as RNA sequencing.
Keywords: Gene expression, human saliva, RNA, RNA quantification, transcriptome analysis
Introduction
According to the National Institutes of Health, a biomarker is an objectively measured and evaluated indicator of normal biological processes, pathogenic processes, or pharmacologic responses to therapeutic intervention.1 Summarily, biomarkers are entities within the body capable of providing impartial information regarding the current physiologic state of a living organism.2 Saliva has recently been identified as a potential source of biomarkers for diagnostic purposes. One of the major advantages of saliva is noninvasive sample collection, which can be performed even by untrained personnel. Also, sampling is quick and easy to perform, which makes it advantageous for large-scale screening of children, elders, or in cases where repeated samples are required.3 All these advantages have attracted researchers to expand their knowledge of this relatively new screening method.
Saliva, often regarded as the “mirror of the body,” is a perfect surrogate medium to be applied for clinical diagnostics.4 Similar to blood, saliva is a complex fluid containing a variety of enzymes, hormones, antibodies, antimicrobial constituents, and growth factors. Many of these components enter saliva from the blood by passing through the spaces between the cells by transcellular (passive intracellular diffusion and active transport) or paracellular routes (extracellular ultrafiltration).5-7 Most compounds found in blood are also present in saliva, and therefore saliva is functionally equivalent to serum in reflecting the physiologic state of the body, including hormonal, nutritional, and metabolic variations.8
Saliva proteomic technology has identified over a thousand salivary proteins from the major salivary glands.9 However, salivary transcriptomic studies are a relatively new territory in salivary diagnostics. In these studies, the upregulation or downregulation of various gene transcripts may serve as specific biomarker indicators of particular diseases or conditions.
Various methods are available to extract RNA from saliva, such as methods using phenol and guanidinium isothiocyanate, or commercially available silica membrane spin columns or magnetic bead–based RNA isolation kits.10 However, due to the complex nature of saliva as a body fluid, there are many contaminants such as proteins, complex organic molecules, and bacteria. Furthermore, enzymes present in saliva also make RNA naturally prone to degradation. All these factors affect the quality of RNA extracted by either method. Downstream, the RNA quality is important for the sensitivity and specificity of the experiment. For gene expression analysis measured by quantitative polymerase chain reaction (qPCR) or by RNA sequencing, a lower acceptable limit for the quality of RNA is an RNA quality index (RQI) >7.0.11 Thus, it is very crucial to pass this minimum quality threshold to maintain the experimental integrity of gene expression studies.
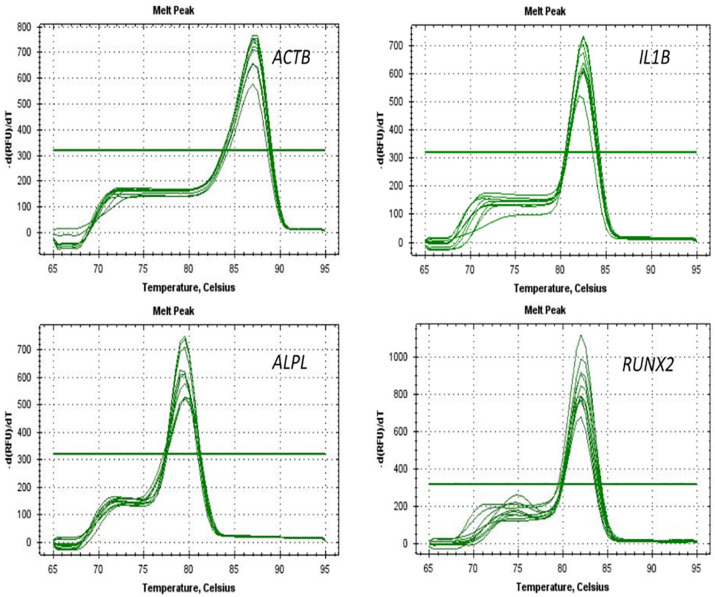
The primary objective of this study was to develop a robust, reliable, and reproducible protocol for extracting high quantities of RNA with acceptable quality from whole human saliva. Our secondary objective was to compare the yields and quality of RNA extracted by our modified TRIzol (Thermo Fisher Scientific, Cleveland, OH, USA) protocol with that of the commercially available spin column–based method. We evaluated the quality and quantity of extracted RNA using 3 different platforms. Using RNA extracted by our TRIzol (Thermo Fisher Scientific) protocol, we validated the specificity of the reverse transcription qPCR (RT-qPCR) technique for each set of primers by running a melt curve and confirming a single peak. Finally, we examined the correlation between different methods we used to measure the quality and quantity of RNA.
Materials and Methods
Participants
A total of 20 healthy volunteer participants were included in the study. All study participants signed a consent form approved by the University of Connecticut Health Institutional Review Board. The mean age of the volunteers was 30 years, with a range of 20 to 35 years. None of the volunteers had a history of malignancy, autoimmune disorders, metabolic disorders, or systemic disorders. Also, no history of infectious diseases was reported in the past 6 months.
Salivary sample collection
All study subjects were asked to not eat or drink for at least an hour before sample collection. The unstimulated whole saliva was collected in 50 mL sterile DNase- and RNase-free tubes (Thermo Fisher Scientific) by the passive drooling method.12 Immediately following the collection procedures, all samples were frozen on dry ice for up to 2 hours before RNA preparation.
RNA extraction protocol
All procedures were performed in an RNase-free environment. Fourteen samples were randomly chosen (N = 14: T1-T14) and assigned for RNA isolation using the modified TRIzol (Thermo Fisher Scientific) protocol, and 6 samples (N = 6, S1-S6) were used for the commercial spin column kit (RNeasy Protect Saliva Micro Kit) (Qiagen, Mountain View, CA, USA).
Sample preprocessing
Frozen salivary samples were thawed at room temperature. We did not use a water bath to expedite thawing, as this may degrade the RNA and compromise quality. Samples were divided into 1 mL aliquots in 1.7 mL sterile DNase- and RNase-free Denville Posi-Click Tubes (Thomas Scientific, Swedesboro, NJ, USA) and centrifuged at 16 100 RCF and 4°C for 20 minutes. Salivary supernatant was not used for RNA preparation, but was stored at −80°C and used for proteomic and cytokine analysis.
Modified TRIzol protocol
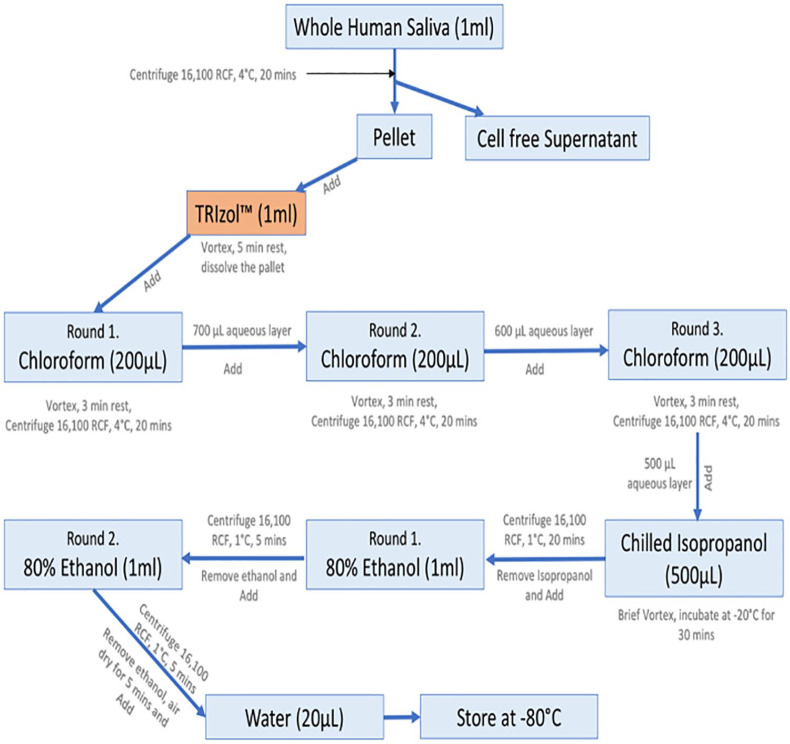
One milliliter of TRIzol (Thermo Fisher Scientific) reagent was then added to each pellet and pipetted several times, followed by vortexing for 20 seconds to homogenize. We then incubated the samples at room temperature for 5 minutes (Figure 1).
Figure 1.
Protocol flowchart.
Then, 200 μL of chloroform (Sigma-Aldrich, St. Louis, MO, USA) was added to each tube and vortexed for 20 seconds, followed by incubation at room temperature for 3 to 5 minutes. The samples were then centrifuged at 16 100 RCF for 20 minutes at 4°C. Approximately 700 μL of the upper aqueous layer from each sample was carefully transferred into a new 1.7-mL Posi-Click tube (Thomas Scientific). These chloroform steps were repeated twice, and for each consecutive time less amount, 600 μL in first and 500 μL of upper aqueous layer in second repetition, were carefully transferred to the new tubes. At this stage, 500 μL of cold isopropyl alcohol (Sigma-Aldrich) was added to each tube and vortexed for few seconds. The tubes were incubated at −20°C for at least 30 minutes to assure precipitation of RNA. Following incubation, the samples were then centrifuged for 20 minutes at 1°C at 16 100 RCF. The supernatant was removed and discarded. The pellet was washed with 1 mL of cold 80% molecular-grade ethanol and centrifuged at 16 100 RCF for 5 minutes at 1°C. This step was repeated again. Samples were then briefly centrifuged and excess ethanol removed using a pipette. The pellet was air-dried at room temperature for at least 5 minutes, resuspended in 20 μL of DNase- and RNase-free water, and incubated in a 55°C water bath for 5 minutes. Finally, we vortexed the samples briefly and used a quick spin to collect sample at the bottom of tube (Figure 1).
Commercial spin column kit
We used RNeasy Protect Saliva Micro Kit (Qiagen) for 6 samples for the isolation of RNA from the saliva. Two hundred microliters of whole human saliva was used for each sample, and the manufacturer’s standard protocol was followed in the process.
RNA samples were stored at −80°C for future applications.
Quality and quantity evaluation
We used 3 different platforms to evaluate RNA: (1) NanoDrop 2000 spectrophotometer (Thermo Fisher Scientific), (2) QuantiFluor RNA System (Promega Corp., Madison, WI, USA), and (3) Experion Bioanalyzer (Bio-Rad Laboratories, Hercules, CA, USA).
cDNA preparation and RT-qPCR
Ten randomly selected RNA samples isolated using the TRIzol (Thermo Fisher Scientific) protocol were further used to evaluate the human specificity of primers using the RT-qPCR technique. We eliminated genomic DNA with the use of DNase I (1 U/µL) (Thermo Fisher Scientific), followed by DNase inactivation using EDTA according to the manufacturer’s instruction. Reverse transcription was performed with 1000 ng of RNA in 8 µL volume, SuperScript II (200 U/µL) (Thermo Fisher Scientific), and oligo(dT)12-18 primers (1 U/µ ) (Thermo Fisher Scientific) following the manufacturer’s standard protocol. Using complementary DNA (cDNA) generated from RNA isolated using the TRIzol (Thermo Fisher Scientific) protocol, we examined the specificity of the RT-qPCR technique using 4 transcripts: (1) actin beta (ACTB), a housekeeping gene; (2) interleukin 1 beta (IL1B), an inflammatory marker; (3) alkaline phosphatase, biomineralization associated (ALPL), a bone mineralization marker; and (4) RUNX family transcription factor 2 (RUNX2), an osteoblastic differentiation marker (Table 1). Primers were designed with Primer3 software (bioinfo.ut.ee/primer3-0.4.0/), and we also used the Basic Local Alignment Search Tool (BLAST) (https://www.ncbi.nlm.nih.gov/tools/primer-blast/) with our RT-qPCR primer sets to eliminate the possibility of amplification of microbial transcripts. SYBR Select Master Mix (Thermo Fisher Scientific) was used to detect the quantitative expression levels of salivary transcripts. Our qPCR reaction mixture (20 μL total) comprised SYBR Select Master Mix (Thermo Scientific), forward and reverse primers (20 μM), nuclease-free water, and 2 μL of cDNA template. A Bio-Rad thermal cycler CFX 96 instrument was used, with a PCR protocol of 95°C for 10 minutes (initial denaturation) and 40 cycles of 95°C for 15 seconds and 60°C for 1 minute. Following qPCR amplification, we performed a melting curve analysis.
Table 1.
List of primer sequences used in the study along with their efficiency data.
| S. No. | Gene | Forward primer | Reverse primer | Slope | Amplification | Efficiency | R 2 |
|---|---|---|---|---|---|---|---|
| 1 | ACTB | TGACGTGGACATCCGCAAAG | CTGGAAGGTGGACAGCGAGG | −3.4509 | 1.9489 | 94.92% | 0.9943 |
| 2 | IL1B | TTGTTCTTTGAAGCTGATGG | GAGATTCGTAGCTGGATGC | −3.4559 | 1.947 | 94.69% | 0.9975 |
| 3 | ALPL | CCTCGTTGACACCTGGAAGAG | TTCCGTGCGGTTCCAGA | −3.2733 | 2.0207 | 102.08% | 0.9891 |
| 4 | RUNX2 | GCACCAAGTCCTTTTAATCC | GGGGTAAGACTGGTCATAGG | −3.1303 | 2.0867 | 108.68% | 0.9907 |
Results
RNA quantity
According to the NanoDrop data, the mean concentration of RNA in TRIzol samples was approximately 620 ng/μL compared with only 19 ng/μL with the commercial spin column–based method. We further evaluated the RNA samples with a QuantiFluor RNA system using the manufacturer’s standard protocol. Using this method, we found a mean RNA concentration of 320 ng/μL with our TRIzol method, compared with only 22 ng/μL when using the spin column method (Table 2).
Table 2.
Evaluation of RNA quantity and quality using 3 different methods.
| Sample No. | Experion Bioanalyzer |
QuantiFluor RNA System |
NanoDrop |
|||||
|---|---|---|---|---|---|---|---|---|
| RNA area | RNA concentration, pg/μL | Ratio 28S:18S | RNA quality index | Concentration, ng/µL | Concentration, ng/µL | A260/A280 ratio | A260/A230 ratio | |
| S1 | 2108.38 | 12 329.72 | 1.76 | 8.9 | 32.95 | 25.20 | 2.09 | 0.17 |
| S2 | 805.96 | 4713.22 | 1.09 | 8.3 | 22.58 | 20.90 | 2.16 | 0.14 |
| S3 | 1096.96 | 6414.95 | 0.97 | 7.5 | 16.48 | 16.80 | 2.11 | 0.18 |
| S4 | 1277.94 | 7473.32 | 1.03 | 3.7 | 25.66 | 23.80 | 2.05 | 0.09 |
| S5 | 725.90 | 4245.05 | 1.21 | 8.5 | 14.79 | 13.20 | 2.09 | 0.25 |
| S6 | 651.59 | 6022.18 | 1.04 | 8.6 | 19.54 | 16.50 | 2.16 | 0.04 |
| Mean | 1111.12 | 6866.41 | 1.18 | 7.58 | 22.00 | 19.40 | 2.11 | 0.15 |
| T1 | 1271.21 | 11 748.86 | 1.77 | 7.7 | 185.51 | 156.70 | 1.92 | 1.99 |
| T2 | 1293.27 | 11 952.74 | 1.91 | 7.7 | 187.41 | 208.60 | 1.92 | 2.06 |
| T3 | 1147.17 | 10 602.42 | 1.65 | 7.6 | 289.03 | 281.50 | 1.96 | 2.00 |
| T4 | 4386.60 | 40 542.18 | 1.47 | 7.5 | 502.85 | 787.80 | 2.08 | 2.08 |
| T5 | 3925.67 | 36 282.11 | 1.76 | 7.7 | 504.38 | 1375.20 | 2.06 | 2.06 |
| T6 | 3110.23 | 28 745.62 | 1.89 | 7.8 | 520.03 | 1810.10 | 2.08 | 2.08 |
| T7 | 1893.71 | 17 502.18 | 1.96 | 7.6 | 386.28 | 323.50 | 2.05 | 1.98 |
| T8 | 1060.59 | 9802.25 | 1.97 | 7.6 | 351.67 | 462.50 | 2.05 | 1.84 |
| T9 | 963.95 | 8909.08 | 1.94 | 7.7 | 314.41 | 630.10 | 2.03 | 2.11 |
| T10 | 3318.73 | 19 407.75 | 2.03 | 8.2 | 359.26 | 431.20 | 2.03 | 1.65 |
| T11 | 1564.85 | 9151.17 | 2.33 | 8.2 | 325.40 | 403.70 | 1.99 | 2.21 |
| T12 | 2093.72 | 12 243.98 | 2.01 | 8.2 | 257.95 | 311.60 | 1.99 | 2.28 |
| T13 | 3441.67 | 20 126.69 | 2.03 | 8.2 | 363.48 | 662.30 | 1.97 | 2.45 |
| T14 | 4171.15 | 24 392.67 | 2.09 | 8.3 | 370.11 | 802.40 | 2.02 | 1.33 |
| Mean | 2403.04 | 18 672.12 | 1.92 | 7.86 | 351.27 | 617.66 | 2.01 | 2.01 |
RNA quality
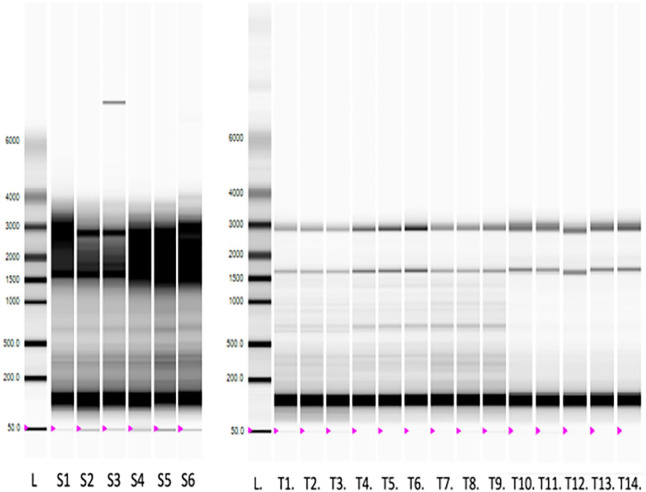
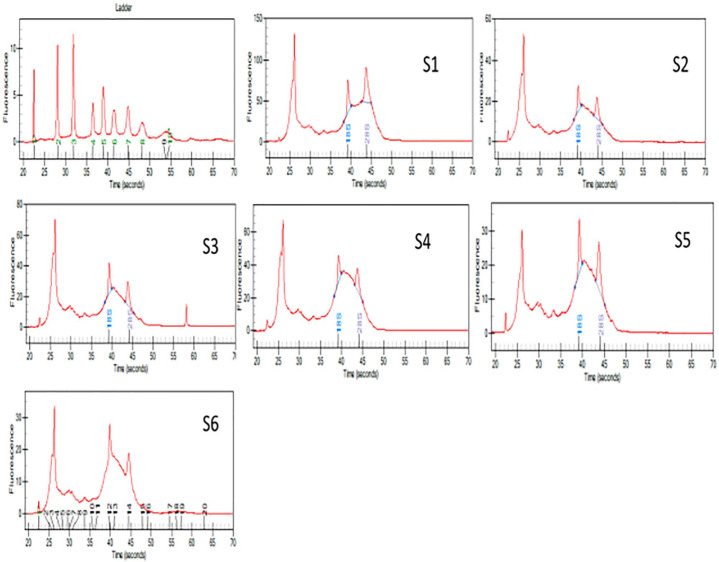
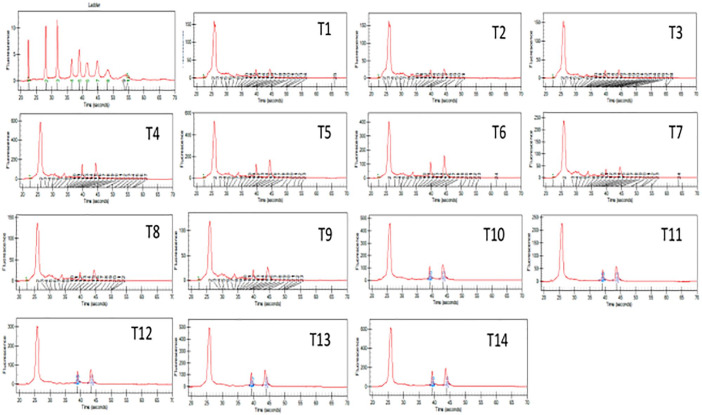
The A260/A280 absorbance ratio for samples prepared using the TRIzol method (average, 2.0) was comparable with that of samples isolated using the column-based extraction method (average, 2.1). However, a significantly higher A260/A230 absorbent ratio was achieved with the TRIzol method (average, 2.0) compared with the spin column–based method (average, 0.15). Finally, the quality of the RNA was also evaluated using an Experion Bioanalyzer. As per these results, average RQI of 7.9 was acquired with our TRIzol protocol compared with an RQI of 7.6 with the spin column–based method (Table 2; Figures 2–4).
Figure 2.
A virtual gel view derived from Experion Bioanalyzer software.
Figure 3.
Graphs showing picks for 18s and 28s human RNA expression for samples S1 to S6 in Experion Bioanalyzer. To maintain synergy with TRIzol method, on-column DNase treatment was not performed.
Figure 4.
Graphs showing picks for 18s and 28s human RNA expression for samples T1 to T14 in Experion Bioanalyzer.
Correlation matrix
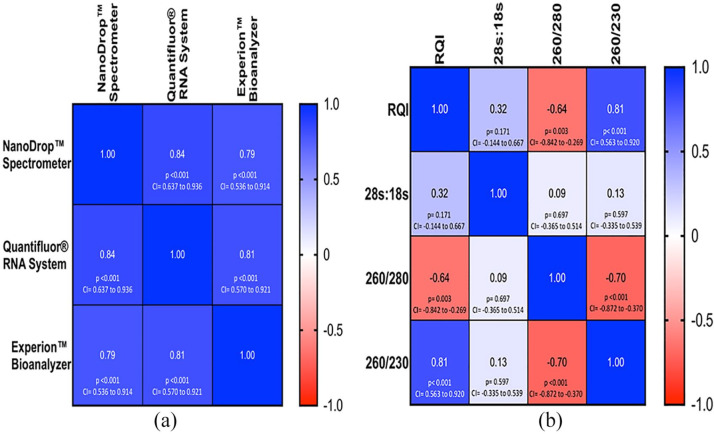
We evaluated the correlation between various parameters of RNA quantity and quality using different methods. All 3 methods for RNA quantification showed a very strong positive correlation with each other (r = 0.79-0.84) (Figure 5A). The RQI and A260/A230 ratio showed a very strong positive correlation (r = 0.81) compared with a negative correlation between RQI and A260/A280 ratio (r = −0.64) (Figure 5B).
Figure 5.
(A) A heat-map showing the correlation between three methods of RNA quantification and (B) four parameters representing the RNA quality.
Reverse transcription quantitative polymerase chain reaction
Results showing the cycle number (quantification cycle [Cq]) and melt curves are displayed in Figure 6, Figure 7, and Table 3. Using 10 random samples isolated with modified TRIzol protocol, we found the mean Cq values (SD) were 22.6 (1.06) for ACTB, 21.9 (0.90) for IL1B, 28.2 (0.77) for ALPL, and 30.4 (1.18) for RUNX2 (Figure 6; Table 3).
Figure 6.
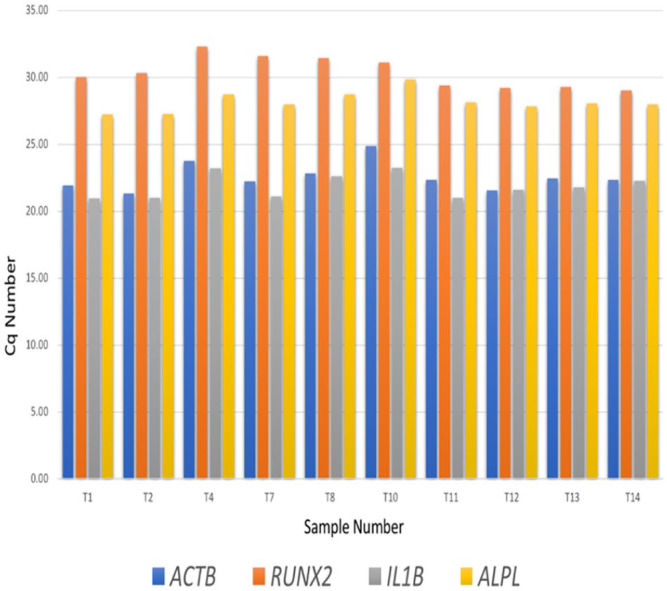
Cq values for RT-PCR of randomly selected ten RNA samples prepared using TRIzol™ method.
Figure 7.
Melt curve of all samples with respective genes.
Table 3.
Quantification cycle values of individual sample for the specific genes.
| Sample No. | ACTB | IL1B | ALPL | RUNX2 |
|---|---|---|---|---|
| T1 | 21.92 | 20.98 | 27.225 | 30.04 |
| T2 | 21.33 | 20.99 | 27.27 | 30.31 |
| T4 | 23.78 | 23.185 | 28.73 | 32.32 |
| T7 | 22.22 | 21.1 | 27.97 | 31.6 |
| T8 | 22.84 | 22.6 | 28.715 | 31.43 |
| T10 | 24.87 | 23.225 | 29.84 | 31.105 |
| T11 | 22.36 | 21.005 | 28.12 | 29.38 |
| T12 | 21.57 | 21.58 | 27.845 | 29.22 |
| T13 | 22.46 | 21.795 | 28.04 | 29.265 |
| T14 | 22.34 | 22.26 | 27.98 | 29.02 |
Discussion
To further advance the use of saliva transcriptomes for translational and clinical applications, we aimed to develop a robust protocol for RNA isolation without compromising the product yield and quality. Based on NanoDrop measurements using our modified TRIzol protocol, we achieved total RNA content (approximately 46-fold) and RNA concentration (approximately 32-fold) compared with the column-based method. We further validated our results using the QuantiFluor RNA dye, which also showed higher RNA concentration (16-fold) with the modified TRIzol protocol in comparison with the column-based technique (Table 2).
Isolation methods that prevent RNA degradation are of great importance for clinical studies in which tissue samples often cannot be immediately processed. In these settings, extracted RNA is often partly degraded and may not be suitable for in vivo gene expression analysis. Differences in sample handling and RNA quality could, therefore confound gene expression analysis.13 The degree to which this variability in degradation affects estimates of gene expression levels is not well understood. Historically, RNA integrity has been evaluated using gel electrophoresis. However, this approach is subjective and relies on human interpretation of the gel images.14 To overcome these issues, standardized RNA quality metrics such as the degradometer, RQI, or RNA integrity Number (RIN) provide well-defined empirical methods to assess and compare sample quality.
Studies that examine gene expression assayed through RT-qPCR infrequently report the effect of RNA quality on results.15 Conversely, microarray-based studies have repeatedly reported significant effects of variation in RNA quality or quantity on gene expression levels, even after applying standard normalization approaches.13 Thus, it is critical to consistently isolate high-quality RNA for use with such experimental techniques.
Nucleic acids have traditionally been quantified using UV absorption at 260 and 280 nm with a spectrophotometer. The wavelength with maximum absorption for RNA is 260 nm, and the ratio of the absorbance at 260 and 280 nm is used to assess the RNA purity. Pure RNA has an A260/A280 of approximately 2.0.16 With both our modified TRIzol protocol and with the column-based method, we achieved a similar A260/A280 ratio. The A260/A230 absorbance ratio is another parameter to assess RNA quality and should be close to 2.0.16 Lower A260/A230 absorbance ratios indicate contamination with chaotropic salts, phenol, or protein in the RNA solution. This ratio was 2.0 for our modified TRIzol protocol compared with 0.15 with the column-based method (Table 2). We further evaluated our samples using the Experion Bioanalyzer. We succeeded in achieving a high integrity of RNA using our modified protocol (average RQI = 7.9), which is comparable with that of the column-based method (average RQI = 7.6) (Table 2; Figures 2–4). This result is in contrast with the study published by Pandit et al17 that showed RNA isolated with RIN values in the range of 2.4 to 2.6 from cell-free salivary supernatant with the QIAzol method. Contradiction in these results might be due to extra chloroform steps involved in our in-hour TRIzol protocol, which might have eliminated any potential contaminants from the solution. Furthermore, with the bioanalyzer, RNA is considered high quality when the ratio of the 28S:18S bands is about 2.0 and higher.14 Using our modified TRIzol protocol, we could achieve a mean 28S:18S ratio of 1.9 compared with 1.2 for the column-based method (Table 2).
We also examined the correlation (Pearson correlation test) between the 3 methods of RNA quantification. Statistical analysis showed that all 3 methods showed strong correlation (r = 0.79-0.84) (Figure 5A). NanoDrop and QuantiFluor dye showed significant excellent correlation of 0.84 (P < .001, 95% confidence interval [CI] = 0.64-0.94), whereas NanoDrop and Bioanalyzer showed significant good correlation of 0.79 (P < 0.001, 95% CI = 0.54-0.91). Significantly excellent correlation (0.81) was observed with QuantiFluor and Bioanalyzer (P < .001, 95% CI = 0.57-0.92). To our surprise, the A260/A280 absorbance ratio was correlated negatively with the RQI (r = −0.64) and it was statistically significant (P = .003, 95% CI = −0.84 to −0.27). Thus, these results suggest that with an increase in the A260/A280 absorbance ratio, it is more likely that the degraded RNA also increases in the sample. It was also an interesting observation that the A260/A230 absorbance ratio was strongly correlated with the RQI numbers (r = 0.81, P < .001, 95% CI = 0.56-0.92) (Figure 5B). Due to the lack of studies focusing on correlation between these parameters, we do not have data to compare our results. In the future, examining a large number of RNA samples and running a similar kind of analysis will provide stronger evidence to support or question our results.
Conclusion
Our modified TRIzol protocol is a reproducible method to extract high-yield and high-quality RNA from whole human saliva. Also, we put forth few interesting observations regarding the correlation between different parameters determining the quality of RNA. While our modified TRIzol protocol method has few additional steps, overall it is advantageous in isolating RNA with higher concentration and good quality (RQI >7.0).
Footnotes
Funding:The author(s) disclosed receipt of the following financial support for the research, authorship, and/or publication of this article: This study was supported by Dr. Charles J. Burstone Foundation Award.
Declaration of conflicting interests:The author(s) declared no potential conflicts of interest with respect to the research, authorship, and/or publication of this article.
Author Contributions: 1. VG, MH, SY: Concept or design of the work; or acquisition, analysis, or interpretation of data.
2. VG, SY: Drafted the article or revised it critically for important intellectual content.
3. VG, MH, SY: Approved the version to be published.4. VG, MH, SY: To take public responsibility for appropriate portions of the content.
ORCID iD: Sumit Yadav  https://orcid.org/0000-0002-2434-7995
References
- 1. Biomarkers and surrogate endpoints: preferred definitions and conceptual framework. Clin Pharmacol Ther. 2001;69:89-95. [DOI] [PubMed] [Google Scholar]
- 2. Ilyin SE, Belkowski SM, Plata-Salamán CR. Biomarker discovery and validation: technologies and integrative approaches. Trends Biotechnol. 2004;22:411-416. [DOI] [PubMed] [Google Scholar]
- 3. Fábryová H, Celec P. On the origin and diagnostic use of salivary RNA. Oral Dis. 2014;20:146-152. [DOI] [PubMed] [Google Scholar]
- 4. Zhang L, Xiao H, Wong DT. Salivary biomarkers for clinical applications. Mol Diagn Ther. 2009;13:245-259. [DOI] [PubMed] [Google Scholar]
- 5. Drobitch RK, Svensson CK. Therapeutic drug monitoring in saliva. An update. Clin Pharmacokinet. 1992;23:365-379. [DOI] [PubMed] [Google Scholar]
- 6. Haeckel R, Hanecke P. The application of saliva, sweat and tear fluid for diagnostic purposes. Ann Biol Clin (Paris). 1993;51:903-910. [PubMed] [Google Scholar]
- 7. Jusko WJ, Milsap RL. Pharmacokinetic principles of drug distribution in saliva. Ann New York Acad Sci. 1993;694:36-47. [DOI] [PubMed] [Google Scholar]
- 8. Lee YH, Wong DT. Saliva: an emerging biofluid for early detection of diseases. Am J Dent. 2009;22:241-248. [PMC free article] [PubMed] [Google Scholar]
- 9. Loo JA, Yan W, Ramachandran P, Wong DT. Comparative human salivary and plasma proteomes. J Dent Res. 2010;89:1016-1023. [DOI] [PMC free article] [PubMed] [Google Scholar]
- 10. Ali N, Rampazzo RCP, Costa ADT, Krieger MA. Current nucleic acid extraction methods and their implications to point-of-care diagnostics. Biomed Res Int. 2017;2017:9306564. [DOI] [PMC free article] [PubMed] [Google Scholar]
- 11. Cheranova D, Gibson M, Chaudhary S, et al. RNA-seq analysis of transcriptomes in thrombin-treated and control human pulmonary microvascular endothelial cells. Journal of Visual Experiments. 2013;72:4393. [DOI] [PMC free article] [PubMed] [Google Scholar]
- 12. Granger DA, Johnson SB, Szanton SL, Out D, Schumann LL. Incorporating salivary biomarkers into nursing research: an overview and review of best practices. Biol Res Nurs. 2012;14:347-356. [DOI] [PMC free article] [PubMed] [Google Scholar]
- 13. Gallego Romero I, Pai AA, Tung J, Gilad Y. RNA-seq: impact of RNA degradation on transcript quantification. BMC Biology. 2014;12:42. [DOI] [PMC free article] [PubMed] [Google Scholar]
- 14. Schroeder A, Mueller O, Stocker S, et al. The RIN: an RNA integrity number for assigning integrity values to RNA measurements. BMC Molecular Biology. 2006;7:3. [DOI] [PMC free article] [PubMed] [Google Scholar]
- 15. Fleige S, Pfaffl MW. RNA integrity and the effect on the real-time qRT-PCR performance. Mol Aspects Med. 2006;27:126-139. [DOI] [PubMed] [Google Scholar]
- 16. Desjardins P, Conklin D. NanoDrop microvolume quantitation of nucleic acids. Journal of Visual Experiments. 2010;45:2565. [DOI] [PMC free article] [PubMed] [Google Scholar]
- 17. Pandit P, Cooper-White J, Punyadeera C. High-yield RNA-extraction method for saliva. Clin Chem. 2013;59:1118-1122. [DOI] [PubMed] [Google Scholar]


