

Abstract
The scientific value of a mouse model with a targeted mutation depends greatly upon how carefully the mutation has been engineered. Until recently, our ability to alter the mouse genome has been limited by both the lack of technologies to conditionally target a locus and by conventional cloning. The “cre/loxP” and “recombineering” technologies have overcome some of these limitations and have greatly enhanced our ability to manipulate the mouse genome in a sophisticated way. However, there are still some practical aspects that need to be considered to successfully target a specific genetic locus. Here, we describe the process to engineer a targeted mutation to generate a mouse model. We include a tutorial using the publicly available informatic tools that can be downloaded for processing the genetic information needed to generate a targeting vector.
Keywords: Gene targeting, targeting vector, recombineering, cre/loxP, mouse
1. Introduction
Gene targeting in the mouse is a powerful technology that allows the study of gene function in mammals (1-4). Its initial application was for the establishment of in vivo genetic models for the phenotypic analysis of genes considered developmentally important. This was achieved by inactivating a specific gene in the mouse germline. Other more complex applications include the introduction of genetic mutations to mimic pathological conditions in humans or the replacement of one gene with another to investigate common genetic functions. Currently, it is fairly common to introduce reporter genes (e.g., LacZ, GFP, (5-7)) into a locus to pursue gene expression studies or to insert recombination recognition sites (loxP and Frt sites) that allow inactivation of a gene conditionally or induce chromosomal rearrangements (8-11). These applications have been made possible and have been greatly facilitated by the development of the cre/loxP and more recently the “recombineering” technologies (see Chapter 2, this volume, (12-16)). However, some basic concepts must be considered when designing a targeting strategy, irrespective of the type of mutation to be utilized.
A common misconception among investigators that are new to gene targeting in mouse embryonic stem (ES) cells is that a gene targeting strategy merely requires two fragments of DNA flanking the genomic sequence of interest to be modified and a selectable marker to identify correctly targeted ES cells. Indeed, while this constitutes the basic concept of homologous recombination in ES cells, there are a number of criteria that the investigator must consider to successfully target a specific locus. A few examples include, the length of genomic sequence used in the vector; the mouse strain of the genomic DNA; the selectable markers used in the vector and the overall design of a screening strategy to identify correctly targeted ES cells. While this may appear complicated at first, the availability of the DNA sequence of both the mouse and human genomes has greatly facilitated this task (17-19). In this chapter, we describe in detail the steps involved in designing a targeting vector including how to search and obtain sequence information from the publicly available genome database.
2. Methods
In order to design a targeting vector, the researcher must first obtain the cDNA and the genomic DNA sequences of the gene of interest to analyze the characteristics of the locus under investigation. Most of these data are available in computed form and can be obtained from public resources such as the UCSC Genome Browser (20, 21). It should be stressed that the investigator should be knowledgeable of the structure and function of the gene to be targeted. This is important when considering which region of the gene should be deleted to most likely result in the successful disruption of that gene. One consideration is the presence of catalytic sites that are essential for the function of the protein. However, it should be noted that deletion of such sites can still potentially generate a protein that has the ability to bind other accessory proteins and could therefore act in a dominant-negative fashion. Moreover, instead of disrupting a gene, deletion of certain exons can potentially generate a modified cDNA through “alternative splicing” creating a functional protein that lacks only the amino acids coded for in the deleted exon/s. In general, we find targeting the first exon a good strategy for completely disrupting a gene, assuming that the Kozak consensus sequence is removed and/or there are no alternative ATG start sites downstream of the targeted exon. Another strategy includes deletion of an exon that potentially leads to an out-of-frame protein.
For those unfamiliar with the tools available to search the genome databases, we include a case study to describe a step-by-step search and retrieval of genetic information from the public database (see Appendix).
2.1. Construct Design
The most common type of DNA vector used for gene targeting in ES cells is the so-called “sequence replacement vector” (22, 23). It includes two DNA fragments flanking a marker gene used for the positive selection of ES cells (see Fig. 8.1, (24)). Several aspects of the vector’s design should be considered when choosing the genomic region to be targeted. These aspects can affect the frequency of the targeting events and/or affect the targeted locus and normal function of surrounding genes (25). These include the following.
Fig. 8.1.
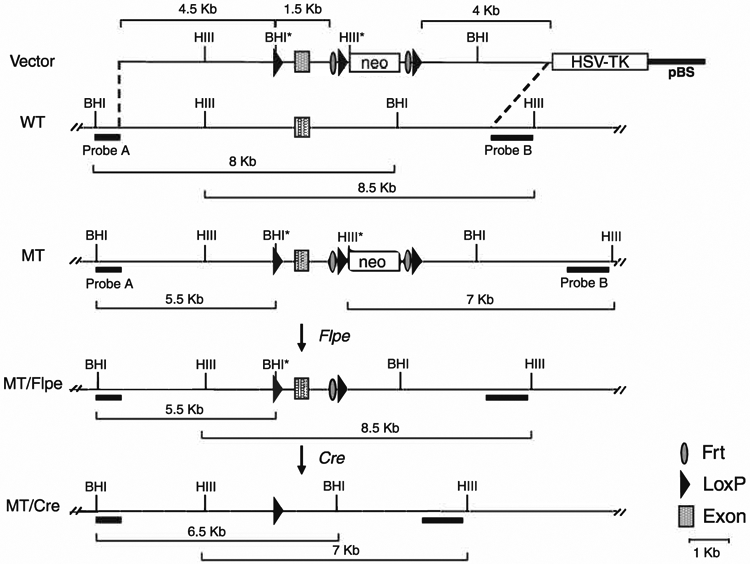
Schematic representation of a representative vector and screening strategy to detect the rearrangements in a specific targeted locus. A targeting vector (top) for conditional removal of the exon of interest has been generated using 4.5 kb and 4 kb of upstream and downstream DNA sequence, respectively. An exogenous BamHI site (BHI*) has been added to the upstream loxP site sequence for screening purposes. A HindIII site (HIII*) present in the neo cassette is also employed for the screening. Note that when the screening strategy has been designed every change in restriction fragment size has been accounted for after each specific recombination event. For example, Probe B detects an endogenous wild-type (WT) band of 8.5 kb that is reduced in size (7 kb) by the addition of the HIII* site present in the neo cassette following homologous recombination. After Flpe-induced recombination to excise the neo cassette the band reverts to the WT 8.5-kb size. However, targeting at the locus is detected by the presence of the 5.5-kb band obtained by BamHI digestion and Probe A. Cre recombination leads to a change of both BamHI and HindIII restriction fragments that are characteristic of the deletion of the exon (6.5 kb and 7 kb respectively). WT, wild-type allele; MT, targeted allele; MT/Flpe, mutant allele after Flpe recombination; MT/cre, mutant allele after Cre recombination; pBS, Bluescript; HSV-TK, thymidine kinase cassette.
2.1.1. Length of Homology Between the Targeting Vector and the Target Locus
The length of homologous DNA sequence incorporated on either side of the targeted region of interest in a targeting vector significantly influences the frequency of homologous recombination. Targeting of the HPRT locus has shown that the length of homology used in the construct can affect the homologous recombination efficiency 100- to 200-fold (22, 26). Ideally, a total of 8–12 kb should be used with the shortest homologous arm being no less than 2 kb in length.
2.1.2. Source of DNA for Vector Construction
The source of the vector DNA should be isogenic to the ES cells used for the targeting (22). Mouse strain-specific polymorphisms at specific loci can greatly reduce the efficiency of homologous recombination if the vector sequence is somewhat different from the ES cells. Most ES cells are from the 129 Sv background because they are the most efficient at colonizing the mouse germline upon injection into recipient blastocysts (27, 28). However, most of the mouse DNA sequence information that is available comes from “bacterial artificial chromosomes” (BACs) of the C57BL/6 background (see below) that have been used for the public sequencing of the mouse genome. For this reason, in our laboratory we have been using a hybrid 129 Sv–C57Bl/6 ES cell line (v6.4 a gift of John Schimenti; (29)) that allows us to use vectors from both 129 Sv and C57BL/6 genetic backgrounds. Most recently, a genome-wide, end-sequenced 129 Sv BAC library has become available for construction of targeting vectors of the 129 Sv background (30) (http://www.geneservice.co.uk/products/sanger/bMQ/bMQ.jsp).
2.1.3. Drug Resistance Marker Genes for Selection
2.1.3.1. Positive Selection
The construct used for targeting a specific locus must contain a drug-selectable marker to easily select for recombinants. The most commonly used positive selection marker is the neomycin phosphotransferase gene (neo) that confers resistance to the neomycin analog, G418. G418 is an aminoglycoside antibiotic produced by Micromonospora rhodorangea that blocks polypeptide synthesis by inhibiting the elongation step in both prokaryotic and eukaryotic cells. Resistance to G418 is conferred by the neo gene that encodes an aminoglycoside 3′-phosphotransferase. Selection in mammalian cells is usually achieved in 3–7 days with concentrations starting from ~300 μg/ml. Rapidly dividing cells are more severely affected; thus, 250–300 μg/ml is effective in killing ES cells that do not contain the neo gene.
Another commonly used selectable marker is the hygromycin B phosphotransferase gene. Hygromycin B is an aminoglycoside antibiotic produced by Streptomyces hygroscopicus. It inhibits protein synthesis by interfering with translocation and causing mistranslation at the 70S ribosome. Hygromycin B is effective against most bacteria, fungi, and higher eukaryotes. Resistance to hygromycin is conferred by the hph gene from E. coli. Hygromycin B is normally used at a concentration of 50–200 μg/ml in mammalian cells and is effective in 2–3 days.
The most widely used selectable marker is the neo gene. Hygromycin is used when a second vector that targets another allele of a gene is required. Other markers for positive selection include genes encoding for resistance to puromycin (inhibits peptidyl transfer on ribosome), Blasticidin S (interferes with the peptide bound formation in the ribosomal machinery), and Zeocin™ (intercalates and cleaves DNA). These markers can be used to introduce multiple targeting events in ES cells. It should be noted that the positive-selectable marker chosen for the vector will influence the type of mouse embryo fibroblast (MEF) feeder layer that is needed to grow the ES cells. For example, if the neo gene is used the feeders must be G418-resistant.
Selectable expression cassettes can easily be obtained from investigators who perform gene-targeting experiments. The main difference between the types of cassettes available is the choice of promoter and the poly-adenylation signal used to control the expression of the selectable marker (31). The phosphoglycerate kinase (PGK) promoter is commonly used with the neo gene. A key element of the promoter used is that it should not be too sensitive to positional effects in the genome to ensure that it will work for the targeted genes that are not expressed in ES cells. The orientation by which the positive selection cassette is inserted in the targeted locus does not matter. After the initial targeting and transmission through the mouse germline the cassette should be removed via cre or flpe recombination to prevent its regulatory elements from affecting the transcription of neighboring genes confounding the phenotypic analysis (25).
2.1.3.2. Negative Selection
Negative selection markers are used to reduce the number of transfected cells containing the exogenous sequence inserted at random loci (32). The most commonly used marker is the thymidine kinase (TK) gene of the herpes simplex virus (HSV). If the TK gene is incorporated into the genome, it confers sensitivity to gancyclovir (2′-nor-2′deoxyguanosine) or FIAU [1-(2’-deoxy-2’fluoro-b-D-arabinofuranosyl)-5-iodouracil]. These drugs are specific inhibitors of HSV by acting as nucleotide analogues that inhibit cellular growth following incorporation into DNA.
In order for these analogues to be incorporated into DNA, they must be phosphorylated by the TK gene. In the absence of the TK gene, the drug phosphorylation is limited. Low concentrations of gancyclovir or FIAU have no effect on cells. Therefore, the sensitivity of cells to gancyclovir is dependent upon the presence of the HSV tk gene product.
The TK gene is placed at one end of the targeting vector adjacent to one end of the two DNA homology arms. Following a homologous recombination event, the TK is not recombined into the region and the correctly targeted ES cell will be resistant to both G418 (because it has incorporated the neo gene) and gancyclovir or FIAU (because TK is not incorporated during the homologous recombination process) (Fig. 8.1).
Another negative selection marker is the diphtheria toxin A-fragment gene (DT-A) that exerts toxicity by inhibiting ADP-ribosylation of elongation factor 2 upon protein synthesis (33). Thus, contrary to the gancyclovir or FIAU it does not have mutagenic potentials and should enhance karyotype stability. The DT-A gene works with the same principle as the TK negative selection gene. The main difference is that if the DT-A gene is randomly incorporated into the genome by non-homologous recombination it will produce diphtheria toxin that kills the cell without the need to add any drug to the cultured cells. A negative selection strategy employing either the TK gene or the DT-A gene can enrich the ratio of homologous recombinant clones by 3–10 fold.
2.1.4. Screening Strategy
The importance of designing a screening strategy to identify homologous recombinant clones cannot be overstated and it should be an integral part of the vector design process. A screening strategy design can include a Southern blotting or PCR methodology for detection of homologous recombination events. Screening by Southern blotting is far superior in assuring that the correctly targeted clones are identified and helps avoid false-positives. We highly recommend that this type of screening be used at least in the initial phases of the analysis. For Southern analysis, specific restriction enzyme digestions should be chosen to recognize homologous recombination events involving the targeting vector (see Note 1). Moreover, two probes, one 5’ and one 3’, should be identified external to the targeting vector sequence. This means that the probes should not hybridize to the targeting vector. This insures identification of rearrangements that occur only in the targeted locus following the homologous recombination event (Fig. 8.2E) without detecting random integrations of the vector in the genome (Fig. 8.2D). The restriction enzymes for DNA digestion should be chosen that cut the DNA upstream of the 5’ probe or downstream of the 3’ probe. This allows for detection of rearrangements caused only by homologous recombination events in the targeted locus. A rearrangement can be detected when insertion of the selection cassette (e.g., neo) causes the restriction enzyme fragment to increase in size. However, most times the design of a screening strategy can take advantage of the presence of a restriction enzyme site that is located within the selection cassette itself (see in Fig. 8.1 the HindIII restriction fragment detected with probe B goes from 8.5 kb in the WT allele to 7 kb in the mutant allele) or a site can be intentionally added when a loxP recombination sequence is included in the targeting vector (see for example the BamHI * site added to the loxP site in Fig. 8.1 that causes the DNA fragment detected with Probe A to go from 8 kb to 5.5 kb). In general it is advisable to include a restriction enzyme site adjacent to the isolated loxP site to have appropriate means to detect its presence. Some investigators rely on PCR to screen for the presence of a loxP site. However, this can lead to the detection of false-positive clones if the vector has integrated randomly into another site of the genome in addition to the targeted locus. Lastly, when a conditional allele is generated the investigator should include a strategy for detecting rearrangements at both the 5′ and 3′ ends of the construct not only before but also after cre and Flp recombination (Fig. 8.1).
Fig. 8.2.

Screening of probes for Southern analysis. Testing of probes for the presence of repetitive sequence (A–C). The probe in (A) is completely free of repetitive sequence, hence only one clear band is detected by Southern blot hybridization. On the contrary, blots tested in (B) and (C) have different levels of repetitive sequence as shown by the smear detected in the blot. Note that even the moderate presence of repetitive sequence (B) does not allow the use of this probe for analysis. Southern blot analysis of ES cell DNA samples using a probe internal to the targeting vector (D) detects bands in almost every lane of the blot (*) in addition to the wild-type band (arrowhead). Using a probe that is external to the targeting vector allows detection of a re-arranged band in ES cell clones in which one allele underwent homologous recombination (*, E). Note that the band from the targeted allele has intensity similar to that of the wild-type allele (arrowhead). Equal molarity of the two bands is a sign of clonality. Only clones with two bands of similar intensity should be pursued for injection into recipient blastocysts.
2.1.5. Probes
As mentioned above, the probes for the screening strategy should not be part of the targeting vector sequence to allow detection of homologous recombination events at the targeted locus. Moreover, it is critical that the probes are free of repetitive elements whose presence results in a smear on the Southern blot (Fig. 8.2B,C). The probes can be synthesized by PCR but even if the sequence from which they are chosen appears repeat-free they should be tested on a blot because computer programs may not recognize all types of repeats. Even a small stretch of repeats in a probe could prevent its use in Southern blot analysis (Fig. 8.2B).
2.1.6. Vector DNA Sequence
2.1.6.1. Repetitive Elements
Repetitive sequence should be avoided not only when choosing a probe for screening but also when designing the targeting vector per se. Almost 50% of the mouse genome is repetitive (34); thus, it is intuitive that having repetitive sequence in the vector increases the chances that it can integrate throughout the genome by aligning its own repeat sequence to other identical and very abundant sequence in the genome. Nevertheless, because almost half of the mouse genome is repetitive, it is sometimes impossible to avoid the presence of repetitive sequences in a vector. Therefore, during the designing phase, the investigator should choose a region with as few repeats as possible.
2.1.6.2. Sequence Analysis
If the objective of the gene targeting is the simple inactivation of a gene by deletion of a specific genomic region, the task is fairly simple. The vector can include two DNA homology arms that flank the region to be deleted. However, currently it is advisable to generate a vector that targets a gene in a conditional manner by using the cre-loxP/Flpe-Frt technology. This requires the placing of the loxP/Frt sites and the neo selectable marker in an intronic region that does not interfere with the transcription or splicing of the targeted gene. In fact, the objective is to include these elements in such a way as to keep the gene functional until it can be inactivated by the precise spatio-temporal expression of the cre or Flpe recombinases. The most common approach is to include a neo cassette flanked at each end by both Frt and loxP sites and adding an additional isolated loxP site flanking one or more exons (e.g., Fig. 8.3). However, intronic regions can contain regulatory elements that control the transcription or splicing of a gene. The best approach in choosing where to insert the loxP and the neo cassette, while limiting the chances of disrupting the gene, is to align and compare the mouse and human genomic DNA sequence (publicly available; see below) in the area to be targeted. This analysis often reveals surprisingly high conservation in intronic areas in addition to the exons. High conservation between species indicates the functional relevance of these regions. Moreover, as a general rule the neo cassette and the loxP site should be placed at least 200–300 bp away from the targeted exon because even if there is no obvious conservation between species these elements could nevertheless interfere with the splicing machinery.
Fig. 8.3.

Homologous recombination often leads to the loss of the targeting vector loxP sequence if situated too far away from the neo selectable cassette. (A) Example of homologous recombination event leading to the integration of the neo selectable marker and the upstream loxP site with the artificial BamHI site (BHI*). Retention of the loxP site from the targeting vector becomes more difficult during the homologous recombination process if it is situated more than 2 kb away from the selectable marker (B). Shaded areas indicate the regions between the vector and the targeted locus where homologous recombination occurs. When homologous recombination occurs in the region between the loxP site and the neo cassette the lox P site is not recombined into the locus (B). Abbreviations are as in Fig. 8.1.
2.1.7. Transfection
The DNA vector should be linearized to facilitate stable integration into the genome by DNA recombination. The preferred method for introducing DNA into ES cells is by electroporation because it allows the introduction of only a few molecules of DNA per cell. This reduces the chances of multiple random integrations of the DNA vector into an ES cell genome that can interfere with the selection process. For example, even if homologous recombination can occur at the targeted locus the random integration of only one other copy of the vector in the genome would cause the ES cell clone to die because of the insertion of the negative selection marker (TK or DT).
2.2. Summary
An ideal construct should have the following characteristics (Fig. 8.4):
Fig. 8.4.
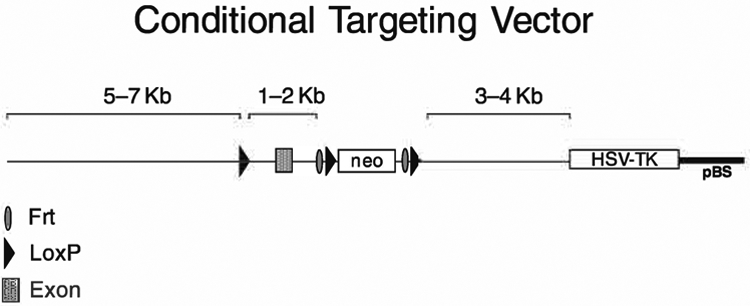
Example of an ideal representative targeting vector for conditional deletion of an exon. Note that the orientation of the construct can be either 5′ to 3′ or 3′ to 5′. The positive and negative selectable markers can be different than the ones indicated (see text).
DNA sequence used for the vector should be isogenic to the mouse ES cells used for targeting.
-
Length of DNA sequence homologous to the locus under investigation must range between 7 kb and 12 kb (8–12 kb optimal) with the shortest arm being no less than 2 kb.
A loxP site added to generate a conditional allele should be placed approximately 1–2 kb away from the neo cassette. If placed at a distance greater than 2 kb the chances of “losing” it during the homologous recombination process can be very high because the sequence between the loxP and the neo cassette can undergo homologous recombination with exclusion of the loxP site (see Fig. 8.3). Greater distances, up to 5 kb, can be acceptable if the homologous recombination frequency at the targeted locus is high (30–50%). The “isolated” loxP site can get “lost” during recombination because there is no selection for the retention of this site.
- Selectable markers:
- Neomycin gene (possibily pGKneobpA) for positive selection (selection: 300 μg/mL active G418),
- DT-A (requires no drug for selection) or thymidine kinase gene (possibily pGK TK) for negative selection (selection: 5 μM FIAU).
Restriction enzyme strategy for screening homologous recombination events at both 5′ and 3′ ends of the construct.
Restriction enzyme strategy for screening homologous recombination events at both 5′ and 3′ ends of the construct before and after cre recombination (if applicable).
At least one probe must be external to the genomic DNA sequence used to create the targeting vector.
Unique restriction site for linearization of the vector prior to electroporation.
3. Notes
The best restriction enzymes for screening are those that require high salt concentrations. When designing the screening strategy it is desirable to include enzymes such as BamHI, BglI, BglII, EcoRV, HincII, HindIII, NcoI, NdeI, NotI, PstI, SpeI, ScaI, and StuI. Other enzymes such as EcoRI and XbaI are more sensitive to impurities and salt concentration variations and should be avoided if possible. However, these enzymes can be used if the DNA is purified by the phenolchloroform procedure (see Chapter 9).
Acknowledgments
We thank Eileen Southon for critical reading of the manuscript. “This research was supported by the Intramural Research Program of the NIH, National Cancer Institute.”
4. Appendix
How to search and navigate the public databases to obtain and analyze the DNA sequence required to generate a targeting vector.
Case Study: Search and analysis of the genomic sequence of the Cytip/Pscdbp gene.
The task includes retrieving the mouse genomic DNA sequence to design a vector disrupting the exon with the start codon (ATG) of Pscdbp.
Step 1: Retrieve the mRNA of the Pscdbp gene. This will provide the information to identify the ATG initiation codon relative to the genomic sequence. Tool: NCBI GeneBank.
Step 2: Identify the genomic structure of the Pscdbp gene. The genomic structure of a gene is important to see the size of the individual exons and introns and whether there are clusters of exons that can be targeted to maximize the amount of cDNA sequence deleted. As indicated above, there are limitations to the amount of genomic sequence that can be flanked by loxP sites (ideally 1–2 kb; Fig. 8.4). Thus, the clustering of multiple exons within a few kilobases of genomic sequence may represent a good area to be targeted. Tool: UCSC Genome Browser.
Step 3: Obtain 15 kb of genomic DNA sequence upstream and downstream of the Pscdbp’s ATG start site with repetitive regions identified within this 30-kb region. Once the exon/s to be targeted are identified (in this case the ATG containing exon), 30 kb of DNA sequence must be downloaded to perform a detailed analysis of restriction enzyme sites (for the screening strategy), to identify repetitive sequence (to be avoided in the generation of probes and possibly to limit in the sequence chosen for the vector) and for genomic sequence comparison among species (to help choose the site for insertion of the loxP sites and the selectable marker cassette). Tool: UCSC Genome Browser.
Step 4: Characterize the genomic DNA sequence.
Map the restriction enzyme sites. Tool: NEBcutter v2.0.
-
Compare the genomic locus among species (mouse vs. human).
Tool: UCSC Genome Browser or Vista.
Step 1: Get mRNA of Pscdbp gene
-
1.1.
Go to NCBI GenBank (http://www.ncbi.nlm.nih.gov) (20).
-
1.2.
Select “Gene” database, type “Pscdbp” and then click “Go” (see Fig. 8.5).
-
1.3.
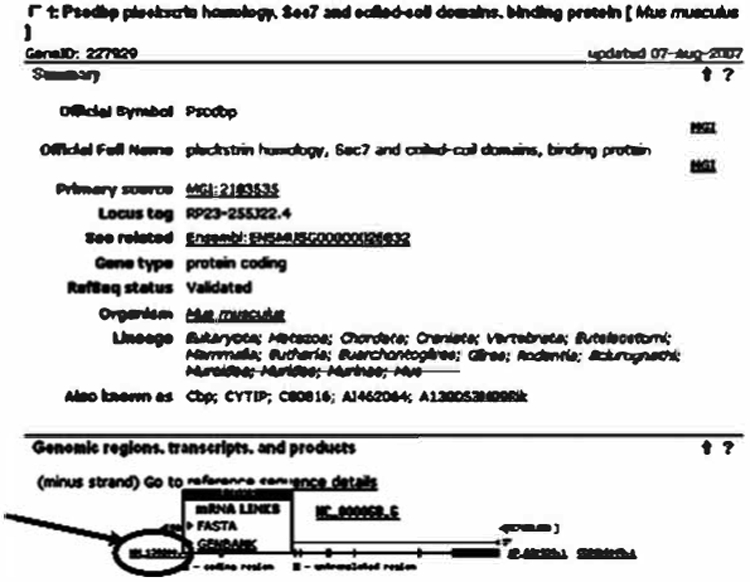
Choose the mouse gene (Mus Musculus) Cytip (also known as Pscdbp) from the list. The description for Cytip will appear.
-
1.4.
From the “Genomic regions, transcripts, and products” section click the accession number (i.e., NM_139200). From the mRNA links “GenBank” or “FASTA” format will appear (see Fig. 8.6).
-
1.5.
Click “GenBank” to obtain the sequence in GenBank format. The output shows annotations of the mRNA such as gene size (i.e., 5735 bases), exons (e.g., exon 1 goes from 1 to 241), and CDS (coding sequences start at nucleotide 68 and end at nucleotide 1147 of the last exon. The rest of the 5735 mRNA nucleotides are untranslated region). At this step, confirm the CDS start position as 68 nt for Pscdbp (see Fig. 8.7).
-
1.6.
In the “Display” links window, click “FASTA” to obtain the sequence in FASTA format. Save the sequence as a text file, such as Simple Text in Mac and NotePad in Windows, in your computer for later usage. If you use MS Word, use “save as Plain text option”. FASTA format is a popular sequence format, and many bioinformatics tools accept this format. FASTA format file starts with a “>” followed immediately by a name, and the next fine begins the sequence with fixed length (see Fig. 8.8).
Fig. 8.5.
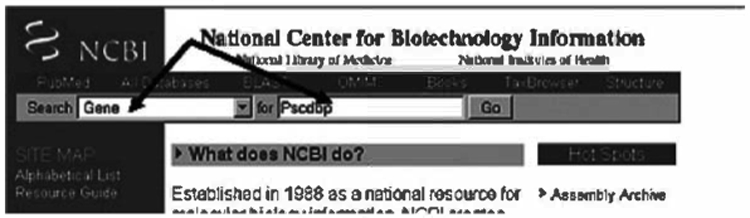
Entry window into the NCBI gene database.
Fig. 8.6.
Selection of the Genbank format via the accesssion number (arrow).
Fig. 8.7.
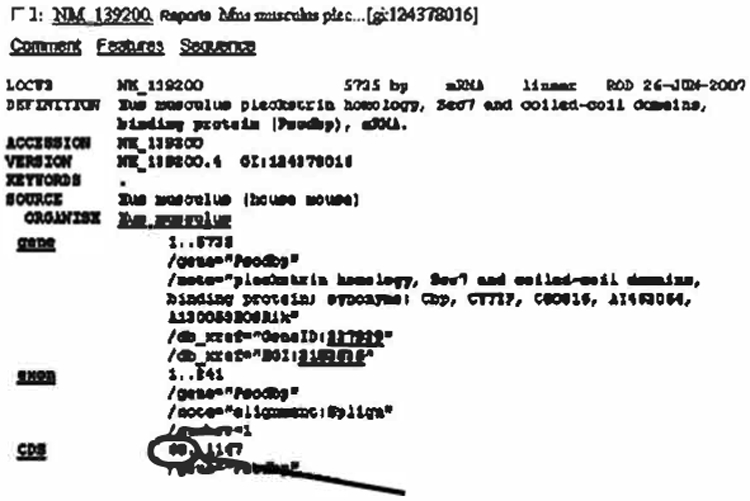
Selection of the start codon of the Pscdbp gene (arrrow).
Fig. 8.8.
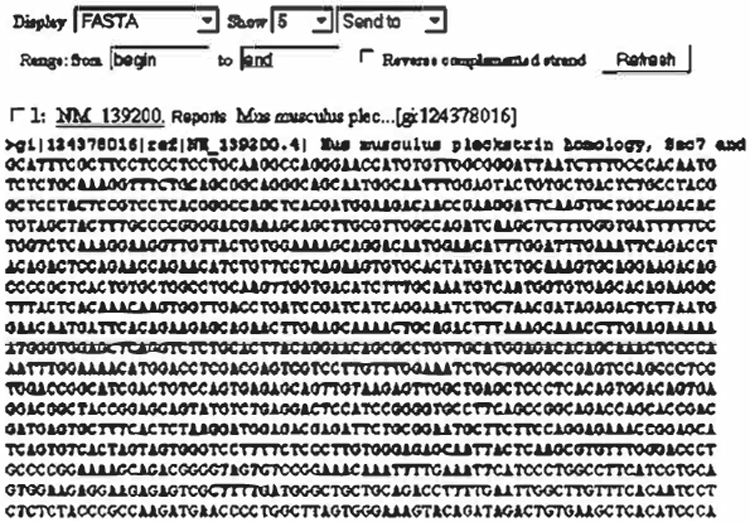
View of the Pscdbp mRNA in the FASTA format.
Step 2: Identify genomic structure (exon/intron, ATG site) of Pscdbp gene
-
2.1.
Go to UCSC Genome Browser (http://genome.ucsc.edu) (21).
-
2.2.
Click “Blat” at the top bar to run a sequence alignment program (35) against mouse genome (see Fig. 8.9).
-
2.3.
Choose Mouse genome and paste the FASTA format sequence of NM_139200 (from Step 1.6). Click “Submit” (see Fig. 8.10).
-
2.4.
Choose the best scoring alignment at the top (i.e., 5728). Notice that this gene is on the (−) strand (see Fig. 8.11).
-
2.5.
Click “details” to view the alignment. The cDNA entered appears at the top in blue upper-case letters. Scroll down to the retrieved genomic sequence where the exons are represented in upper-case blue letters and the intronic regions are lower-case black letters. Highlight, copy, paste, and save the ATG exon (targeted exon) for further analysis. Scroll down further to see the alignment with mouse chromosome 2. You can confirm the ATG initiation position at 68 nt of NM_139200 (Step 1–5) is at chr2:58012466 (see Fig. 8.12).
-
2.6.
Return to previous page to get to the BLAT search results and click “browser” to view the graphical presentation of gene structure. You can zoom in, zoom out, or move the window by clicking “1.5x” or “<” signs (see Fig. 8.13).
Fig. 8.9.

The BLAT search tool of the UCSC genome browser.
Fig. 8.10.

Submission of the Pscdbp FASTA format sequence to the BLAT search.
Fig. 8.11.

Selection of the top alignment from the BLAT search results (circles).
Fig. 8.12.
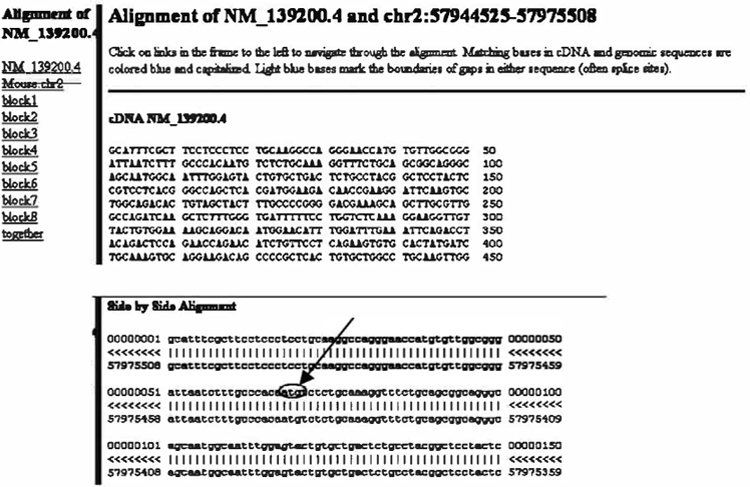
Detailed view of the top alignment and identification of the Pscdbp start codon (arrow).
Fig. 8.13.

View of the Pscdbp gene structure on the UCSC genome browser.
Step 3: Obtain +/−15 kb genomic sequence from Pscdbp’s ATG site with information about repetitive regions
-
3.1.
Select BLAT and paste the sequence of the exon of interest in the box. Click SUBMIT. This takes you to the BLAT Search Results. Click “browser” to get assembly information about the specific exon of interest as in Step 2.6 (see Fig. 8.14).
-
3.2.
Click DNA from the top menu. In the boxes indicated type in 15,000 bp upstream and downstream of your exon.
Check “All upper case”; check the “Mask repeats”, and “to lower case” boxes.
Check “Reverse complement (get “−” strand)” box (because the exon of interest is on the “−” strand).
Click “get DNA” (see Fig. 8.15).
-
3.3.
This sequence is the genomic region 15 kb upstream and downstream of your exon. The lower-case letters represent repeats masked by repeatMasker (36). You should copy and paste this sequence into a word document. You will use it for designing your targeting construct and genotyping strategy. Since there is no numbering you can find the location of the ATG-containing exon by doing a search in the word document with a small stretch of sequence from the beginning of the exon. After having located the exon you can see how many repeat sequences (in lower case) are present around the exon to be targeted.
Fig. 8.14.

BLAT search for genomic sequence around exon 1 of the Pscdbp gene.
Fig. 8.15.
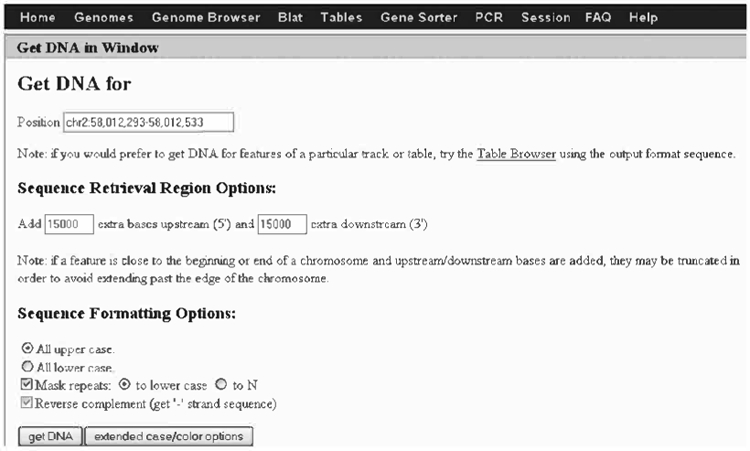
Retrieval of 30 kb genomic sequence around exon 1 of the Pscdbp gene.
Step 4a: Map restriction enzyme sites
To view cutting sites of major restriction enzymes in the genomic region use NEBcutter v2.0.
-
4a.1.
Go to the New England BioLabs homepage (http://www.neb.com) and choose NEB CUTTER from the menu at the bottom of the page or go to NEBcutter v2.0 directly (http://tools.neb.com/NEBcutter2/index.php).
-
4a.2.
Paste your 30 kb genomic sequence in the box, name your sequence in the box provided (optional), check “All commercially available specificities”, and click “Submit” (see Fig. 8.16).
-
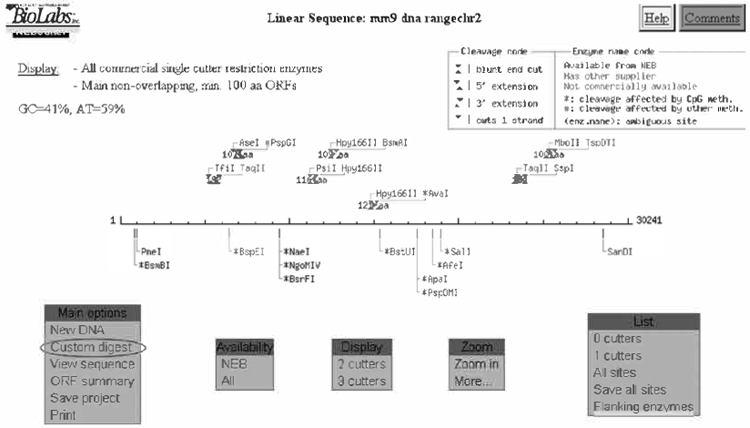
4a.3.
The linear sequence for Pscdbp will appear (see Fig. 8.17).
Fig. 8.16.
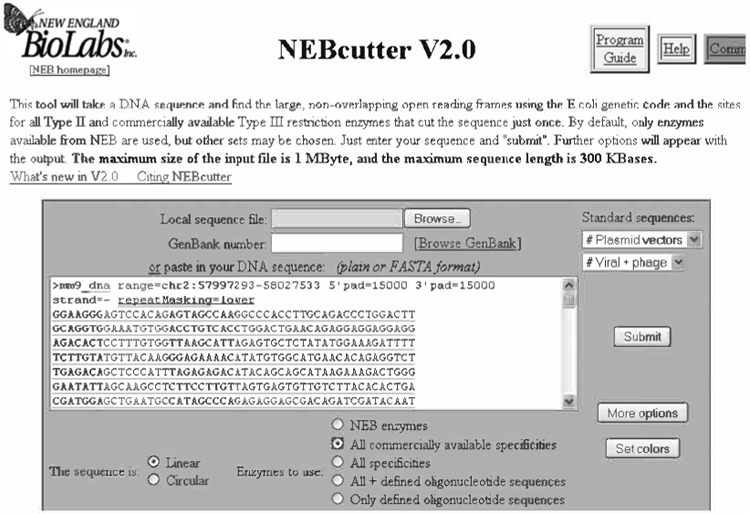
Submission of the 30 kb Pscdbp genomic sequence to the NEBcutter webpage for restriction analysis.
Fig. 8.17.
Selection of enzymes for the restriction map of the Pscdbp genomic sequence.
Under “Main Options” select “Custom digest”. This displays all of the enzymes that will cut your sequence. Choose rare cutter enzymes to simplify the map. Suggested enzymes include BamHI, BglI, BglII, EcoRI, EcoRV, HincII, HindIII, NotI, NcoI, PstI, ScaI, SpeI, StuI, XbaI. Scroll down and check these boxes. Note: Enzymes that do not cut are not listed (i.e., EcoRV and NotI because they do not cut within the 30 kb that is being analyzed). Choose “DIGEST” from the menu at the very bottom of the page.
-
4a.4.
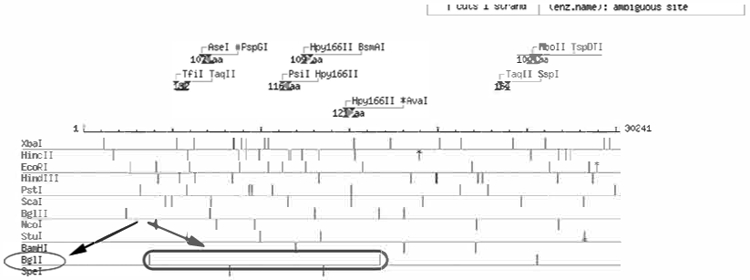
Under “DISPLAY” choose “Alternative” to create a map with one restriction pattern per line. This helps to visually analyze the map and quickly identify restriction enzymes that can be used to generate a screening strategy.
To Print: Under “Main options” choose “Print”. Under “Display mode” check “Map only” and then select “Create Image”. To see the map click on “Click here to view/download the PDF file” (see Fig. 8.18). Print the PDF file.
Fig. 8.18.
Identification of BglI as enzyme to screen for targeted ES cell clones by Southern blotting.
The least frequent cutters are displayed at the bottom. They are most useful in designing a screening strategy. Since the restriction enzyme analysis has been done with 15 kb upstream and 15 kb downstream of the targeted exon, this exon is in the middle of the map. Thus, for example one can envision using BglI to detect a size increase due to the addition of the selectable marker flanking the exon and using a probe at the 5′ end of the vector, assuming BglI does not cut within the selectable marker cassette.
Step 4b: Compare sequence among species (mouse vs. human)
The mouse and human genomic DNA sequence at the region of insertion of the selectable marker cassette should be aligned and compared to look for areas of sequence conservation. In fact, as mentioned previously the loxP and the neo cassette should be inserted in a non-conserved region to avoid disruption of regulatory elements. Disruption of these regions could cause the generation of a null allele instead of a conditional one. Since the loxP site and the selectable marker cassette (e.g., neo cassette) are placed within 2 kb of each other, 1 kb upstream and 1 kb downstream of the targeted exon should be retrieved from both the mouse and human database to analyze for sequence conservation. Compare the intronic regions directly upstream and downstream of the exon with an alignment or bestfit program.
-
4b.1.
To retrieve the mouse sequence: Go to UCSC Genome Browser (http://genome.ucsc.edu) and choose BLAT from the top menu.
-
4b.2.
Paste just the ATG exon sequence (targeted exon) in the box and select “SUBMIT”. At the “BLAT Search Results” page click “browser”. At the top menu, click “DNA” (see Fig. 8.19).
-
4b.3.
At the “Get DNA for” page, go to the “Sequence Retrieval Region Option” section and type in “1000” in the boxes for add extra bases upstream and downstream. Check the “Mask repeats” and “to lower case” boxes. Check the “Reverse complement” box since the gene is on (−) strand. Click “get DNA”. Copy, Paste, and Save this sequence as a TEXT file.
-
4b.4.
Retrieve human Pscdbp sequence by following Step 1. Go to NCBI GenBank (http://www.ncbi.nlm.nih.gov) and at “search” select “gene”, at “for” type in “Pscdbp” and click “Go”. Choose a human gene from the list, and obtain the FASTA format human sequence.
-
4b.5.
Obtain the structure of human Pscdbp by following Step 2. Briefly, go to the UCSC Database (http://genome.ucsc.edu). Click BLAT and paste the human Pscdbp sequence into the box. Under “Genomes” choose “Human” and click “SUBMIT”. Pick the sequence with the highest score. Click “details” to see the results. Scroll down to “Genomic chr2” and highlight and confirm the ATG exon (in blue upper-case letters). Save the sequence in a TEXT file.
-
4b.6.
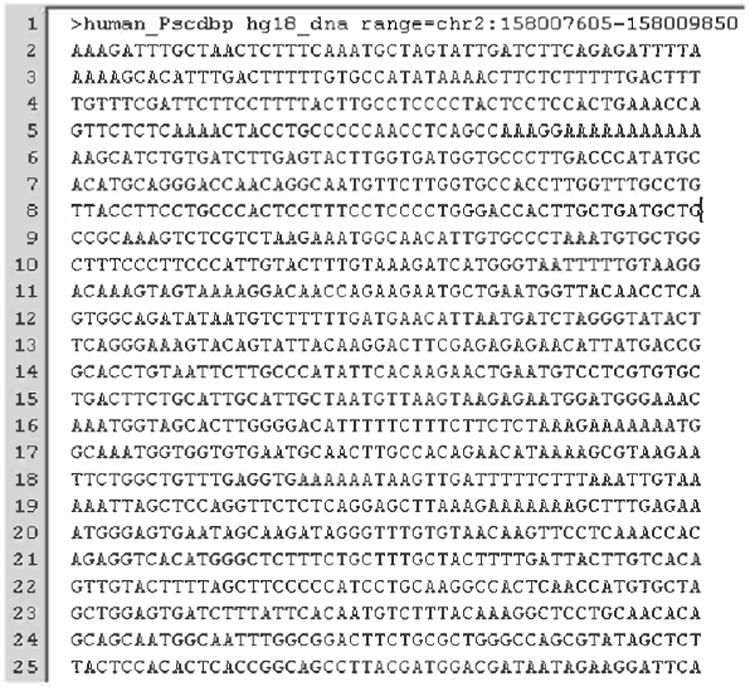
Retrieve human Pscdbp’s first exon’s sequence with +/− 1000 flanking sequence by following Steps 4b.2 and 4b.3. Briefly, go to the UCSC Database and use BLAT to align the human ATG exon sequence against human genome. Click “browser” in the result. At the top menu, click “DNA”. Go to the “Sequence Retrieval Region Option” section and type in “1000” in the boxes and add extra bases upstream and downstream. Check the “Mask repeats” and “to lower case” boxes. Check the “Reverse complement” box since the gene is on “−” strand. Select “get DNA”. Copy, Paste, and Save this sequence as a TEXT file
-
4b.7.
Go to the VISTA website (http://genome.lbl.gov/vista/index.shtml) (37) and choose the mVISTA alignment for mouse/human sequence comparison. The program accepts FASTA-formatted sequence files. FASTA format starts with a “>” followed immediately by a name and the next line begins the sequence. Without the “>” sign and a name in the file, VISTA will give you an error message. The sequence must be a TEXT file (see Fig. 8.20).
-
4b.8.
At the mVista screen, type “2” in the number of species box to compare two species and press submit. Fill in your e-mail address. Select each of the text files for your mouse and human sequences as shown and press submit. Your results will be e-mailed to you and will look as shown below (in the box is the end sequence of the exon).
Fig. 8.19.

Retrieval of 2 kb of genomic sequence around exon 1 of the mouse and human Pscdbp genes.
Fig. 8.20.
Submission of the mouse and human Pscdbp sequences for alignment at the VISTA webpage.
Sequence comparison can be done optimally using VISTA because it is a program that allows you to compare sequences between different species and identify genes with a common ancestor. The sequence comparison resulting from the NCBI Blast does not lead to such a detailed comparison and only highlights a few conserved areas because it is not optimized for sequence comparison between species (see Fig. 8.21).
Fig. 8.21.
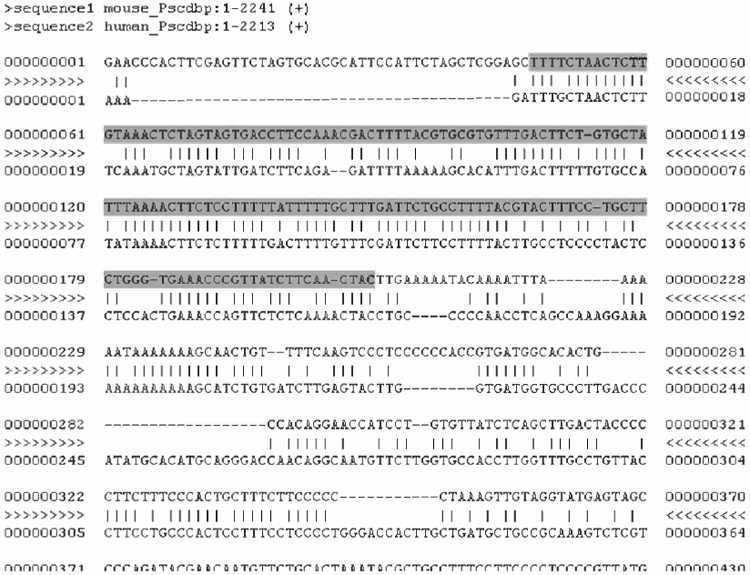
Alignment results of mouse and human Pscdbp at the VISTA webpage.
References
- 1.Robertson EJ. Using embryonic stem cells to introduce mutations into the mouse germ line. Biol Reprod 1991;44:238–45. [DOI] [PubMed] [Google Scholar]
- 2.Doetschman TC. Gene targeting in embryonic stem cells. Biotechnology 1991;16:89–101. [PubMed] [Google Scholar]
- 3.Bradley A Modifying the mammalian genome by gene targeting. Curr Opin Biotechnol 1991;2:823–9. [DOI] [PubMed] [Google Scholar]
- 4.Capecchi MR. The new mouse genetics: altering the genome by gene targeting. Trends Genet 1989;5:70–6. [DOI] [PubMed] [Google Scholar]
- 5.Godwin AR, Stadler HS, Nakamura K, Capecchi MR. Detection of targeted GFP-Hox gene fusions during mouse embryo-genesis. Proc Natl Acad Sci USA 1998;95:13042–7. [DOI] [PMC free article] [PubMed] [Google Scholar]
- 6.Gagneten S, Le Y, Miller J, Sauer B. Brief expression of a GFP cre fusion gene in embryonic stem cells allows rapid retrieval of site-specific genomic deletions. Nucleic Acids Res 1997;25:3326–31. [DOI] [PMC free article] [PubMed] [Google Scholar]
- 7.Mansour SL, Thomas KR, Deng CX, Capecchi MR. Introduction of a lacZ reporter gene into the mouse int-2 locus by homologous recombination. Proc Natl Acad Sci USA 1990;87:7688–92. [DOI] [PMC free article] [PubMed] [Google Scholar]
- 8.Sauer B Inducible gene targeting in mice using the Cre/lox system. Methods 1998;14:381–92. [DOI] [PubMed] [Google Scholar]
- 9.Dymecki SM. A modular set of Flp, FRT and lacZ fusion vectors for manipulating genes by site-specific recombination. Gene 1996;171:197–201. [DOI] [PubMed] [Google Scholar]
- 10.Dymecki SM. Flp recombinase promotes site-specific DNA recombination in embryonic stem cells and transgenic mice. Proc Natl Acad Sci USA 1996;93:6191–6. [DOI] [PMC free article] [PubMed] [Google Scholar]
- 11.Kuhn R, Schwenk F, Aguet M, Rajewsky K. Inducible gene targeting in mice. Science 1995;269:1427–9. [DOI] [PubMed] [Google Scholar]
- 12.Liu P, Jenkins NA, Copeland NG. A highly efficient recombineering-based method for generating conditional knockout mutations. Genome Res 2003;13:476–84. [DOI] [PMC free article] [PubMed] [Google Scholar]
- 13.Lee EC, Yu D, Martinez de Velasco J, et al. A highly efficient Escherichia coli-based chromosome engineering system adapted for recombinogenic targeting and subcloning of BAC DNA. Genomics 2001;73:56–65. [DOI] [PubMed] [Google Scholar]
- 14.Copeland NG, Jenkins NA, Court DL. Recombineering: a powerful new tool for mouse functional genomics. Nat Rev Genet 2001;2:769–79. [DOI] [PubMed] [Google Scholar]
- 15.Muyrers JP, Zhang Y, Testa G, Stewart AF. Rapid modification of bacterial artificial chromosomes by ET-recombination. Nucleic Acids Res 1999;27:1555–7. [DOI] [PMC free article] [PubMed] [Google Scholar]
- 16.Zhang Y, Buchholz F, Muyrers JP, Stewart AF. A new logic for DNA engineering using recombination in Escherichia coli. Nat Genet 1998;20:123–8. [DOI] [PubMed] [Google Scholar]
- 17.Mural RJ, Adams MD, Myers EW, et al. A comparison of whole-genome shotgun-derived mouse chromosome 16 and the human genome. Science 2002;296:1661–71. [DOI] [PubMed] [Google Scholar]
- 18.Venter JC, Adams MD, Myers EW, et al. The sequence of the human genome. Science 2001;291:1304–51. [DOI] [PubMed] [Google Scholar]
- 19.Lander ES, Linton LM, Birren B, et al. Initial sequencing and analysis of the human genome. Nature 2001;409:860–921. [DOI] [PubMed] [Google Scholar]
- 20.Maglott D, Ostell J, Pruitt KD, Tatusova T. Entrez gene: gene-centered information at NCBI. Nucleic Acids Res 2007;35:D26–31. [DOI] [PMC free article] [PubMed] [Google Scholar]
- 21.Karolchik D, Baertsch R, Diekhans M, et al. The UCSC Genome Browser database. Nucleic Acids Res 2003;31:51–4. [DOI] [PMC free article] [PubMed] [Google Scholar]
- 22.Deng C, Capecchi MR. Reexamination of gene targeting frequency as a function of the extent of homology between the targeting vector and the target locus. Mol Cell Biol 1992;12:3365–71. [DOI] [PMC free article] [PubMed] [Google Scholar]
- 23.Hasty P, Rivera-Perez J, Chang C, Bradley A. Target frequency and integration pattern for insertion and replacement vectors in embryonic stem cells. Mol Cell Biol 1991;11:4509–17. [DOI] [PMC free article] [PubMed] [Google Scholar]
- 24.Capecchi MR. Gene targeting in mice: functional analysis of the mammalian genome for the twenty-first century. Nat Rev Genet 2005;6:507–12. [DOI] [PubMed] [Google Scholar]
- 25.Olson EN, Arnold HH, Rigby PW, Wold BJ. Know your neighbors: three phenotypes in null mutants of the myogenic bHLH gene MRF4. Cell 1996;85:1–4. [DOI] [PubMed] [Google Scholar]
- 26.Hasty P, Rivera-Perez J, Bradley A. The length of homology required for gene targeting in embryonic stem cells. Mol Cell Biol 1991;11:5586–91. [DOI] [PMC free article] [PubMed] [Google Scholar]
- 27.Simpson EM, Linder CC, Sargent EE, Davisson MT, Mobraaten LE, Sharp JJ. Genetic variation among 129 substrains and its importance for targeted mutagenesis in mice. Nat Genet 1997;16:19–27. [DOI] [PubMed] [Google Scholar]
- 28.Evans MJ, Kaufman MH. Establishment in culture of pluripotential cells from mouse embryos. Nature 1981;292:154–6. [DOI] [PubMed] [Google Scholar]
- 29.You Y, Bersgtram R, Klemm M, Nelson H, Jaenisch R, Schimenti J. Utility of C57BL/6 J × 129/SvJae embryonic stem cells for generating chromosomal deletions: tolerance to gamma radiation and microsatellite polymorphism. Mamm. Genome 1998;9:232–4. [DOI] [PubMed] [Google Scholar]
- 30.Adams DJ, Quail MA, Cox T, et al. A genome-wide, end-sequenced 129 Sv BAC library resource for targeting vector construction. Genomics 2005;86:753–8. [DOI] [PubMed] [Google Scholar]
- 31.Soriano P, Montgomery C, Geske R, Bradley A. Targeted disruption of the c-src proto-oncogene leads to osteopetrosis in mice. Cell 1991;64:693–702. [DOI] [PubMed] [Google Scholar]
- 32.Capecchi MR. Altering the genome by homologous recombination. Science 1989;244:1288–92. [DOI] [PubMed] [Google Scholar]
- 33.Yagi T, Ikawa Y, Yoshida K, et al. Homologous recombination at c-fyn locus of mouse embryonic stem cells with use of diphtheria toxin A-fragment gene in negative selection. Proc Natl Acad Sci USA 1990;87:9918–22. [DOI] [PMC free article] [PubMed] [Google Scholar]
- 34.Martens JH, O‘Sullivan RJ, Braunschweig U, et al. The profile of repeat-associated histone lysine methylation states in the mouse epigenome. Embo J 2005;24:800–12. [DOI] [PMC free article] [PubMed] [Google Scholar]
- 35.Kent WJ. BLAT – the BLAST-like alignment tool. Genome Res 2002;12:656–64. [DOI] [PMC free article] [PubMed] [Google Scholar]
- 36.RepeatMasker. (Accessed at http://www.repeatmasker.org/)
- 37.Frazer KA, Pachter L, Poliakov A, Rubin EM, Dubchak I. VISTA: computational tools for comparative genomics. Nucleic Acids Res 2004;32:W273–9. [DOI] [PMC free article] [PubMed] [Google Scholar]