

Graphical abstract

1. Introduction
A chemical reaction is a process where reactants are transformed into products. In order for a reaction to occur, reactant molecules need to be in proximity with each other and there needs to be sufficient energy to overcome the energy barrier. This energy is called activation energy (Ea). Several researchers have studied the materials’ activation energies for different chemical reactions. For the hydrolysis reaction involved in the dissolution of quartz and amorphous silica in water, the Ea was found to be in the range of 60.9 to 76.6 kJ mol−1 1. Mazer and Walther investigated the temperature dependence of vitreous silica dissolution at pH 4.1 and reported Ea to be 95 kJ mol−1 2. Maraghechi et al. studied the dissolution and precipitation reactions of amorphous silica at high pH aqueous solution and dissolution Ea was calculated as 87.5 kJ mol−1 3. These high values indicate that breaking the bond between silicon and oxygen is the rate-limiting step to this reaction1.
Fluorapatite glass-ceramic veneer is used as a dental restorative material 4. The corrosion of glass-ceramic is dominated by two main reactions 5-6 depending on the pH of the environment. There is total dissolution with a breakdown of the silica network in an alkaline solution and an ion exchange process occurs between alkalis of glass-ceramic and protons in acidic conditions.
Chemical durability is one of the most important criteria for dental materials as this represents resistance to surface degradation in the presence of environmental pH 7-11 changes, since the oral cavity can be a hostile chemical environment to dental restorative materials. Dental ceramics will eventually undergo degradation resulting from mechanical occlusion, chemical corrosion, or a combination of both 12. Corrosion can lead to decreased fracture strength 13 and surface roughness, which will eventually lead to abrasive wear and accumulation of plaque on the surface of teeth. Štefančić et al. reported that the surface roughness of glazed yttria partially stabilized tetragonal zirconia dental ceramic increased after corrosion in acid 14. The increased surface roughness of antagonistic ceramic is unfavorable for enamel wear 15, and can result in more plaque accumulation on rougher surfaces, which can in turn, promote tooth decay 16-17.
Prediction of clinical performance for dental materials is the essence of testing methodologies. In vitro testing needs to be realistic, expedient and financially viable. As such, accelerated testing at higher temperatures has been employed to allow several years’ worth of degradation to occur in a significantly shorter amount of time. However, employing elevated temperatures can elicit other chemical reactions, which would not normally occur at regular body temperatures (37°C for intraoral temperatures).
Since glass-ceramic consists of oxides, a thorough understanding of the compounds, which play a role in corrosion in different solutions, is needed. However, previous studies have mainly focused on the corrosion and Ea of silica 1-3, 18. The aim of this study was to determine the activation energy of the dissolution kinetics of a fluorapatite glass-ceramic veneer in alkaline and acidic conditions as a function of dissolution rate at different temperatures to justify their predictability under clinical conditions.
2. Materials and Methods
2.1. Specimens preparation
Fluorapatite glass-ceramic veneers (Zirpress, Ivoclar Vivadent AG, Schaan, Liechtenstein) were cut into 12 × 1.2 ± 0.4 mm disks and polished by using grinder-polisher (EcoMet™ 250 AutoMet™ 250 Power Head, Buehler) using 340, 400 and 600 grits of silicon carbide abrasive paper (Carbimet, Buehler) for both sides. The disks were cleaned with ethanol under ultrasonication (Pro-Sonic 600, Sultan) and rinsed with deionized distilled water. The composition of fluorapatite glass-ceramic disks was obtained from Ivoclar Vivadent scientific documentation and is listed in Table 1.
Table 1.
The compositions (wt% and atomic %) of the glass-ceramic used in this study19.
| Composition | SiO2 | Al2O3 | Na2O | K2O | CaO | ZnO | ZrO2 | P2O5 | F | Other oxides |
pigments |
|---|---|---|---|---|---|---|---|---|---|---|---|
| wt% | 57.0-62.0 | 12.0-16.0 | 7.0-10.0 | 6.0-8.0 | 2.0-4.0 | 1.5-2.5 | 1.0-2.0 | 0.5-1.0 | 0-6.0 | 0.2-0.9 | |
| atomic% | 58.6-51.6 | 14.5-15.7 | 13.9-16.1 | 7.8-8.5 | 2.2-3.5 | 0.7-1.0 | 0.4-0.7 | 1.6-2.6 |
2.2. Experimental design
The disks were dried in the oven at 100 °C to 105 °C for 24 hours and cooled in the desiccator before weight measurement. The measurement was performed prior to and after corrosion experiments with an accuracy of 0.1 mg (AS60/220.R2 Analytical balance, RADWAG). The corrosion experiments were performed at (i) different immersion days; for 3, 15, and 30 days at 85°C, and (ii) different temperatures; 37, 55, 65, 75 and 85 °C for 30days. The disks were immersed in 15 ml of pH 10 (Ammonium chloride-ammonium hydroxide buffer solution, Sigma-Aldrich), pH 7 (mixture of 0.1 M tris (hydroxymethyl) aminomethane and 0.1M HCl), and pH 2 (glycine buffer solution, Santa Cruz Biotechnology, Inc.). Five disks were used for each condition per group. All disks were placed in polyethylene centrifuge tubes (Thermo Scientific Nalgene Oak Ridge High-Speed Centrifuge Tubes, Thermo Fisher Scientific) and a shaking water bath (TSBS40, Techne USA) with 50 oscillations per minute. After corrosion for 30 days, the amount of released K, Na, Ca, Si, Al, and Zn ions in the solution were analyzed by inductively coupled plasma atomic emission spectrometer (ICP, 3200RL, PerkinElmer).
2.3. Surface Characterization
2.3.1. X-ray diffraction analysis
X-ray diffraction was used to analyze fluorapatite glass-ceramic disk before (as reference) and after corrosion. The X-ray diffraction investigations were performed with an Empyrean instrument (Panalytical, The Netherlands). The instrument works with a Cu anode (Cu Kα radiation) at a power of 45 kV and 40 mA. For symmetrical XRD investigations, the instrument was set up in a Bragg-Brentano geometry with a ½° slit and a 0.04 rad Soller slit in the incidence beam side and a 1° receiving slit, a 0.04 rad large Soller slit, a Ni β filter and a 1 D Pixcell detector in the diffracted beam side. In this geometry, X-rays penetrate tens of micrometers, so the estimated phase composition corresponds to bulk.
The grazing incidence X-ray diffraction geometry was performed in a parallel X-ray beam geometry, which limits the analyzed volume to the outermost surface region of the sample. In this case, an X-ray mirror and a 1/8° slit was used in the incident beam side and a 0.27° thin film collimator on the diffracted beam side. After careful alignment, an incidence angle of 0.1° was chosen, which limits the analyzed depth to around 100 nm, up to a maximum of 200 nm. A more exact estimation of the penetration depth could not be performed because of the rather rough surface of chemically treated samples. The 2018 ICCD powder diffraction database was used to analyze the acquired patterns.
2.3.2. X-ray photoelectron spectroscopy analysis
The surface compositions of disks before corrosion (as reference) and after corrosion were analyzed in a ULVAC-PHI XPS instrument with Al monochromatised Kα radiation from a 50W X-ray source. Survey scans were recorded in the range 0-1100 eV binding energy with a 0.8 eV step size.
2.3.3. Scanning electron microscopy analysis
The morphologies of the disks were examined by scanning electron microscopy (Phenom Desktop SEM, Thermo Scientific). The images were obtained at 5kV before corrosion (as reference) and after corrosion in pH 10 and pH 2.
2.3.4. Atomic force microscope analysis
Surface morphologies and roughness were also measured using the SPM-AFM system (Bruker/ Veeco/Digital Instruments NanoScope V). The images 5μm by 5μm was obtained using silicon AFM probe (RTESP-300, Bruker) in tapping mode at resonance frequency between 200 kHz to 400 kHz. The 3D images and surface roughness were analyzed using NanoScope analysis software and flattening first order of the image to remove tilt in line scan and adjust to the same average height.
3. Results
3.1. Weight loss
The total weight loss of disks was measured and the corrosion rate was calculated at 3, 15 and 30 days at 85 °C (see Figure 1). The corrosion rate for the first 3 days was highest among all the conditions. The weight loss then decreased with the increase in immersion time. After 15 days, the corrosion rate approached a constant value, similar to that measured for 30 days. The total weight loss in pH 7 was within the error of the weight balance and therefore the results were not reported in this present study.
Figure 1.

The corrosion rate of disks in pH 10 and pH 2.
3.2. ICP analysis
The ions released into solution were measured by ICP and converted into the weight of the oxides. Figure 2 demonstrates the weight of the released oxides in mg in basic and acidic conditions at 85°C. Overall, the amount of released oxides was higher in acidic than basic environment, which was consistent with the corrosion results (Figure 1). The amount of oxides was released in the order of SiO2 > Na2O > K2O > ZnO > CaO > Al2O3 in basic solution. In acidic solution the trend was SiO2 > Al2O3 > K2O > Na2O> CaO> ZnO.
Figure 2.

Weight loss of individual oxide in pH 10 and pH 2.
3.3. Dissolution activation energy
The activation energy was calculated for each oxide present in the glass-ceramic based on an Arrhenius equation (1);
| (1) |
where W is corrosion rate, Ea is the activation energy, R is the gas constant as 8.314 J mol−1 K−1, T is absolute temperature and A is pre-exponential factor. The activation energy can be obtained by plotting natural logarithmic corrosion rates versus the inverse of absolute temperature. The representative plot is shown in Figure 3. The slope of the regression line is the result of -Ea/R. The activation energies estimated for all the oxide components are listed in Table 2.
Figure 3.

Arrhenius plot of glass-ceramic dissolution in pH 10 and pH 2
Table 2.
The activation energy of individual oxide in pH 10 and pH 2, respectively.
| Activation energy (kJ/mol) |
CaO | K2O | Na2O | SiO2 | ZnO | Al2O3 |
|---|---|---|---|---|---|---|
| pH 10 | - | 52.9 | 36.0 | 20.6 | 7.0 | - |
| pH 2 | 28.5 | 58.8 | 44.8 | 70.5 | 28.0 | 50.56 |
SiO2 and ZnO had lower activation energies than the network modifiers, K2O and Na2O in basic solution. There were non-detectable concentration levels released for CaO and Al2O3 so their activation energies could not be calculated. However, in acidic solution, SiO2 possessed the highest activation energy compared with K2O, Na2O and Al2O3. The activation energies for CaO and ZnO were similar.
The total weight loss of each disk was used to derive the activation energy based on equation (1), as shown in Table 3, to be 30.42 kJ/mol and 56.05 kJ/mol in pH 10 and for pH 2, respectively. The weight-loss based activation energy, Eaw, was also determined with the sum of individual oxide activation energies multiplied by the weight percentage of each individual oxide in the glass-ceramic;
| (2) |
where Eai is the activation energy of individual ions and fo is the weight fraction of a specific oxide corresponding to the individual released ion. Based on equation (2), the average activation energies obtained by the addition of the percentage weight of each individual oxide were 26.53 kJ/mol and 58.88 kJ/mol in pH 10 and for pH 2, respectively, as illustrated in Table 3.
Table 3.
The activation energies in pH 10 and pH 2 based on the total weight loss and sum of weight percent of each individual oxide activation energy.
| Activation Energy based on Total weight (kJ/mol) |
Sum of individual oxide (kJ/mol) |
|
|---|---|---|
| pH 10 | 30.42 | 26.53 |
| pH 2 | 56.05 | 58.88 |
3.4. Surface characterization
XRD was used to analyze the crystalline phases of glass-ceramic disks and the degree of crystallinity. The disks from before and after corrosion in 85 °C contained more than 94 % ± 3 % amorphous phase as given by the ratio between the area of the large amorphous bump located at around 2θ = 25° 20 and the whole areas under the diffraction peaks (Figure 4a). The characteristic peaks identified the crystalline phase as Calcium Fluoride Phosphate, Ca5(PO4)3F and/or Calcium Fluoride Phosphate Hydroxide Ca5(PO4)3Fx(OH)y, where the patterns were closely matched to these two compounds. Figure 4 shows the comparison of bulk patterns between each sample as well as the surface acquired patterns. The diffraction patterns acquired from bulk for each sample were almost indistinguishable. However, the surface region was less crystalline than the bulk for all samples. There was no secondary precipitate found in the corrosion areas.
Figure 4.

XRD analysis of reference and corroded disks in pH10 and pH 2 were shown in (a) bulk-symmetrical XRD and (b) surface-grazing incidence XRD.
The disks were also analyzed by XPS. Survey spectra acquired from samples are displayed in Figure 5. Table 4 shows the atomic percentage of reference (non-corroded) and corroded disks. After immersion in pH 10 solution, the acquired spectra displayed less Na+ and no K+, P+, Zn2+ and F−, while after immersion in pH 2 solution the acquired spectra showed no Al3+, Na+, K+, Ca2+, Zn2+ and F− but more P5+.
Figure 5.

XPS survey spectra acquired from reference (non-corroded) and corroded disks in pH 10 and pH 2 after 30days.
Table 4.
The atomic composition of reference (non-corroded), and corroded disks obtained from XPS survey spectra. C1s due to surface contamination was excluded from these estimations.
| Atomic% (max-min) |
Si | Al | Na | N | K | Ca | Mg | P | Zn | Zr | F | Ti |
|---|---|---|---|---|---|---|---|---|---|---|---|---|
| Reference | 55.5-51.7 | 14.5-8.5 | 10.1-4.7 | 12.8-7.9 | 6.7-5.2 | 4.7-2.2 | 5.7-1.9 | 2.4-0.4 | 1.7-0.8 | 0.8-0.4 | 0.8-0.4 | |
| pH10 | 58.6 | 12.1 | 5.6 | 11.6 | 8.1 | 4.0 | ||||||
| pH 2 | 49.4 | 11.7 | 16.7 | 13.3 | 8.9 |
The surface morphologies of the disks were examined under SEM (Figure 6) and AFM (Figure 7). The corroded disks demonstrated a different surface morphology than the reference disks. After exposure to pH 10 solution, the morphology showed generalized pitting on the surface. In contrast, there were isolated areas of pitting and roughness in pH 2 (Figure 6). The surface roughness was analyzed using AFM. The corroded disks in pH 2 showed the roughest surface with Rq 563.2 ± 141.1 nm, followed by corroded disks in pH 10 with Rq 318.8 ± 40.5 nm and reference Rq 17.0 ± 4.3 nm.
Figure 6.
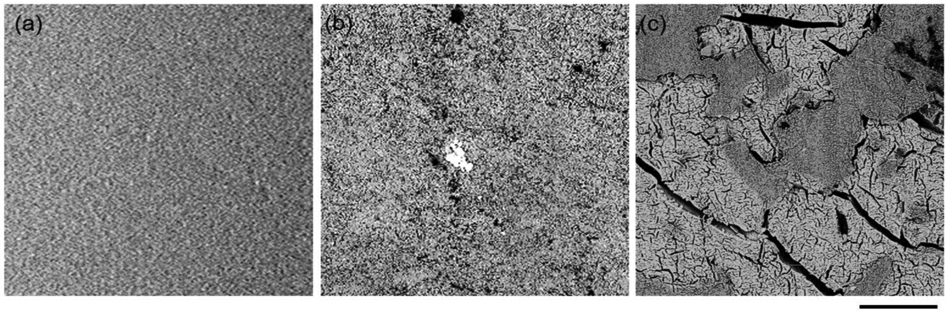
SEM images of reference (non-corroded), and corroded disks in pH 10 and pH 2 after 30 days. Scale bar: 30 μm.
Figure 7.

AFM images of reference (non-corroded), and corroded disks in pH 10 and pH 2 after 30 days.
4. Discussion
This study was undertaken to determine whether the use of an accelerated aging temperature to determine surface degradation of dental ceramics over an extended period of time is a reasonable assumption. That is, does an accelerated aging temperature elicit other reactions to occur which would not normally occur at 37°C, the mouth temperature? The relationship between the weight loss rate of released oxides and temperature is shown in Figure 3. The results were approximately linear where the glass-ceramic corrosion was accelerated with increasing temperature. This indicates that the corrosion at high temperatures or accelerated aging temperatures could be used to extrapolate longer time reactions at lower temperatures for this particular material. Based on equation 1, the slope of the data displayed in Figure 3 was used to obtain the activation energy, which is presented in Table 2 as the activation energies of each oxide.
In an alkali environment, the activation energy of silica dioxide was observed to be 20.6 kJ/mol (Table 2) which is in contrast with other studies that reported the activation energy of silica to be between 60.9 to 87.5 kJ/mol 1, 3, 18. In general, an activation energy less than 20 kJ/mol indicates a diffusion-controlled process while an activation energy between 50 to 100 kJ/mol suggests the process is a surface reaction-controlled in liquid 21. A possible explanation for the low activation energy observed for silica could be a hydrogen bonding effect at the interface between the glass-ceramic and the solution. During dissolution, the ionized surface of glass-ceramic contains SiO− and NH4+ ions where a hydrogen bond could form with SiO− 22. This bond could prevent the diffusion of reagent (hydroxyl ions) from the solution to the surface or released ions from the surface to the solution. Non-bridging sites tend to attach to alkali ions more than H+ in basic conditions resulting in higher activation energies for alkali oxides 23. In addition, hydroxyl aluminates form in the base solution as Al(OH)x where x = 4, 5 or 6, and there was no detection of Al+3 ions in the solution. The hydroxyl aluminates usually absorb water molecules and swell up as a gel, which will further hinder (OH)− ions to diffuse into the SiO− surface. This is consistent with the low activation energy of 20 kJ/mol for the diffusion-controlled glass-ceramic dissolution process.
In acidic conditions, the corrosion of glass-ceramic was favored through ionic exchange. Al3+ can be used as an intermediate ion replacing Si4+ in the glass-ceramic structure. In order to maintain a charge balance, univalent cations, such as Na+ and K+, are present in glass-ceramic. The equilibrium constant could be used to determine the extent of ion exchange. Bunker showed the ion exchange process was less in the presence of Al3+ 24. This could explain the activation energies for K2O, Na2O and Al2O3. The leaching of K+, Na+ and Al3+ ions appeared to be reaction-controlled. CaO and ZnO were diffusion-controlled, whereby the leaching process was governed by mass transport 21, 25. While ions leach out, a hydrated surface can form on the surface of glass-ceramic. The dissolution of this hydrated surface becomes the rate-limiting step, which explains why SiO2 had the highest activation energy (Table 2) in this environment.
Glass-ceramic based materials consist of network formers, intermediate ions and network modifiers. In a neutral condition or pH 7, there are two reactions that occur simultaneously to compete for the corrosion of glass-ceramic. The first reaction is a total dissolution process where the network former (or silica network), SiO4, is broken down by hydroxyl ions. The second reaction is an ionic exchange reaction wherein the network modifiers, such as alkali metals or alkali earth metals, are released into solution through an exchange with hydrogen ions in solution. The M in the equation (4) and (5) represents alkali metals or alkali earth metals.
| (3) |
| (4) |
| (5) |
Changes in pH of the environment is accompanied by different ion activities 26. In an alkali environment, the activity of hydroxyl ions increases and favors the dissolution of silica network while the ionic exchange reaction is suppressed, preventing the leaching of network modifiers. In contrast, the activity of hydroxyl ions decreases in acidic conditions, while the activity of hydrogen ions for ionic exchange is favored.
The results of this study finding a lower release of SiO2 in pH 10 is in contrast with other studies, where the dissolution of silica network is increased in basic conditions 6, 27. The silica network typically undergoes nucleophilic attack by hydroxyl groups and the Si-O-Si bond in the intermediate compound that is formed is cleaved 24. This study demonstrates that glass-ceramic corrosion is not only related to structure and composition but also to the ionic composition of the environment. 3, 24, 26, 28-29. According to earlier studies 28-29, NH4OH, present in the pH 10 solution, demonstrated less corrosive ability compared with other solutions. This could explain why the dissolution of ions was a lot less in the basic environment for this experiment (Figures 1 and 2).
Silica dioxide, alumina dioxide, alkali metal and alkali earth metal oxides were released more in acidic than in basic conditions (Figures 1 and 2). A previous study discussed five types of characteristic glass surface in solution 30: (1) the reacted surface has similar compositions as the bulk, and when conducted under neutral pH no significant material loss is observed; (2) a silica-rich surface is produced because of the lower alkali concentrations in the bulk and selective dealkalization reactions; (3) a silica-rich surface is also formed with fast dealkalization reactions or total network dissolution; (4) the reacted surface has similar composition as bulk but with substantial material loss due to uniform attack; (5) protective layers are formed on the surface. They theorized that by introducing alumina oxide or calcium phosphate to a glass composition, a protective film could form on the glass surface, preventing surface reactions. In the present study, a silica-rich layer seemed to form on the surface and there were less alkali ions. These alkali ions may have gone through dealkalization reactions (Figure 5 and Table 4).
In addition, other studies determined that non-bridging oxygen can attach to alkali metals/alkali earth metal instead of to H+ in basic conditions, and silanol in acidic conditions23. This is another possible explanation for the non-detectable or very minimal release of CaO and Al2O3 as well as other oxides in the basic solution.
SEM and AFM results showed that disks corroded in pH 2 had the roughest surface morphologies compared with disks corroded in pH 10 and reference disks (Figure 6 and Figure 7). This result coincides with weight loss results where the corroded disks in pH 2 demonstrated the highest weight loss (Figure 1 and Figure 2) compared with the other groups. The surface morphology for disks corroded in pH 2 demonstrated isolated areas of pitting and roughness, which is further evidence for the ion exchange mechanism that occurs in this environment27. The corroded disks in pH 10 had less rough surfaces with generalized pitting compared with the disks corroded in pH 2 (Figure 6 and Figure 7), which could be attributed to the less corrosive ability of NH4OH pH 10.
XRD was performed to determine the crystal phase in glass-ceramic and whether a new secondary phase developed after corrosion (Figure 4). The crystal phases of fluoroapatite glass-ceramic samples used in this study were identified as Calcium Fluoride Phosphate, Ca5(PO4)3F and/or Calcium Fluoride Phosphate Hydroxide Ca5(PO4)3Fx(OH)y phases. The amount of crystalline phase was less than 6 % ± 3 % from Bragg-Brentano geometry analysis (Figure 4a). Although the XRD pattern of the glass-ceramic disks in this study was close to both crystalline patterns, the non-corroded (reference) disk was considered to be Calcium Fluoride Phosphate. The non-corroded fluoroapatite glass-ceramic was obtained through sintering or heat treatment and would therefore not have any of the OH groups31.
The surface of the reference disk was shown to be more amorphous than the bulk by grazing incidence X-ray diffraction geometry (Figure 4). This could be the result of mechanical treatment with the diamond saw and sand paper polishing on the surface during sample preparation. For the corroded disks, the surface of the sample immersed in pH 10 appeared to be more crystalline than those immersed in pH 2 and reference samples (Figure 4b). This increased crystallinity could be the result of a decrease in the area of the amorphous phase from dissolution reactions leading to a stronger signal to register compared with the original pattern. On the other hand, the surface of the sample immersed in pH 2 seemed to be less crystalline. This may indicate that the crystal phases went through a dissolution process. The peak around 2θ = 28° was diminished. There was no secondary phase found after corrosion.
The samples were also analyzed by XPS (Figure 5 and table 4) and showed that F− was not detected in the corroded samples. The F− and OH− ions possibly underwent an ionic exchange, which corresponds with the Calcium (Fluoride) Phosphate Hydroxide Ca5(PO4)3Fx(OH)y found in the XRD results. The percentage of phosphorus was higher but Ca2+ was less in disks corroded in pH 2 compared with reference disks. The formation of a P-enriched layer could be the result of an ionic exchange between Ca2+ and H+, and OH− and F− 32. On the other hand, P5+ was not detected in pH 10 but relatively higher Ca2+ levels were, which could indicate that the phosphorus ions are released through a dissolution mechanism33.
The samples used in this study were a mixture of crystalline materials and glass. The crystal phase was less than 6 % ± 3 % and was identified as Ca5(PO4)3(OH)/F. Therefore, this material was more than 95% of an amorphous glassy phase. There was difficulty in determining whether the dissolved Ca2+ and P5+ ions originated from the crystal or glassy phase since both these ions were present in both phases. The dissolution of SiO2 in alkali conditions was a diffusion-controlled process resulting from the presence of hydrogen bonds, and was reaction-controlled under acidic conditions. The dissolution of K2O, Na2O and A12O3 seemed to be reaction-controlled, whereas CaO and ZnO were governed by mass transport. The overall activation energy of glass-ceramic can be obtained from total weight loss of glass-ceramic as well as the sum of individual oxide activation times the weight fraction of individual released oxide in the glass-ceramic.
Conclusions
The activation energy for aqueous dissolution of a glass-ceramic veneer was calculated using ion release data during corrosion at different pH environments and temperatures. The activation energies derived over several temperatures demonstrated a linear trend which justifies the use of increased temperatures for accelerated aging reactions for this particular material. This study also found the composition of this fluorapatite glass-ceramic veneer to be 95% amorphous glassy phase and identified Ca5(PO4)3(OH)/F as the crystalline phase. In comparison with other studies1, 3, 18, the dissolution activation energy of silica dioxide was observed to be 20.6 kJ/mol under a diffusion-controlled alkali condition owning to the composition of the particular buffer solution. This work is expected to provide a better understanding of the performance of fluoroapatite glass-ceramic dental veneer material in the oral environment. Future work should include investigation of other materials that are subjected to accelerated aging to determine whether the use of this testing methodology is warranted.
Highlights.
First complete research on dissolution activation of fluoroapatite glass-ceramic dental veneer.
Discussion of acid and alkaline corrosion behavior of fluoroapatite glass-ceramic dental veneer.
Characterization of crystalline phase, degree of crystalline phase and surface compositions in fluoroapatite glass-ceramic dental veneer before corrosion and after corrosion.
Acknowledgements
NIH-NIDCR Grant R01 DE025001 supported this study. Ceramic materials were supplied by Ivoclar Vivadent. XPS was performed in Nanoscale Research Facility in University of Florida. XRD analysis was partially funded by NUCLEU –INFLPR project. We acknowledge Yuan Lin and Kimberly Beers for their significant contributions to this project.
Footnotes
There are no conflicts of interest associated with this research project.
Publisher's Disclaimer: This is a PDF file of an unedited manuscript that has been accepted for publication. As a service to our customers we are providing this early version of the manuscript. The manuscript will undergo copyediting, typesetting, and review of the resulting proof before it is published in its final form. Please note that during the production process errors may be discovered which could affect the content, and all legal disclaimers that apply to the journal pertain.
References
- 1.Rimstidt JD; Barnes HL, The kinetics of silica- water reactions. Geochimica et Cosmochimica Acta 1980, 44 (11), 1683–1699. [Google Scholar]
- 2.Mazer JJ; Walther JV, Dissolution kinetics of silica glass as a function of pH between 40 and 85°C. Journal of Non-Crystalline Solids 1994, 170 (1), 32–45. [Google Scholar]
- 3.Maraghechi H; Rajabipour F; Pantano CG; Burgos WD, Effect of calcium on dissolution and precipitation reactions of amorphous silica at high alkalinity. Cement and Concrete Research 2016, 87, 1–13. [Google Scholar]
- 4.Montazerian M; Zanotto ED, Bioactive and inert dental glass-ceramics. Journal of Biomedical Materials Research Part A 2017, 105 (2), 619–639. [DOI] [PubMed] [Google Scholar]
- 5.Herrmann M, Corrosion of Silicon Nitride Materials in Aqueous Solutions. Journal of the American Ceramic Society 2013, 96 (10), 3009–3022. [Google Scholar]
- 6.Esquivel-Upshaw JF; Ren F; Hsu SM; Dieng FY; Neal D; Clark AE, Novel testing for corrosion of glass-ceramics for dental applications. J Dent Res 2018, 97 (3), 296–302. [DOI] [PMC free article] [PubMed] [Google Scholar]
- 7.Bridges MA; Mattice MR, Over two thousand estimations of the ph of representative foods*. The American Journal of Digestive Diseases 1939, 6 (7), 440–449. [Google Scholar]
- 8.Jain P; Nihill P; Sobkowski J; MZ A, Commercial soft drinks: pH and in vitro dissolution of enamel. General Dentistry 2007, 55, 150–154. [PubMed] [Google Scholar]
- 9.Lussi A; Megert B; Peter Shellis R; Wang X, Analysis of the erosive effect of different dietary substances and medications. British Journal of Nutrition 2012, 107 (2), 252–262. [DOI] [PubMed] [Google Scholar]
- 10.Meurman JH; Toskala J; Nuutinen P; Klemetti E, Oral and dental manifestations in gastroesoph-ageal reflux disease. Oral Surgery, Oral Medicine, Oral Pathology, and Oral Radiology 1994, 78, 583–589. [DOI] [PubMed] [Google Scholar]
- 11.Seow WK; Thong KM, Erosive effects of common beverages on extracted premolar teeth. Australian Dental Journal 2005, 50 (3), 173–178. [DOI] [PubMed] [Google Scholar]
- 12.Anusavice KJ, Degradability of dental ceramic. Advances in Dental Research 1992, 6, 82–89. [DOI] [PubMed] [Google Scholar]
- 13.Pinto MM; Cesar PF; Rosa V; Yoshimura HN, Influence of pH on slow crack growth of dental porcelains. Dental Materials 2008, 24 (6), 814–823. [DOI] [PubMed] [Google Scholar]
- 14.Štefančić S; Ćurković L; Baršić G; Majić-Renjo M; Mehulić K, Investigation of Glazed Y-TZP Dental Ceramics Corrosion by Surface Roughness Measurement. Acta stomatologica Croatica 2013, 47 (2), 163–168. [Google Scholar]
- 15.Ghazal M; Kern M, The influence of antagonistic surface roughness on the wear of human enamel and nanofilled composite resin artificial teeth. The Journal of Prosthetic Dentistry 2009, 101 (5), 342–349. [DOI] [PubMed] [Google Scholar]
- 16.Teughels W; Van Assche N; Sliepen I; Quirynen M, Effect of material characteristics and/or surface topography on biofilm development. Clinical Oral Implants Research 2006, 17 (S2), 68–81. [DOI] [PubMed] [Google Scholar]
- 17.Kawai K; Urano M; Ebisu S, Effect of surface roughness of porcelain on adhesion of bacteria and their synthesizing glucans. The Journal of Prosthetic Dentistry 2000, 83 (6), 664–667. [PubMed] [Google Scholar]
- 18.Bashir ST; Yang L; Liggat JJ; Thomason JL, Kinetics of dissolution of glass fibre in hot alkaline solution. Journal of Materials Science 2018, 53, 1710–1722. [Google Scholar]
- 19.IPS e.max zirpress scientific documentation; Ivoclar vivadent.
- 20.Li HC; Wang DG; Hu JH; Chen CZ, Effect of various additives on microstructure, mechanical properties, and in vitro bioactivity of sodium oxide-calcium oxide-silica-phosphorus pentoxide glass–ceramics. Journal of Colloid and Interface Science 2013, 405, 296–304. [DOI] [PubMed] [Google Scholar]
- 21.Yoshida T, Leaching of zinc oxide in acidic solution. Materials Transactions 2003, 44, 2489–2493. [Google Scholar]
- 22.Dove PM; Icenhower J, Kinetic and thermodynamic controls on silica reactivity: an analog for waste disposal media In CEA/Valrho summer session Glass scientific research for high performance containment, France, 1997. [Google Scholar]
- 23.Bunker BC; Tallant DR; Headley TJ; Turner GL; Kirkpatrick RJ, The structure of leached sodium borosiicate glass. Physics and Chemistry of Glasses 1988, 29 (3), 106–120. [Google Scholar]
- 24.Bunker BC, Molecular mechanisms for corrosion of silica and silicate glasses. Journal of Non-Crystalline Solids 1994, 179, 300–308. [Google Scholar]
- 25.Kukizaki M; Nakashima T, Acid leaching process in the preparation of porous glass membranes from phase-separated glass in the Na2O-CaO-MgO-Al2O3-Ba2O3-SiO2 system. Membrane 2004, 29 (5), 301–308. [Google Scholar]
- 26.Douglas RW; El-Shamy TMM, Reactions of Glasses with Aqueous Solutions. Journal of The American Ceramic Society 1967, 50, 1–8. [Google Scholar]
- 27.Esquivel-Upshaw JF; Dieng FY; Clark AE; Neal D; Anusavice KJ, Surface degradation of dental ceramics as a function of environmental pH. Journal of dental research 2013, 92 (5), 467–471. [DOI] [PMC free article] [PubMed] [Google Scholar]
- 28.Molchanov VS; Prikhid'ko NE, Corrosion of silicate glasses by alkaline solutions Communication 4. Corrosion of glasses by solutions of various hydroxides. Russ Chem Bull 1958, 7 (8), 893–897. [Google Scholar]
- 29.Hubbard D; Rynders GF, Voltage Anomalies of the Glass Electrode and the Chemical Durability of the Glass Journal of Research of the National Bureau of Standards 1947, 39, 561–570. [DOI] [PubMed] [Google Scholar]
- 30.Hench LL; Clark DE, Physical chemistry of glass surfaces. Journal of Non-Crystalline Solids 1978, 28, 83–105. [Google Scholar]
- 31.Ritzberger C; Schweiger M; Höland W, Principles of crystal phase formation in Ivoclar Vivadent glass-ceramics for dental restorations. Journal of Non-Crystalline Solids 2016, 432, 137–142. [Google Scholar]
- 32.Zhu Y; Zhang X; Chen Y; Xie Q; Lan J; Qian M; He N, A comparative study on the dissolution and solubility of hydroxylapatite and fluorapatite at 25°C and 45°C. Chemical Geology 2009, 268 (1), 89–96. [Google Scholar]
- 33.Chaïrat C; Oelkers EH; Schott J; Lartigue J-E, Fluorapatite surface composition in aqueous solution deduced from potentiometric, electrokinetic, and solubility measurements, and spectroscopic observations. Geochimica et Cosmochimica Acta 2007, 71 (24), 5888–5900. [Google Scholar]