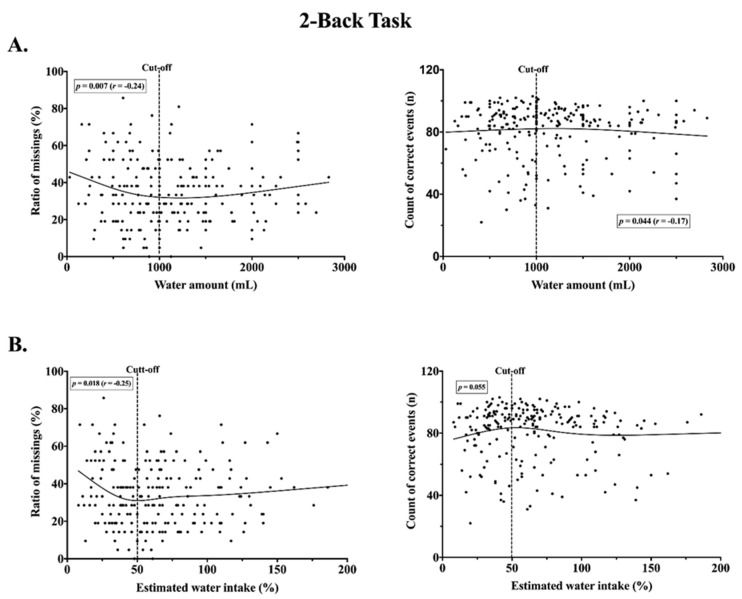
Figure 5.
Scatterplots of a relationship between water intake during a school day and cognitive performance in the 2-back task. (A) Non-linear negative association for ratio of missings and water amount below cut-off (n = 107). Non-linear positive association for correct events and water amount over cut-off (n = 107) (B). Non-linear negative association for ratio of missings and percentage of estimated water intake below cut-off (n =90). No association for correct events and percentage of estimated water intake below cut-off (n = 90).

