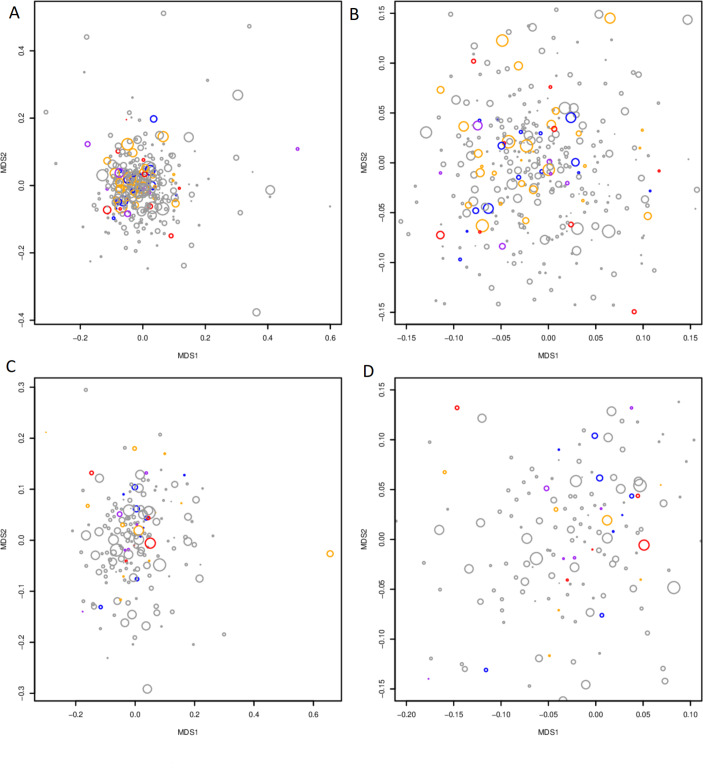
Figure 4.
NMDS highlighting IBS diagnosis (red: IBS-D; blue: IBS-C; orange: IBS-M; purple: IBS-U) and total GSRS score (circle size). (A) MAM (B) inset of (A), highlighting the most densely populated area of the NMDS. (C) Faecal samples. (D) Inset of (C), highlighting the most densely populated area of the NMDS. IBS, irritable bowel syndrome; MAM, mucosa-associated microbiome.

