Abstract
The genome-scale transcriptional programs that specify the mammalian trachea and esophagus are unknown. Though NKX2-1 and SOX2 are hypothesized to be co-repressive master regulators of tracheoesophageal fates, this is untested at a whole transcriptomic scale and their downstream networks remain unidentified. By combining single-cell RNA-sequencing with bulk RNA-sequencing of Nkx2-1 mutants and NKX2-1 ChIP-sequencing in mouse embryos, we delineate the NKX2-1 transcriptional program in tracheoesophageal specification, and discover that the majority of the tracheal and esophageal transcriptome is NKX2-1 independent. To decouple the NKX2-1 transcriptional program from regulation by SOX2, we interrogate the expression of newly-identified tracheal and esophageal markers in Sox2/Nkx2-1 compound mutants. Finally, we discover that NKX2-1 binds directly to Shh and Wnt7b and regulates their expression to control mesenchymal specification to cartilage and smooth muscle, coupling epithelial identity with mesenchymal specification. These findings create a new framework for understanding early tracheoesophageal fate specification at the genome-wide level.
Research organism: Mouse
eLife digest
The trachea or windpipe is a tube that connects the throat to the lungs, while the esophagus connects the throat to the stomach. The trachea has cartilage rings that help to ensure clear airflow to the lungs, while the esophagus walls are lined with muscles that help to move food to the stomach. Although there are many differences between them, both the trachea and esophagus form from the same group of cells during development.
Proteins called transcription factors help to control the formation of different body parts by switching different groups of genes on and off in different subsets of cells. Existing research has suggested that a transcription factor called NKX2.1 drives trachea formation, while another, called SOX2, is important in esophagus formation. An absence of either of these two proteins is thought to be associated with serious birth defects including loss of the trachea or esophagus, or failure of the two to separate fully. How these two transcription factors interact and drive the development of the trachea and esophagus, however, is currently unclear.
Kuwahara et al. used mice to study the role of NKX2.1 and SOX2 in the formation of the trachea and esophagus. The findings identify many new genes that are active in the trachea and esophagus and reveal that NKX2.1 is not a master regulator that controls all of the genes involved in trachea formation. However, NKX2.1 does control several key genes, particularly those involved in forming cartilage in the trachea instead of muscle in the esophagus. The investigation also revealed many genes that are not controlled by NKX2.1 suggesting that other, currently unknown, systems play a major role in trachea formation.
More work is required to understand the wider genetic regulators involved in differentiating the trachea from the esophagus. The findings in this study will help researchers to understand birth defects in the trachea and esophagus that result from genetic errors. They also reveal information about gene regulation processes that are relevant to the formation of other body parts and in the context of other diseases. In the long term, they could support regenerative medicine to regrow or replace lost or damaged body parts using lab-grown stem cells.
Introduction
Proper specification of the trachea and esophagus is critical for the function of the respiratory and digestive systems. Formation of the trachea and esophagus requires signals from the splanchnic mesenchyme which specify ventral and dorsal domains of the foregut endoderm tube, resulting in lung bud outgrowth and the initiation of physical separation of the trachea and esophagus (Billmyre et al., 2015; Cardoso and Lü, 2006; Domyan et al., 2011; Goss et al., 2009; Harris-Johnson et al., 2009; Morrisey et al., 2013; Rankin et al., 2018; Rankin et al., 2016; Shannon et al., 1998; Stevens et al., 2017). Ultimately, the tracheal epithelium is composed of multi-ciliated, secretory, and basal cells within a pseudostratified columnar monolayer which is surrounded by mesenchyme-derived ventral cartilaginous rings, and dorsal smooth muscle of the trachealis. The esophagus consists ultimately of a stratified squamous keratinized epithelium surrounded by smooth muscle. Early failure of tracheoesophageal (TE) fate specification can result in an unseparated common foregut endoderm tube, producing common congenital pathologies known as tracheoesophageal fistula (TEF) or tracheal agenesis (TA) (Billmyre et al., 2015; Morrisey and Hogan, 2010; Sher and Liu, 2016). Other anomalies of foregut development, such as tracheomalacia and congenital tracheal stenosis, involve the improper formation of the adjacent tracheal mesenchyme-derived cartilage and smooth muscle (Morrisey and Hogan, 2010; Sher and Liu, 2016). While foregut malformations in humans are common, we know very little of the genetic causes of these defects, in part due to a paucity of information of normal tracheoesophageal transcriptional patterning.
The earliest marker of tracheal and lung fate is the transcription factor NKX2-1 (TTF1) which is expressed in the ventral foregut in a pattern complementary to the dorsally enriched expression of the transcription factor SOX2 (Guazzi et al., 1990; Minoo et al., 1999; Mizuno et al., 1991; Que et al., 2007). Disruption of Nkx2-1 in mice resulted in upregulation of SOX2 in the ventral endoderm and differentiation of the adjacent mesenchyme into smooth muscle rather than tracheal cartilage (Minoo et al., 1999; Que et al., 2007). Conversely, hypomorphic disruption of Sox2 in mice resulted in upregulation of dorsal NKX2-1 and a conversion of the stratified esophageal epithelium to a simple columnar epithelium surrounded by smooth muscle that histologically resembles that of the trachea (Que et al., 2007; Teramoto et al., 2019). Similarly, knockdown of SOX2 in human induced pluripotent stem cell (hiPSC)-derived dorsal foregut cells resulted in upregulation of NKX2-1, and forced expression of SOX2 in hiPSC-derived ventral foregut cells repressed NKX2-1 (Trisno et al., 2018). Together these data have given rise to a model in which NKX2-1 and SOX2 form a co-repressive master regulatory switch to define tracheal and esophageal cell fates (Billmyre et al., 2015; Domyan et al., 2011; Que et al., 2007; Teramoto et al., 2019; Trisno et al., 2018). The regulatory programs downstream of NKX2-1 and SOX2 are not known and, therefore, the extent to which each promotes or represses tracheal and esophageal cell fates is not clear. Moreover, beyond these two transcription factors, we currently know very little about the transcriptional identity of the early dorsoventral endodermal populations that ultimately give rise to the trachea and esophagus.
The mechanisms coupling epithelial and mesenchymal fate specification in the trachea and esophagus are not well understood, but involve epithelial to mesenchymal signaling. For example, loss of WNT signaling from the endoderm to the tracheal mesenchyme results in a loss of tracheal cartilage and a corresponding expansion of smooth muscle (Hou et al., 2019; Kishimoto et al., 2019; Snowball et al., 2015). SHH signaling regulates smooth muscle specification in multiple contexts (Huycke et al., 2019; Mao et al., 2010) and loss of SHH signaling from the airway and intestinal epithelium results in loss of smooth muscle formation (Kim et al., 2015; Litingtung et al., 1998; Pepicelli et al., 1998) and mispatterning of tracheal cartilage (Miller et al., 2004; Sala et al., 2011). Thus, while WNT and SHH signaling are critical for foregut mesenchymal differentiation, how these signals are transcriptionally regulated in the tracheal and esophageal epithelium is currently unknown.
In this study, we dissect the transcriptional regulation of tracheal and esophageal fate specification by combining multiple genomic approaches. By single cell RNA-sequencing (scRNA-seq) we define the transcriptional identity of the trachea, esophagus, and lung at their initial stages of development, and identify new and robust markers of tracheoesophageal specification. We then dissect the NKX2-1 regulatory program that specifies TE identity using our scRNA-seq datasets, in combination with bulk RNA-sequencing of Nkx2-1-/- mutant tracheas, and NKX2-1 chromatin immunoprecipitation and sequencing (ChIP-seq) of wild type tracheas. We discover a previously unknown NKX2-1-independent transcriptional program that encompasses the majority of the newly-identified tracheal and esophageal transcriptomes. We assay the NKX2-1 transcriptional program in functional compound mouse mutant experiments to test whether NKX2-1 regulates these TE genes through repression of SOX2 or independently of SOX2. These data uncover a role for NKX2-1 in regulating epithelial-to-mesenchymal signaling, thereby coupling TE epithelial identity with cartilage and smooth muscle fate specification. This study therefore establishes a new framework for understanding key regulators of early cell fate specification in the trachea and esophagus.
Results
Single cell transcriptomics identifies dorsoventral populations of the foregut
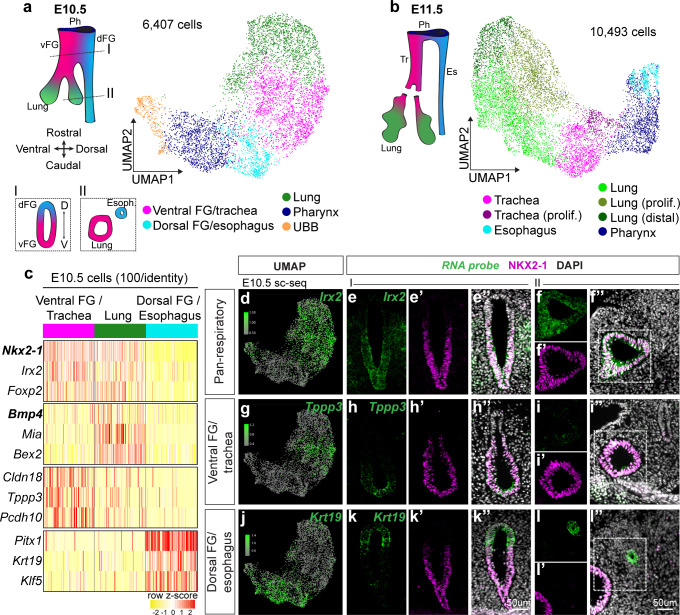
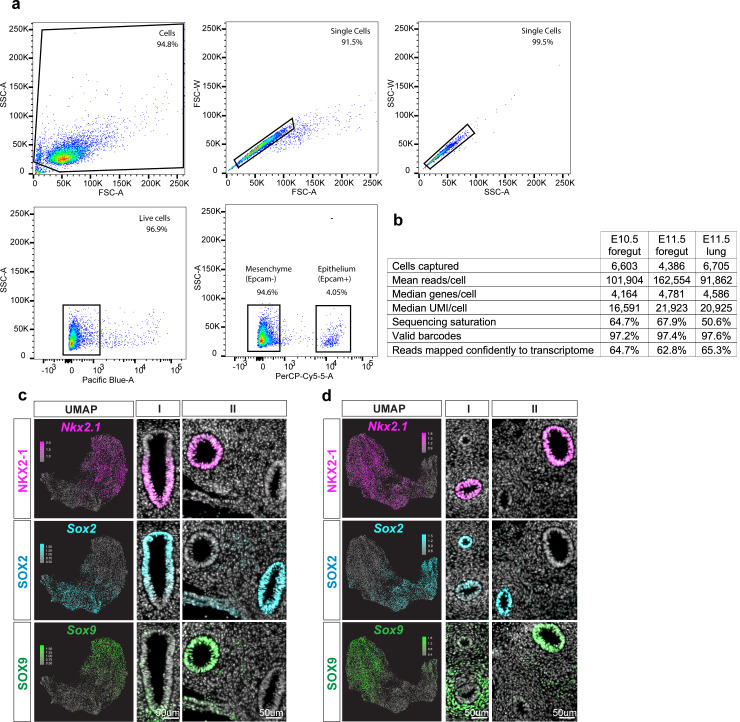
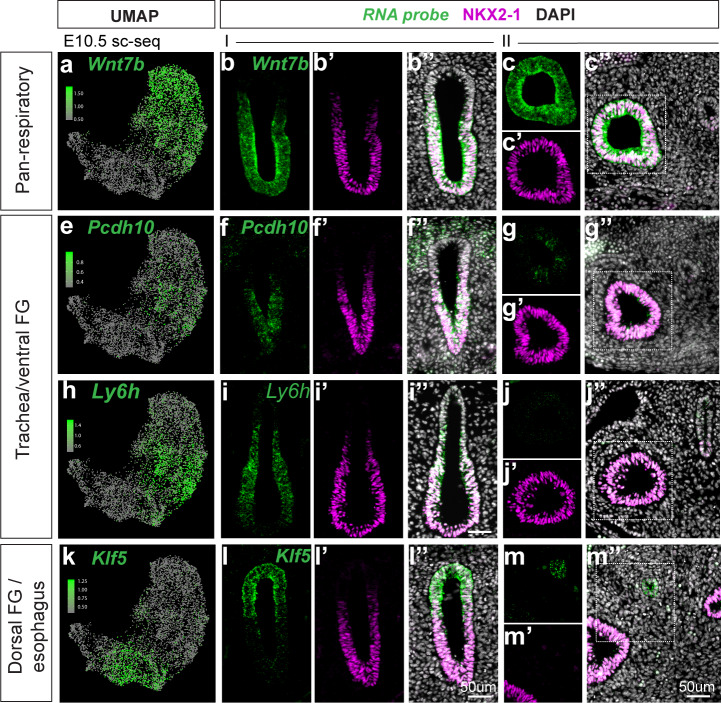
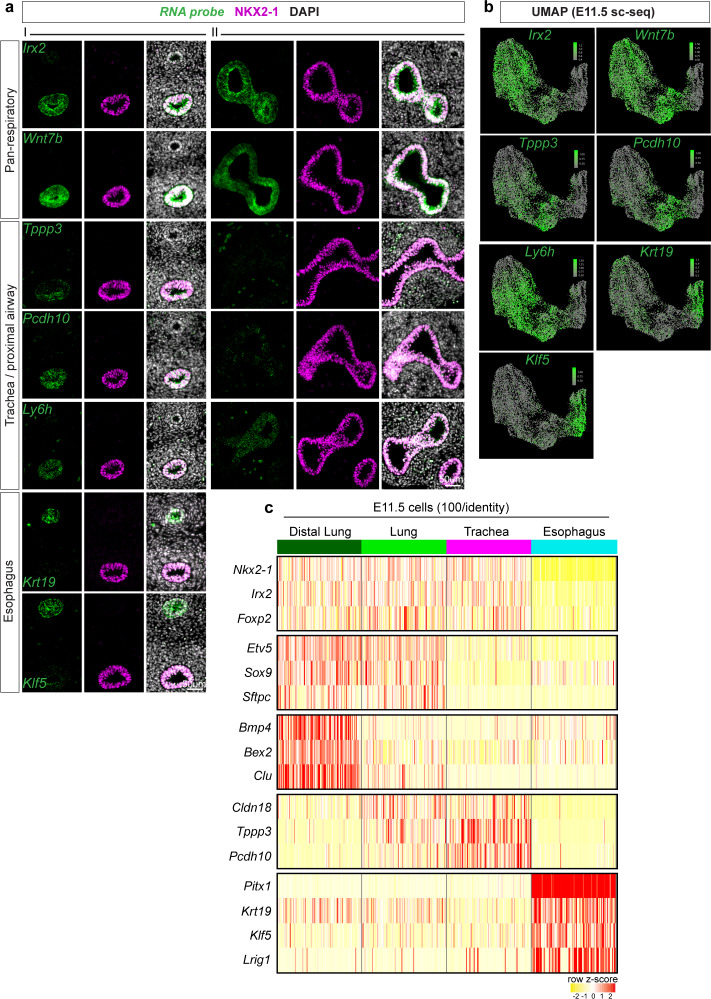
To understand how the trachea and esophagus are specified on a transcriptome-wide scale, we performed droplet-based single-cell RNA sequencing (scRNA-seq) on E10.5 mid-separation and E11.5 post-separation dissected mouse foregut epithelial cells. We generated 6407 single-cell transcriptomes at E10.5, comprising 5 cell clusters, and 10,493 single-cell transcriptomes at E11.5, comprising 7 cell clusters, and visualized these clusters using Uniform Manifold Approximation and Projection (UMAP) dimensional reduction (Becht et al., 2019; Stuart et al., 2018; Figure 1a,b). We delineated the dorsoventral axis in our scRNA-seq data at E10.5 and E11.5 by projecting the expression levels of Nkx2-1 and Sox2 on the UMAP (Figure 1—figure supplement 1c,d). Similarly, Sox9, a marker of developing lung epithelium (Herriges et al., 2012; Perl et al., 2005; Rockich et al., 2013), marked a subset of Nkx2-1-positive respiratory cells, enabling us to distinguish distal lung from trachea (Figure 1—figure supplement 1c,d). Using differential expression analysis for each cell cluster and RNAscope fluorescent in-situ hybridization, we defined cell clusters as lung, trachea, esophagus, and pharynx (Figure 1a–l’’, Figure 1—figure supplement 2a–m, Figure 1—figure supplement 3a–c, Figure 1—figure supplement 4a) as well as a cluster corresponding to the ultimobranchial body, a derivative of the pharyngeal endoderm that gives rise to the follicular cells of the thyroid (Nilsson and Fagman, 2017; Figure 1—figure supplement 4b). Within the E11.5 lung, we identified a cluster with unique expression of known distal lung markers such as Bmp4 (Weaver et al., 1999; Figure 1—figure supplement 3c, Figure 1—source data 1), demonstrating that the proximodistal lung axis can be identified by markers in our dataset. Signatures of proliferation also divided both the trachea and lung clusters at E11.5 (Figure 1b, Figure 1—source data 1).
Figure 1. Single-cell transcriptomics of the developing foregut epithelium identifies distinct dorsoventral populations.
Dissected, FACS-purified foregut epithelial cells were subjected to droplet-based single-cell RNA sequencing at E10.5 and E11.5. (a) UMAP representation of 6,407 cells identified at E10.5 and (b) 10,493 cells identified at E11.5. Colors represent cell populations identified using shared nearest neighbor clustering. vFG: ventral foregut, dFG: dorsal foregut, Ph: pharynx, UBB: ultimobranchial body, Tr: trachea, Es: esophagus. (c) Heatmap of selected marker gene expression across 100 E10.5 cells each of ventral foregut/trachea, lung, and esophagus/dorsal foregut as identified by scRNA-seq. Selected genes are markers of respiratory, lung, ventral FG/trachea, and dorsal FG/esophagus cells (top to bottom). n = 1 biological replicate/timepoint with 20 pooled embryos at E10.5 and 28 pooled embryos at E11.5. See also: Figure 1—source data 1. (d-l) RNA localization of pan-respiratory marker gene Irx2, ventral FG/trachea marker gene Tppp3, and dorsal FG/esophagus marker gene Krt19 identified from differential expression analysis of cell populations in scRNA-seq data at E10.5. First column shows projection of RNA expression level as determined by scRNA-seq on UMAP. Second-fourth columns show RNA expression of marker gene (green) and NKX2-1 expression (magenta) in the undivided region of E10.5 embryonic foreguts (I) as indicated by the positions of the schematic in a). Last two columns show staining in the lung and distal esophagus (II) as indicated by the positions of the schematic in a). All images were captured at 20X magnification and displayed at the same scale. Scale bar = 50 um.
Figure 1—figure supplement 1. Quality control metrics and characterization of single-cell RNA sequencing experiments.
Figure 1—figure supplement 2. Additional cell type-specific markers of dorsoventral populations identified by scRNA-seq at E10.5.
Figure 1—figure supplement 3. Cell type-specific markers of trachea, esophagus, and lung populations identified by scRNA-seq at E11.5.
Figure 1—figure supplement 4. Newly identified esophageal marker genes are more dorsally restricted than SOX2.
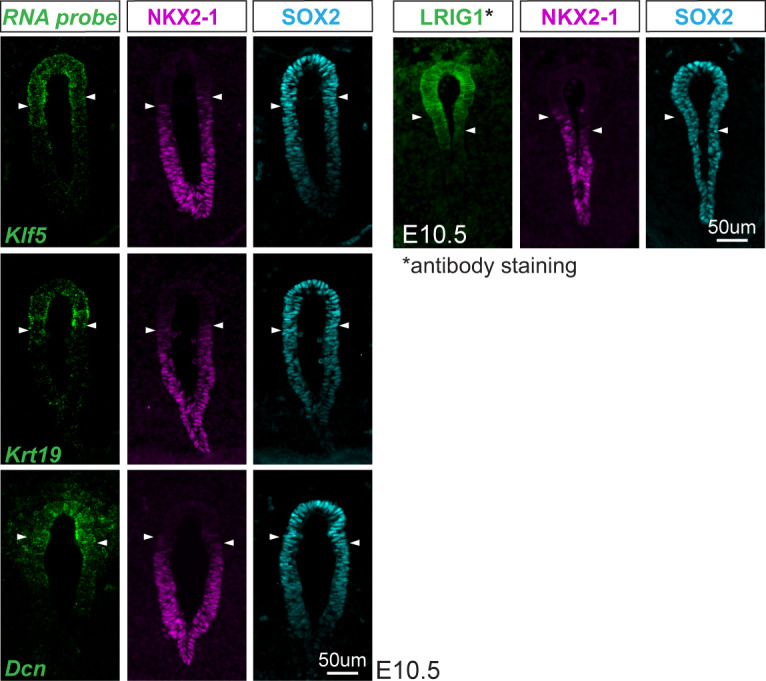
Figure 1—figure supplement 5. Validation of pharynx and UBB cluster identities.
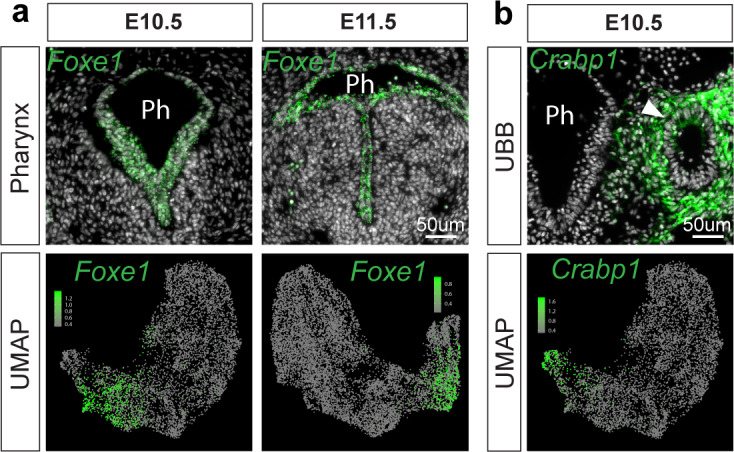
Our scRNA-seq data revealed a wealth of genes previously unknown to mark cell types of the ventral and dorsal foregut prior to TE separation (Figure 1c, Figure 1—source data 1), as well as new genes that distinguish the trachea, lung, and esophagus after TE separation (Figure 1—figure supplement 3c, Figure 1—source data 1). To visualize their spatial expression, we performed RNAscope for several genes marking each of these cell types in the undivided E10.5 foregut and lung (Figure 1d–l; Figure 1—figure supplement 2a–m), and the E11.5 trachea, esophagus, and lung (Figure 1—figure supplement 3). In all cases, RNAscope analysis confirmed our scRNA-seq finding and provided additional information about the spatial patterns of marker gene expression. We found many genes, including Klf5, Krt19, Dcn, Pitx1, and Lrig1 that exhibited expression specifically within the dorsal foregut/esophageal cells (Figure 1c,j–l’’; Figure 1—figure supplement 2k–m”, Figure 1—figure supplement 3, Figure 3—figure supplement 1b). Interestingly, within the foregut endoderm, all of these genes were more dorsally restricted than SOX2 and were more precisely complementary to NKX2-1, indicating that they may serve as better markers of the esophagus during its early development (Figure 1—figure supplement 4). Notably, we also discovered genes such as Tppp3, Pcdh10, Ly6h, and Cldn18 that exhibited enrichment in the ventral foregut at E10.5 (Figure 1c,g–i”, Figure 1—figure supplement 2e-j') and specifically marked the trachea and proximal airway at E11.5 (Figure 1—figure supplement 3). Our discovery of this gene class indicates that the trachea and proximal airway are actively transcriptionally specified and at least somewhat distinct from the lung during early respiratory development. All tracheal and esophageal markers we identified and validated were dorsoventrally restricted in the common foregut of E10.5 embryos prior to physical separation of the trachea and esophagus, consistent with extensive fate specification before TE separation (Billmyre et al., 2015). Together, these data uncover a multitude of previously unknown genes that define initial dorsoventral patterning of the foregut and the earliest stages of the trachea, lung, and esophagus.
Identification of the NKX2-1 transcriptional program and an independent program of TE specification
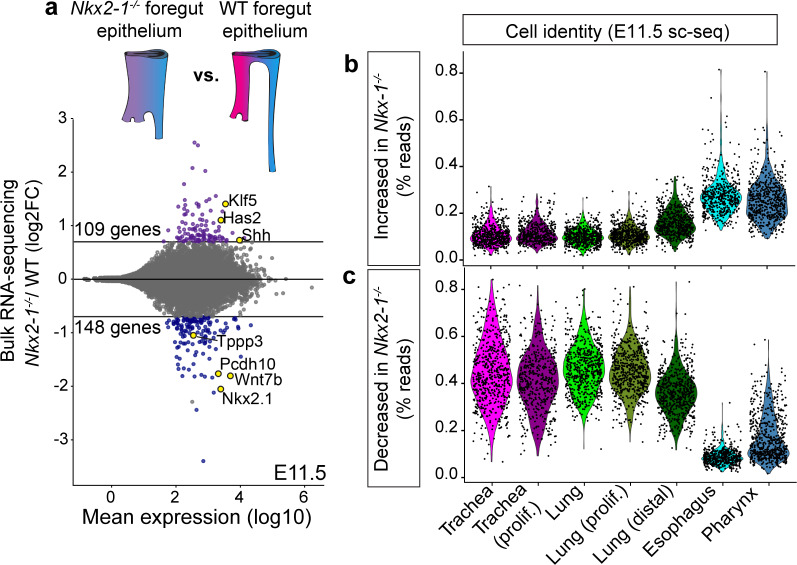
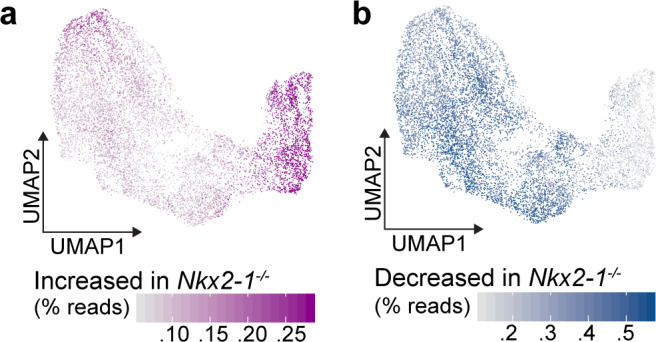
Given our discovery of a broad network of previously unknown genes expressed during early TE specification, we sought to examine how tracheoesophageal fates are dysregulated upon Nkx2-1 loss at the transcriptome-wide scale. We performed RNA-sequencing (RNA-seq) of dissected and FACS-purified foregut epithelium from E11.5 Nkx2-1-/- and wild-type (WT) embryos. Differential expression analysis between Nkx2-1-/- and WT foregut epithelium identified 257 NKX2-1-dependent genes, with 109 genes upregulated and 148 genes downregulated in Nkx2-1-/- foreguts (Figure 2a, Figure 2—source data 1). We examined the expression of these NKX2-1-dependent genes in our scRNA-seq dataset at E11.5 to determine, on a global-scale, where they were expressed in the developing foregut. We found that genes that were upregulated in Nkx2-1-/- mutants were enriched in cells of the esophagus and pharynx (Figure 2b, Figure 2—figure supplement 1a), and genes that were downregulated in Nkx2-1-/- mutants were enriched in tracheal and lung cells (Figure 2c, Figure 2—figure supplement 1b). Together, these data define the NKX2-1 transcriptional program in early TE development and support the hypothesis that, within this program, NKX2-1 positively regulates tracheal genes and negatively regulates esophageal genes.
Figure 2. Transcriptomic analysis of Nkx2-1-/- foreguts reveals NKX2-1 regulated tracheal and esophageal transcriptional programs.
(a) Dissected, FACS-purified epithelium from E11.5 Nkx2-1-/- and WT foreguts was sequenced and analyzed for differential gene expression. 109 genes were increased and 148 genes were decreased in Nkx2-1-/- foreguts compared to WT (DESeq2, log2FC > 0.7, padj < 0.05). Labeled genes show examples of tracheal genes that decrease in Nkx2-1-/- mutants (Tppp3, Pcdh10, Wnt7b, Nkx2-1), and esophageal genes that increase in Nkx2-1-/- mutants (Klf5, Has2, Shh). n = 3 biological replicates with two pooled embryos/replicate. See also: Figure 2—source data 1. (b-c) Combined expression of all genes that increase (b) or decrease (c) in Nkx2-1-/- foreguts as a percentage of all reads in E11.5 scRNA-seq data. Cells are grouped by their assigned cluster and clusters were subsampled to 600 cells/cluster for visualization.
Figure 2—figure supplement 1. NKX2-1-dependent gene expression in E11.5 scRNA-seq.
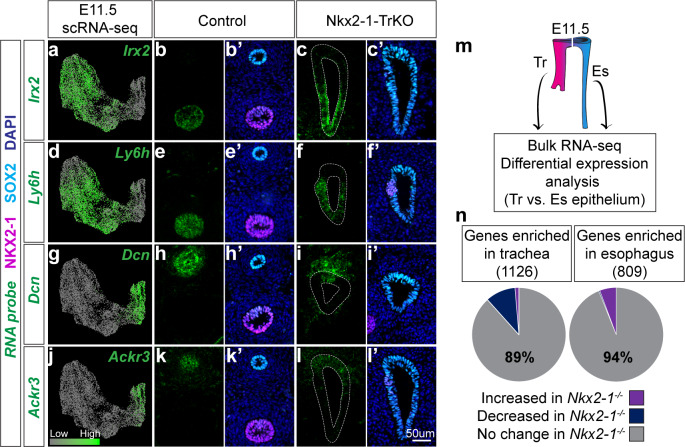
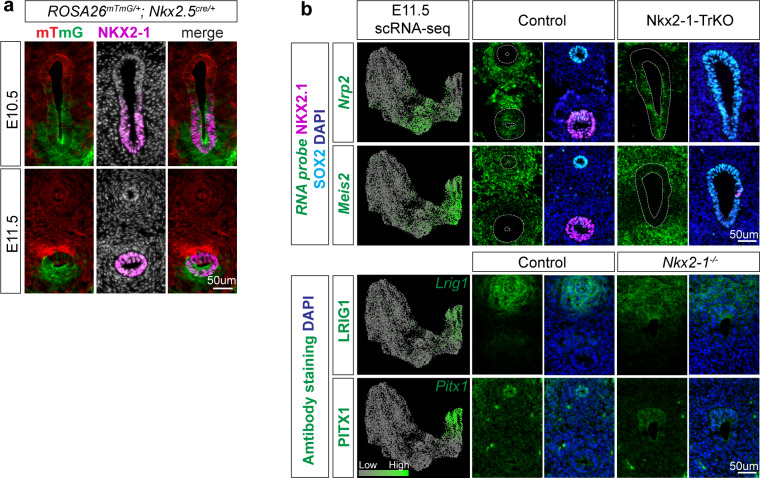
Surprisingly, our scRNA-seq dataset identified many genes that mark tracheal and esophageal cells that did not appear to exhibit a change in expression in our Nkx2-1-/- mutant RNA-seq analysis (Figure 1—source data 1, Figure 2—source data 1). We examined the spatial expression of several of these NKX2-1-independent genes using an Nkx2.5-cre strain which mediates recombination in the ventral foregut (Figure 3—figure supplement 1a; Stanley et al., 2004) to generate Nkx2-1lox/lox; Nkx2.5cre/+ (Nkx2-1-TrKO) embryos lacking NKX2-1 in the trachea. All Nkx2-1-TrKO embryos we examined exhibited a complete failure of foregut separation (n = 8/8 embryos). Using RNAscope, we found Irx2, Ly6h, and Nrp2 to be tracheal-specific and maintained in the ventral epithelium of the unseparated foregut tube in E11.5 Nkx2-1-TrKO embryos (Figure 3a–f’; Figure 3—figure supplement 1b). Likewise, we found Dcn, Ackr3, and Meis2 to be esophageal-specific and maintained in the dorsal region of the common foregut tube in Nkx2-1-TrKO foreguts (Figure 3g–l’; Figure 3—figure supplement 1b). Immunofluorescent staining also showed that the esophageal genes LRIG1 and PITX1 were maintained in the dorsal region of Nkx2-1-/- foreguts (Figure 3—figure supplement 1b). These data indicate the presence of an NKX2-1-independent transcriptional program within the developing trachea and esophagus, and suggest that Nkx2-1-/- mutant foreguts do not undergo a complete tracheal-to-esophageal fate conversion.
Figure 3. Identification of an NKX2-1-independent tracheal and esophageal program.
(a-l) RNA localization of NKX2-1-independent tracheal (Irx2, Ly6h) and esophageal (Dcn, Ackr3) makers identified by scRNA-seq and Nkx2-1-/- mutant RNA-seq data at E11.5. First column shows projection of RNA expression level as determined by scRNA-seq on UMAP. Second-fifth columns show RNA localization (green) in E11.5 control and Nkx2-1-TrKO embryos with immunofluorescent staining of NKX2-1 (magenta) and SOX2 (cyan). 8/8 Nkx2-1-TrKO embryos had TEF phenotype, n = 3 embryos/staining combination. All images were captured at 20X magnification and displayed at the same scale. Scale bar = 50 um. (m) Schematic of experimental procedures for RNA-seq and differential expression analysis of WT trachea and esophagus for comparison with Nkx2-1-/- mutant RNA-seq data. n = 3 biological replicates with four pooled embryos/replicate. See also: Figure 3—source data 1. (n). NKX2-1-dependent genes as a portion of genes enriched in WT trachea (left) and esophagus (right). NKX2-1-independent genes make up 89% of tracheal-enriched genes and 94% of esophageal enriched genes.
Figure 3—figure supplement 1. Nkx2.5-cre recombination, additional validation of NKX2-1-independent genes.
We therefore examined the extent to which tracheoesophageal patterning is independent of NKX2-1 by generating bulk transcriptional profiles of WT tracheal and esophageal epithelium at E11.5 to compare with our Nkx2-1-/- mutant bulk RNA-seq dataset (Figure 3m). Differential expression analysis identified 1126 genes enriched in the trachea and 809 genes enriched in the esophagus of WT embryos (Figure 3n, Figure 3—source data 1). Notably, only 11% of tracheal-enriched genes and 6% of esophageal-enriched genes in WT foreguts were affected by loss of NKX2-1, and the majority of tracheal- or esophageal-enriched genes were unchanged in Nkx2-1-/- foreguts (Figure 3n). Together, these findings define relevant NKX2-1 transcriptional targets during early tracheoesophageal development and uncover a significant NKX2-1-independent gene regulatory program.
NKX2-1 directly regulates foregut genes, with variable dependency on SOX2
To identify direct targets of NKX2-1 during TE specification, we performed NKX2-1 chromatin immunoprecipitation followed by sequencing (ChIP-seq) on dissected E11.5 WT trachea. We identified 15,861 genomic regions (peaks) shared between two biological replicates that showed NKX2-1 binding (Figure 4a, FDR < 0.00001) and were centrally enriched for the known NKX2-1 motif (Figure 4b, p=3.4e-37). We next looked closely at NKX2-1 binding at or near the loci of select NKX2-1-dependent tracheal and esophageal genes. We observed NKX2-1 binding at the Nkx2-1 promoter and five binding sites within 10 kb of the Nkx2-1 gene, consistent with previous data suggesting that NKX2-1 autoregulates its own expression (Nakazato et al., 1997; Oguchi and Kimura, 1998; Tagne et al., 2012), and also observed binding of NKX2-1 at the Sox2 promoter and four binding sites within the Sox2 locus, suggesting direct repression of Sox2 by NKX2-1 (Figure 4c). In addition, NKX2-1 binding was observed at the promoter of genes such as Pcdh10, Tppp3, and Klf5 that we identified as specific markers of the tracheal and esophageal lineages by scRNA-seq (Figure 4c), suggesting that these genes may also be direct targets of NKX2-1 regulation. Genome-wide comparison of NKX2-1-bound genes with the Nkx2-1-/- de-regulated transcriptome revealed that NKX2-1-dependent genes were associated with NKX2-1 ChIP-seq peaks at a higher frequency than observed at random (Figure 4d, Fisher’s exact test, p<0.0001). Furthermore, when we divided NKX2-1-dependent genes into those that were upregulated or downregulated in Nkx2-1-/- mutants, we found that genes that are downregulated in Nkx2-1-/- mutants are more frequently associated with NKX2-1 ChIP-seq peaks (Figure 4d, Fisher’s exact test, p<0.0001). These data suggest that whereas NKX2-1 is a direct positive regulator of tracheal-specific genes, repression of esophageal-specific genes may more often be indirect.
Figure 4. NKX2-1 binds directly to tracheoesophageal genes in the developing foregut.
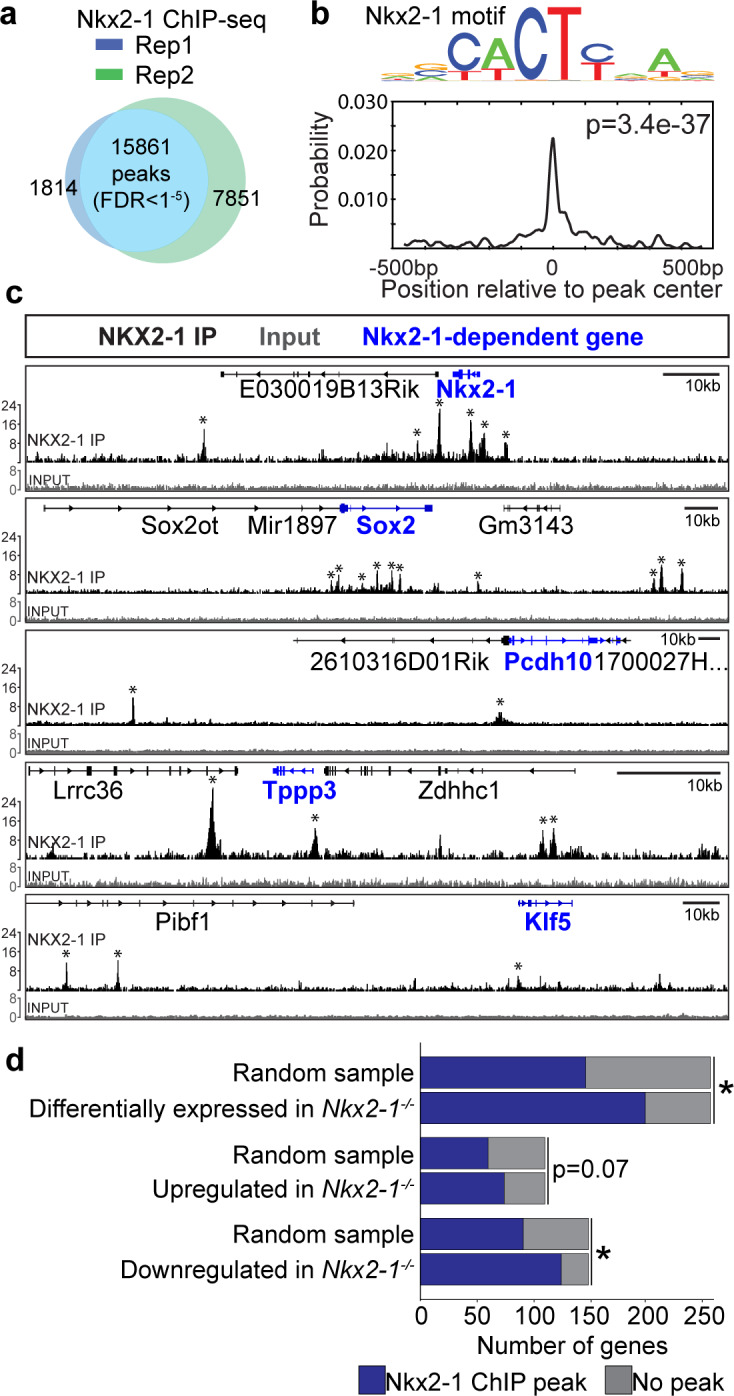
(a) ChIP-seq for NKX2-1 in E11.5 foreguts identified 15,861 NKX2-1-bound genomic regions (peaks) shared between replicates (FDR < 0.00001). n = 2 biological replicates with 175 pooled embryos/replicate. (b) Motif analysis of NKX2-1 ChIP-seq data shows peaks are enriched for the NKX2-1 motif (p=3.4e-37). (c) NKX2-1 ChIP-seq (black) and input (grey) tracks near loci of select NKX2-1-dependent genes (blue) Nkx2-1, Sox2, Pcdh10, Tppp3, and Klf5 visualized in IGV. Input and NKX2-1 IP tracks are displayed at the same linear scale, as indicated by IGV Data Range on the y-axis. Horizontal scale bar = 10 kb. (d) Genome-wide comparison of NKX2-1 ChIP-seq with Nkx2-1-/- mutant RNA-seq. Overlap of NKX2-1 ChIP-seq associated genes with NKX2-1-dependent genes (top), genes increased in Nkx2-1-/- mutants (middle) and genes decreased in Nkx2-1-/- mutants (lower). *asterisk = p < 0.0001, Fisher’s exact test.
Based on previous studies, NKX2-1 indirect regulation may be mediated through its repression of Sox2 (Billmyre et al., 2015). Indeed, given the well-established genetically co-repressive relationship of SOX2 and NKX2-1 in the foregut (Domyan et al., 2011; Que et al., 2007; Teramoto et al., 2019; Trisno et al., 2018), it is challenging to determine whether the transcriptional changes we observed in Nkx2-1-/- mutants are solely due to the loss of NKX2-1 or also due to the subsequent gain of SOX2. Thus, we devised a genetic strategy to uncouple NKX2-1 and SOX2 regulation of tracheal and esophageal genes by generating Nkx2-1; Sox2 compound mutant embryos. To achieve this, we again utilized Nkx2.5-cre to generate Nkx2-1lox/lox; Nkx2.5cre/+ (Nkx2-1-TrKO) embryos lacking NKX2-1, and Nkx2-1lox/lox; Sox2lox/lox; Nkx2.5cre/+ (Nkx2-1-TrKO; Sox2-TrKO) embryos lacking both NKX2-1 and SOX2 in the ventral foregut/trachea cells (Figure 5a–c). Similar to the Nkx2-1-TrKO embryos, all Nkx2-1-TrKO; Sox2-TrKO embryos we examined exhibited a complete failure of foregut separation (n = 6/6 embryos). We then examined NKX2-1-regulated genes that were determined by our scRNA-seq analysis to be markers of E11.5 trachea or esophagus. The expression of the tracheal-specific genes Pcdh10 and Tppp3 was decreased in Nkx2-1-TrKO and Nkx2-1-TrKO; Sox2-TrKO ventral foreguts indicating that their expression requires NKX2-1 but not upregulation of SOX2 (Figure 5d–i’), Conversely, expression of the esophageal-specific genes Klf5 and Has2 was upregulated in the ventral foreguts of Nkx2-1-TrKO, as predicted from our RNA-seq analysis (Figure 5j–o’). Interestingly, whereas Klf5 expression was also increased in the ventral foregut of Nkx2-1tr/tr; Sox2tr/tr mutants (arrowhead Figure 5l,l’), Has2 expression was not, with the exception of a few cells that retain SOX2 expression ventrally (arrowhead in Figure 5o,o’). Thus, while Klf5 and Has2 were both repressed by NKX2-1, upregulation of Has2 in the ventral foregut of Nkx2-1-TrKO embryos appears to also depend on the upregulation of SOX2 in this region. Together, these results revealed that NKX2-1 regulation results from both direct activation of tracheal genes and repression of esophageal genes, as well as the indirect suppression of target genes through the repression of Sox2, illustrating the complex relationship between these two transcription factors with opposing expression patterns.
Figure 5. NKX2-1 regulates target genes in a SOX2-dependent and independent manner.
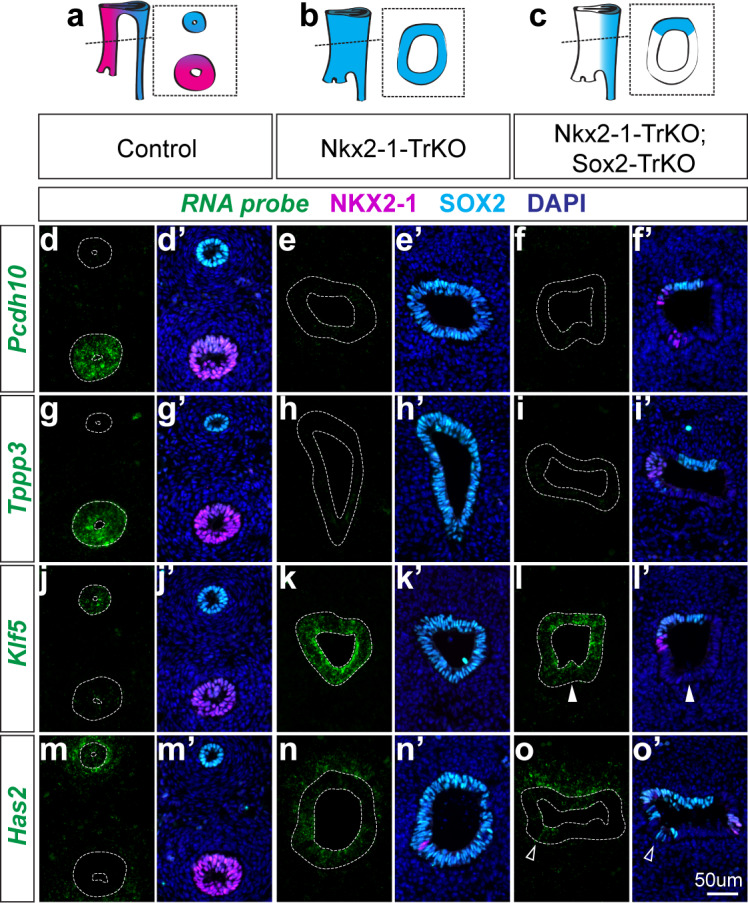
(a-c) Schematic of Nkx2-1; Sox2 compound mutant analysis phenotypes and resulting NKX2-1 and SOX2 expression patterns in E11.5 control embryos (a), Nkx2-1-TrKO mutants (b), Nkx2-1-TrKO; Sox2-TrKO mutants (c). 8/8 Nkx2-1-TrKO embryos and 6/6 Nkx2-1-TrKO; Sox2-TrKO embryos examined had TEF phenotype. (d-f) RNA localization of NKX2-1-dependent, SOX2-independent gene Pcdh10 in control (d), Nkx2-1-TrKO (e), and Nkx2-1-TrKO; Sox2-TrKO (f) embryos with immunofluorescent staining of NKX2-1 (magenta) and SOX2 (cyan). (g–i) Tracheal, NKX2-1-dependent, SOX2-independent gene Tppp3. (j–l) Esophageal, NKX2-1-dependent, SOX2-independent gene Klf5. Solid arrowheads indicate SOX2-negative, Klf5-positive ventral cell. (m–o) Esophageal, NKX2-1-dependent, SOX2-dependent gene Has2. Arrowheads indicate ventral SOX2-positive, Has2-positive cells. n = 3 embryos/staining combination. All images were captured at 20X magnification and displayed at the same scale. Scale = 50 um.
NKX2-1 regulates Wnt7b and Shh to couple tracheal endoderm identity to mesenchymal cell fate
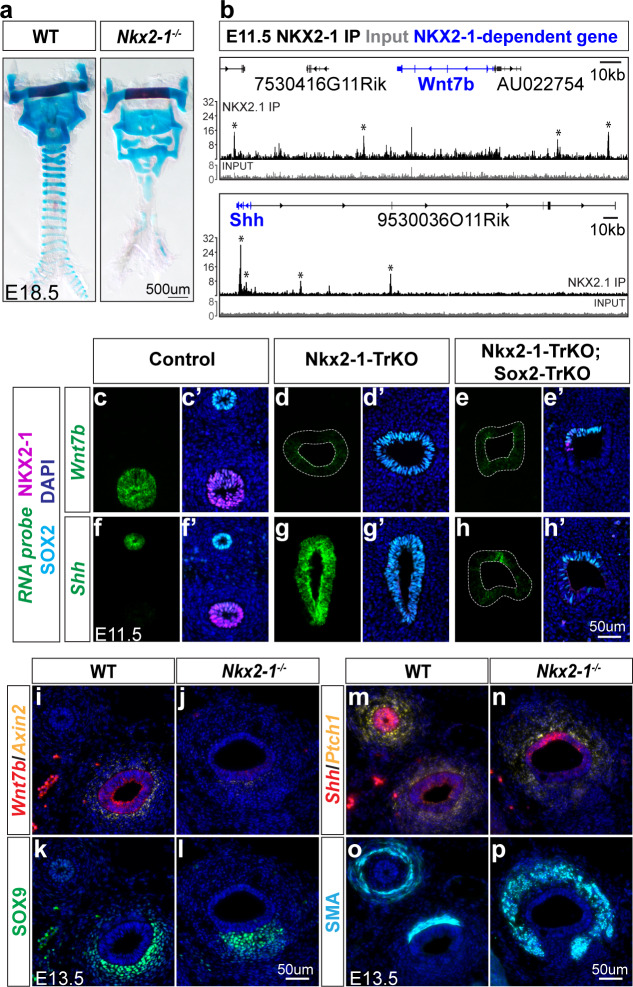
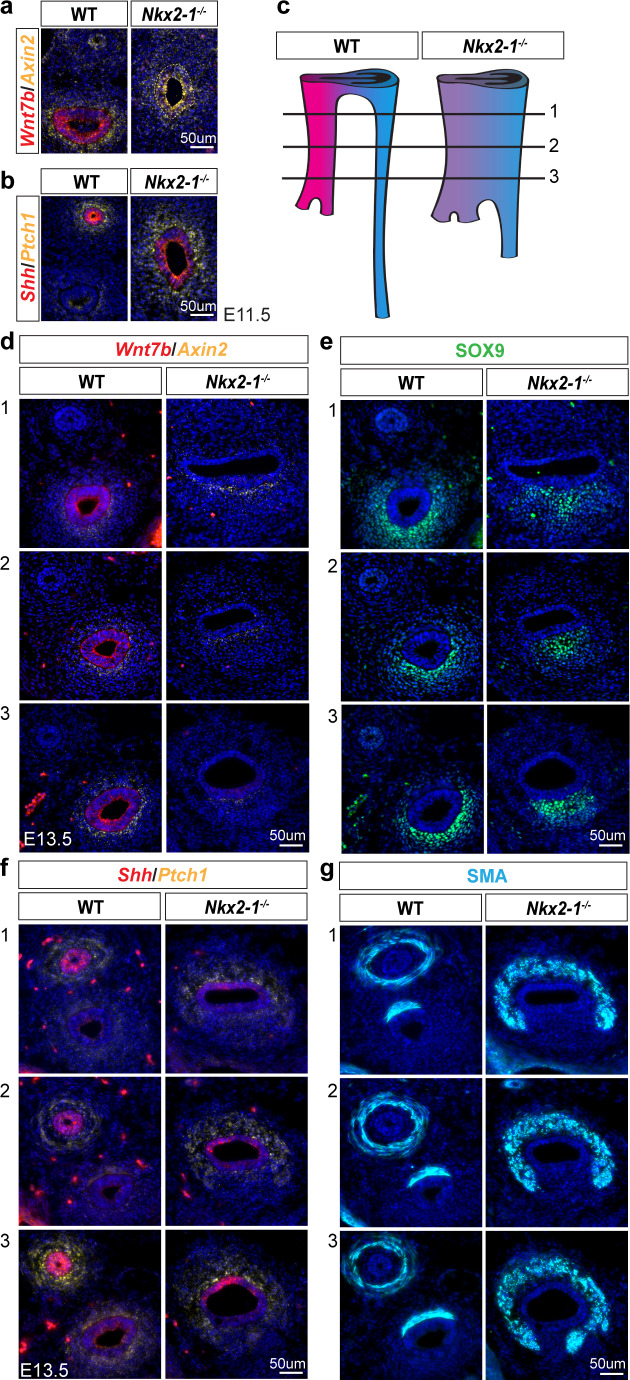
The apparent fate transformation of Nkx2-1-/- mutant trachea to esophagus is supported by the conversion of ventral mesenchymal cell fates from tracheal cartilage to smooth muscle (Minoo et al., 1999; Que et al., 2007; Yuan et al., 2000). We confirmed previous reports of a dramatic reduction and disorganization of tracheal cartilage with expansion of the smooth muscle in Nkx2-1-/- mutants, and additionally observed malformation of the thyroid and cricoid cartilage (n = 3/3 embryos, Figure 6a,o,p). Our finding that the endoderm in Nkx2-1-/- mutants did not exhibit a complete fate transformation led us to ask whether we could uncover the specific NKX2-1 targets that impact epithelial to mesenchymal signaling amongst this more limited set of candidates. Notably, Wnt7b expression decreased and Shh increased in Nkx2-1-/- foregut epithelium compared to WT (Figure 2a), and both signaling genes have known functions in tracheal cartilage and smooth muscle formation. In WT E11.5 and E13.5 embryos, Wnt7b is expressed in the tracheal epithelium and Shh is expressed more strongly in the esophageal epithelium (Gerhardt et al., 2018; Litingtung et al., 1998; Rajagopal et al., 2008; Snowball et al., 2015; Figure 6c,f,i,m). We examined our NKX2-1 ChIP-seq data to determine whether NKX2-1 binds directly to Wnt7b and Shh in the trachea and observed binding at three sites 20 kb and 60 kb upstream and 20 kb downstream of the Wnt7b gene. Though a previous study detected binding of NKX2-1 to the Wnt7b promoter in a lung epithelial cell line (Weidenfeld et al., 2002), we instead observe binding at three sites 20 kb and 60 kb upstream and 20 kb downstream of the Wnt7b gene. We also observed two NKX2-1 ChIP-seq peaks within the Shh gene, and two additional peaks 50 kb and 150 kb upstream of Shh, consistent with the possibility of direct regulation by NKX2-1 (Figure 6b). Together, these data indicate that Wnt7b and Shh are targets of NKX2-1 regulation in the developing foregut.
Figure 6. NKX2-1 regulates mesenchymal specification via Wnt7b and Shh-mediated epithelial-mesenchymal crosstalk.
(a) Alcian blue staining of tracheal cartilage in E18.5 control and Nkx2-1-/- embryos. 3/3 embryos examined exhibited similar cartilage phenotype. (b) ChIP-seq of direct NKX2-1 binding near Wnt7b and Shh loci. Input and NKX2-1 IP tracks are displayed at the same linear scale, as indicated by IGV Data Range on the y-axis. Horizontal scale bar = 10 kb. (c–h) RNA localization (green) of Wnt7b (c–e) and Shh (f–h) in control (left), Nkx2-1-TrKO (middle), and Nkx2-1-TrKO; Sox2-TrKO (right) E11.5 embryos with immunofluorescent staining of NKX2-1 (magenta) and SOX2 (cyan). (i–j) RNA localization of Wnt7b (red) and Axin2 (yellow) in WT and Nkx2-1-/- E13.5 foreguts. 3/3 embryos display phenotype. (k–l) SOX9 staining (green) of cartilage progenitors in WT and Nkx2-1-/- E13.5 foreguts. 3/3 embryos display phenotype. (m–n) RNA localization of Shh (red) and Ptch1 (yellow) in WT and Nkx2-1-/- E13.5 foreguts. 2/2 embryos display phenotype. (o–p) Smooth muscle actin (SMA) staining (cyan) of smooth muscle in WT and Nkx2-1-/- E13.5 foreguts. 3/3 embryos display phenotype. All images were captured at 20X magnification and images within each staining panel are at the same scale. Scale = 50 um.
Figure 6—figure supplement 1. NKX2-1 regulation of epithelial-mesenchymal signaling.
To determine whether NKX2-1 regulates Wnt7b and Shh through a change in SOX2 expression, we examined Nkx2-1; Sox2 compound mutants. Wnt7b expression was lost in both Nkx2-1-TrKO and Nkx2-1-TrKO; Sox2-TrKO foreguts, suggesting that NKX2-1 regulates Wnt7b independently of regulation by SOX2 (Figure 6c–e’). However, the increase in Shh expression in the ventral foregut observed in Nkx2-1-TrKO embryos was not observed in Nkx2-1-TrKO; Sox2-TrKO foreguts (Figure 6f–h’), indicating that SOX2 is required for upregulation of Shh in the ventral foregut. Thus, Wnt7b expression is positively regulated by NKX2-1 but not subject to regulation by SOX2, whereas the dorsally restricted expression of Shh is mediated by the combined action of NKX2-1 and SOX2.
To determine whether NKX2-1 regulation of Wnt7b and Shh impacts epithelial-mesenchymal signaling, we first examined the expression of Wnt7b and downstream canonical WNT signaling transcriptional target Axin2 in E11.5 and E13.5 Nkx2-1-/- and WT foreguts. Whereas in WT embryos Axin2 expression was localized to the ventral tracheal mesenchyme where SOX9+ cartilage progenitor cells are found, in Nkx2-1-/- mutants Axin2 expression was decreased and correlated with disorganized SOX9 expression (Figure 6i–l, Figure 6—figure supplement 1a). This decrease in Axin2 expression was more dramatic in the caudal foregut, consistent with the increased severity of cartilage specification defects in this region seen in skeletal preparations (Figure 6a) and as visualized by SOX9 localization in Nkx2-1-/- foreguts (Figure 6—figure supplement 1c–e). We next examined the expression of Shh and downstream transcriptional target Ptch1 in Nkx2-1-/- mutant and WT foreguts. In E11.5 and E13.5 Nkx2-1-/- foreguts, increased expression of Shh in the ventral foregut epithelium compared to WT was mirrored by an increase in Ptch1 expression in the surrounding mesenchyme (Figure 6m,n; Figure 6—figure supplement 1b). This increase in Ptch1 expression also corresponded with the increase in smooth muscle as visualized by ACTA2 (i.e. α-SMA) surrounding Nkx2-1-/- foreguts compared to WT (Figure 6m–p, S8c,f,g). Thus, our data show that in addition to regulating a subset of genes that define tracheoesophageal epithelial identity at this stage, NKX2-1 and SOX2 regulate epithelial-mesenchymal crosstalk via WNT and SHH signaling to instruct mesenchymal differentiation, explaining this aspect of the observed TE fate transformation in Nkx2-1-/- mutant foreguts (Figure 7).
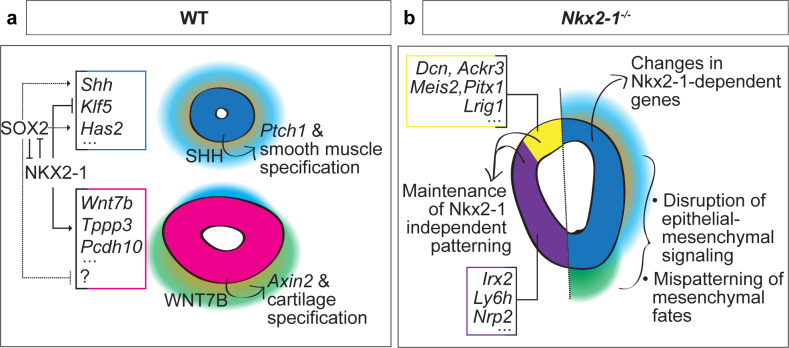
Figure 7. Proposed model of NKX2-1-dependent and -independent tracheoesophageal specification.
(a) Schematic of NKX2-1 and SOX2 regulation of gene expression in WT trachea and esophagus, and epithelial-mesenchymal signaling downstream of NKX2-1. NKX2-1 negatively regulates esophageal genes Shh, Klf5 and Has2, and positively regulates tracheal genes Wnt7b, Tppp3, and Pcdh10. SOX2 is required for expression of Shh and Has2. NKX2-1 regulation of Shh and Wnt7b influences mesenchymal SHH and WNT response required for smooth muscle and tracheal cartilage development. (b) Schematic of Nkx2-1-/- mutant phenotype. Maintenance of the NKX2-1-independent transcriptional program includes dorsal expression of Dcn, Ackr3, Meis2, Pitx1, and Lrig1 and ventral expression of Irx2, Ly6h, and Nrp2. NKX2-1-dependent transcriptional changes include increased expression of esophageal genes and decreased expression of tracheal genes in the ventral foregut, accompanied by changes in epithelial-mesenchymal signaling and mesenchymal differentiation.
Discussion
NKX2-1 is a critical regulator of respiratory development across vertebrates (Minoo et al., 1999; Rankin et al., 2018; Small et al., 2000; Yuan et al., 2000), but how it directs TE specification was unknown. It has been previously demonstrated in adenocarcinoma and in the adult distal lung, that loss of NKX2-1 leads to adoption of a gastric transcriptional phenotype (Little et al., 2019; Snyder et al., 2013). Further, mesenchymal cues that induce lung and trachea development converge to establish ventral NKX2-1 expression, and Nkx2-1-/- mutant embryos exhibit dramatic epithelial and mesenchymal phenotypes. Together, these findings have led to the proposal that NKX2-1 is a master regulator of initial tracheal fate specification (Billmyre et al., 2015; Domyan et al., 2011; Goss et al., 2009; Harris-Johnson et al., 2009; Morrisey and Hogan, 2010; Que et al., 2007). By performing scRNA-seq profiling on the endoderm at the onset of tracheal and esophageal development, and comparing this profile to Nkx2-1-/- mutant embryos, we find that NKX2-1 loss does not cause a transcriptome-wide tracheal-to-esophageal conversion, but rather results in changes in expression of a key subset of dorsoventrally restricted genes that can explain apparent fate-conversion phenotypes in the mesenchyme (Figure 7).
The functional significance of the NKX2-1-independent tracheal program, and how it is established, remains to be explored. It is possible that mesenchymal signals such as WNT and BMP induce other tracheal transcriptional regulators in parallel. Interestingly, the ISL1 transcription factor has been recently identified to exhibit ventrally-restricted expression in the trachea and is required for normal NKX2-1 expression (Kim et al., 2019). Further, our data reveal that Isl1 is independent of NKX2-1 (Figure 2—source data 1), indicating that it resides hierarchically upstream of NKX2-1. It remains to be determined, however, the extent to which ISL1 regulates tracheal transcriptional identity. Our profiling of tracheoesophageal specification, combined with genomic analyses of additional mouse mutants, provide an exciting opportunity for further exploration of additional regulators of tracheoesophageal specification within the foregut epithelium.
Our scRNA-seq profiling reveals many new markers of dorsoventral foregut identity beyond Nkx2-1 and Sox2. This of particular importance for human iPSC/ESC-derived models where Nkx2-1 and Sox2 expression are often used to indicate respiratory or esophageal/gut fate decisions (Dye et al., 2015; Hawkins et al., 2017; Trisno et al., 2018; Zhang et al., 2018). Our data suggest that in addition to using Nkx2-1 as a marker of respiratory fate, differentiation protocols might be more thoroughly characterized using a panel of NKX2-1-dependent and -independent respiratory markers. Further, though we have not explored it in depth, we also provide here the first scRNA-seq dataset characterizing the lung at early stages of branching morphogenesis, which may additionally aid in more precise characterization of early lung development. Our study therefore provides a rich resource for expanding our understanding of early cell fate decisions in stem cell models of human foregut and lung development.
By defining the NKX2-1-dependent transcriptomic profile, we elucidate how NKX2-1 regulates initial tracheal and esophageal development at the genome-wide level. A dual repressive genetic relationship with SOX2 has been previously demonstrated, and our ChIP-seq data support direct repression of Sox2 by NKX2-1. We find, however, that direct binding of NKX2–1 occurs more often at genes that are normally expressed in the trachea, and loss of tracheal gene expression in Nkx2-1-/- mutants is not indirectly mediated by upregulation of SOX2. Together, these findings broadly support a model in which NKX2-1 more often positively regulates the tracheal gene expression program directly. While we demonstrate that SOX2 is a mediator of NKX2-1-indirect regulation of some genes, SOX2 targets in the foregut have not been identified at the transciptomic level, and it is therefore unclear the extent to which SOX2 controls TE fates. Additionally, our identification of other NKX2-1-dependent transcription factors such as KLF5 provides candidates potentially mediating NKX2-1 indirect repression of esophageal genes.
Tracheal cartilage and smooth muscle phenotypes in Nkx2-1-/- embryos support a TE fate conversion phenotype (Minoo et al., 1999; Que et al., 2007); here we provide a likely explanation of these phenotypes and reveal how NKX2-1 may regulate development of the tracheal cartilage and restrict smooth muscle formation. Normal tracheal cartilage specification requires WNT signaling from the tracheal epithelium to the mesenchyme (Hou et al., 2019; Kishimoto et al., 2019; Snowball et al., 2015). We find that NKX2-1 positively regulates Wnt7b resulting in activation of a canonical WNT-signaling response in the adjacent ventral tracheal mesenchyme. A recent report suggested that epithelial-mesenchymal WNT signaling during cartilage specification occurs through NKX2-1-independent mechanisms (Kishimoto et al., 2019). Our results differ from this finding but do support the possibility that an NKX2-1 independent mechanism also contributes to tracheal cartilage specification, as some disorganized cartilage still forms in Nkx2-1-/- mutants.
In addition to regulating WNT signaling, we found that NKX2-1 loss resulted in upregulation of Shh and increased SHH signal reception in the ventral mesenchyme. As HH signaling is a key regulator of smooth muscle formation in multiple contexts, and its disruption also results in perturbation of tracheal cartilage formation (Huycke et al., 2019; Mao et al., 2010; Miller et al., 2004; Sala et al., 2011), it is likely that this upregulation also contributes to disruption of tracheal cartilage and expansion of smooth muscle formation. Notably, similar to the other trachea and esophagus markers we examined, NKX2-1 regulation of Wnt7b does not depend on SOX2, whereas the upregulation of Shh in Nkx2-1-/- mutants does. This fits with the broader model of NKX2-1 directly activating a defined tracheal program, but more often repressing an esophageal program through ventral repression of SOX2.
While few genetic causes of foregut anomalies in humans have been identified, human stem cell models have indicated that key players in respiratory and gut specification are conserved between mice and humans (Ostrin et al., 2018; Trisno et al., 2018). Therefore, future work to understand genetic causes of foregut malformations in humans including tracheoesophageal fistula (TEF), tracheal agenesis, esophageal atresia, tracheomalacia, and tracheal stenosis will benefit greatly from the improved understanding of normal tracheal and esophageal specification presented in this study. Together, these findings dramatically advance our understanding of the earliest stages of tracheoesophageal development, while revising our perspective on the role of NKX2-1 in this process.
Materials and methods
Key resources table.
| Reagent type (species) or resource |
Designation | Source or reference | Identifiers | Additional information |
|---|---|---|---|---|
| Strain, strain background (mouse) | CD1 | Harlan/Envigo | Cat#: 030 | |
| Genetic reagent (mouse) | Nkx2-1fl/fl | Kusakabe et al., 2006 | MGI: 3653645 | |
| Genetic reagent (mouse) | Sox2fl/fl | Shaham et al., 2009 | MGI: 4366453 | |
| Genetic reagent (mouse) | Tmem163Tg(Actincre) | Lewandoski et al., 1997 | MGI: 2176050 | |
| Genetic reagent (mouse) | Nkx2.5cre | Stanley et al., 2004 | MGI: 2448972 | |
| Antibody | α-NKX2-1 (rabbit polyconal) | Millipore | Cat#: 07601 | 1:200 for IF, 5ug for ChIP |
| Antibody | α-SOX2 (goat polyclonal) | Neuromics | Cat#: GT15098 | 1:250 for IF |
| Antibody | α-SOX9 (Rabbit polyclonal) | Santa Cruz | Cat#: sc-20095 | 1:250 for IF |
| Antibody | α-PITX1 (Rabbit polyclonal) | NovusBio | Cat: NBP188644 | 1:200 for IF |
| Antibody | α-LRIG1 (Goat polyclonal) | R&D Systems | Cat#: AF3688 | 1:250 for IF |
| Antibody | α-SMA (Rabbit polyclonal) | Abcam | AB5694 | 1:300 for IF |
| Antibody | α-SMA-cy3 (mouse monoclonal) | Sigma | C6198 | 1:300 for IF |
| Antibody | α-EpCAM (rat polyclonal) | BioLegend | Cat#: 118219 | 1:200 for FACS |
| Sequence-based reagent | RNAscope probe mm-Irx2 | Advanced Cell Diagnostics | Cat#: 519901 | |
| Sequence-based reagent | RNAscope probe mm-Wnt7b | Advanced Cell Diagnostics | Cat#: 401131 | |
| Sequence-based reagent | RNAscope probe mm-Pcdh10 | Advanced Cell Diagnostics | Cat#: 477781-C3 | |
| Sequence-based reagent | RNAscope probe mm-Tppp3 | Advanced Cell Diagnostics | Cat#: 586631 | |
| Sequence-based reagent | RNAscope probe mm-Ly6h | Advanced Cell Diagnostics | Cat#: 587811 | |
| Sequence-based reagent | RNAscope probe mm-Krt19 | Advanced Cell Diagnostics | Cat#: 402941 | |
| Sequence-based reagent | RNAscope probe mm-Klf5 | Advanced Cell Diagnostics | Cat#: 444081 | |
| Sequence-based reagent | RNAscope probe mm-Foxe1 | Advanced Cell Diagnostics | Cat#: 509641 | |
| Sequence-based reagent | RNAscope probe mm-Crabp1 | Advanced Cell Diagnostics | Cat#: 474711-C3 | |
| Sequence-based reagent | RNAscope probe mm-Bmp4 | Advanced Cell Diagnostics | Cat#: 401301-C2 | |
| Sequence-based reagent | RNAscope probe mm-Nrp2 | Advanced Cell Diagnostics | Cat#: 500661 | |
| Sequence-based reagent | RNAscope probe mm-Dcn | Advanced Cell Diagnostics | Cat#: 413281-C3 | |
| Sequence-based reagent | RNAscope probe mm-Has2 | Advanced Cell Diagnostics | Cat#: 465171-C2 | |
| Sequence-based reagent | RNAscope probe mm-Meis2 | Advanced Cell Diagnostics | Cat#: 436371-C3 | |
| Sequence-based reagent | RNAscope probe mm-Ackr3 | Advanced Cell Diagnostics | Cat#: 482561-C2 | |
| Sequence-based reagent | RNAscope probe mm-Axin2 | Advanced Cell Diagnostics | Cat#: 400331-C3 | |
| Sequence-based reagent | RNAscope probe mm-Shh | Advanced Cell Diagnostics | Cat#: 314361 | |
| Sequence-based reagent | RNAscope probe mm-Ptch1 | Advanced Cell Diagnostics | Cat#: 402811-C2 | |
| Sequence-based reagent | Nkx2-1-geno1 | This paper | PCR primer | 5'-CTA-GGG-AGG-CTA -GGA-ACT-CGG-3' |
| Sequence-based reagent | Nkx2-1-geno2 | This paper | PCR primer | 5'-CCG-ACC-CAC-GTA-GAG-CC-3' |
| Sequence-based reagent | Nkx2-1-geno3 | This paper | PCR primer | 5'-CTC-TTA-TCT-GGG-ATC-GCC-TGA-G-3' |
| Sequence-based reagent | Sox2-flox-geno1 | Steevens et al., 2019 | PCR primer | 5'-TGG-AAT-CAG-GCT-GCC-GAG-AAT-CC-3' |
| Sequence-based reagent | Sox2-flox-geno2 | Steevens et al., 2019 | PCR primer | 5'-TCG-TTG-TGG-CAA-CAA-GTG-CTA-AAG-C-3' |
| Sequence-based reagent | Sox2-flox-geno3 | Steevens et al., 2019 | PCR primer | 5'-CTG-CCA-TAG-CCA-CTC-GAG-AAG-3' |
| Sequence-based reagent | Cre-geno1 | Liang et al., 2005; Vauclair et al., 2005 | PCR primer | 5'-GTT-CGC-AAG-AAC-CTG-ATG-GAC-A-3' |
| Sequence-based reagent | Cre-geno2 | Liang et al., 2005; Vauclair et al., 2005 | PCR primer | 5'-CTA-GAG-CCT-GTT-TTG-CAC-GTT-C-3' |
| Commercial assay or kit | MicroChIP Diapure columns | Diagenode | Cat#: C03040001 | DNA extraction (ChIP) |
| Commercial assay or kit | Microplex Library Preparation Kit v2 | Diagenode | Cat#: C05010012 | ChIP library prep |
| Commercial assay or kit | Rneasy Micro kit | Qiagen | Cat# 74004 | RNA extraction (bulk) |
| Commercial assay or kit | SMARTer Stranded Total RNAseq kit V2 | Takara | Cat#: 634411 | Bulk RNAseq library prep |
| Commercial assay or kit | RNA 6000 Pico Bioanalyzer kit | Agilent | Cat# 5067-1513 | Bioanalyzer (RNA) |
| Commercial assay or kit | High Sensitivity DNA Bioanalyzer kit | Agilent | Cat#: 5067-4626 | Bioanalyzer (DNA) |
| Commercial assay or kit | QuBit dsDNA HS Assay kit | Invitrogen | Cat#: Q32854 | DNA quantification |
| Commercial assay or kit | Chromium Single Cell ' Reagent Kit V2 | 10X Genomics | Cat#: PN-120237, PN-120236, PN-120262 | Single cell RNA-seq |
| Other | Sytox Blue nuclei acid stain | Thermo | Cat: S11348 | Live/dead stain for FACS, use at 1uM |
| Other | TSAplus Fluoresceine | Akoya Biosciences | NEL741001KT | RNAscope, 1:1500 |
| Other | TSAplus Cy3 | Akoya Biosciences | NEL744001KT | RNAscope, 1:1500 |
| Other | TSAplus Cy5 | Akoya Biosciences | NEL745001KT | RNAscope, 1:1500 |
| Other | DynaBeads, protein G | Invitrogen | Cat#: 10003D | ChIP |
| Other | AMPure XP beads | Beckman Coulter | Cat#: A63881 | Library cleanup |
| Other | TrypLE Express | Thermo | Cat# 12604013 | Tissue dissociation |
Mice
All animal procedures were performed at the University of California San Francisco (UCSF) under approval from the UCSF Institutional Animal Care and Use Committee (mouse protocol # AN164190). Mouse embryos were collected from pregnant females via cesarean section at the described timepoint following observation of a vaginal plug. Noon the day of the plug was considered embryonic day 0.5. For single cell sequencing experiments, timed-pregnant CD1 female mice were obtained from Harlan/Envigo (Cat: 030) and embryos were staged using somite counts. For mutant analysis, the following alleles were used: Nkx2-1lox/lox (MGI: 3653645), Sox2lox/lox (MGI: 4366453), Nkx2.5-Cre (MGI: 2448972), Actin-Cre (MGI: 2176050).
Immunofluorescence
Mouse embryos were dissected at E10.5 or E11.5 in cold PBS and fixed overnight in 4% paraformaldehyde at 4C. For cryopreservation, embryos were subjected to a sucrose gradient of 12.5% sucrose in PBS for 8 hr, followed by 25% sucrose in PBS overnight at 4°C, and embedded in OCT. Tissue sections of 12 um were cut using a cryostat and used for immunofluorescence, or in-situ hybridization followed by immunofluorescence with standard protocols. Primary antibodies used for immunofluorescence were: NKX2-1 (Millipore 07601, 1:200), SOX2 (Neuromics GT15098, 1:250), SOX9 (Santa Cruz, sc-20095, 1:250), LRIG1 (R&D, AF3688, 1:200), PITX1 (NovusBio, NBP188644, 1:250).
In-situ hybridization
For in-situ hybridization, 12 µm cryosections were stained using the RNAscope Multiplex Fluorescent Reagent Kit v2 (Advanced Cell Diagnostics, cat# 323100) with the following adjustments to the manufacturer’s protocol: antigen retrieval step was bypassed, protease step used ProteasePlus for 10 min. Following in-situ hybridization, slides were washed 2x in PBS and subjected to immunofluorescent staining as described in ‘Immunofluorescence’ above. Probes used for in-situ hybridization against mouse RNA were obtained from Advanced Cell Diagnostics as follows: Irx2 (519901), Wnt7b (401131), Pcdh10 (477781-C3), Tppp3 (586631), Ly6h (587811), Krt19 (402941), Klf5 (444081), Foxe1 (509641), Crabp1 (474711-C3), Bmp4 (401301-C2), Nrp2 (500661), Dcn (413281-C3), Has2 (465171-C2), Meis2 (436371-C3), Ackr3 (482561-C2), Axin2 (400331-C3), Shh (314361), Ptch1 (402811-C2).
Skeletal preparation
Skeletal preps were performed as previously described (Martin et al., 1995).
Dissociation and FACS of embryonic tissue
Foregut tissue was dissected in cold PBS and dissociated to single cells using TrypLE Express (phenol-red free, Thermo cat# 12604013) at 37°C for 5 min, followed by trituration for 1–3 min at 37°C. Cells were washed twice with FACS buffer (2 mM EDTA and 5% fetal bovine serum in phenol-red free HBSS). To identify epithelial cells, cells were stained with PerCP/Cy5.5 anti-mouse CD326/EpCAM (BioLegend, cat# 118219, used at 1:100) at 4°C for 30 min followed by two washes with FACS buffer. Cells were resuspended in FACS buffer with Sytox Blue nucleic acid stain (Thermo, S11348, used at 1 µM) to stain dead cells, and passed through a 35 µm cell strainer. Cells were sorted using a BD FACS Aria II. Single live epithelial cells were collected after size selection and gating for Sytox-negative, EpCAM-positive cells. For scRNA-seq, cells were sorted into EDTA-free FACS buffer and processed as described below. For bulk-RNA-seq, cells were sorted directly into RNA lysis buffer (Qiagen RNeasy Micro kit, cat# 74004) with 1% beta-mercaptoethanol and processed as described below.
Single-cell RNA sequencing
Foregut tissue was dissected from 20 embryos at E10.5 (6-9ts) and 28 embryos at E11.5 (16-20ts). To ensure for representation of tracheal and esophageal cells at E11.5, lung tissue was separated from E11.5 foreguts and processed in parallel. Tissue from each timepoint was pooled and single-cell suspension and epithelial purification was performed as described above. 25,000 live epithelial cells from each sample were loaded into individual wells for single-cell capture using the Chromium Single Cell 3’ Reagent Kit V2 (10X Genomics). Library preparation for each sample was also performed using the Chromium Single Cell 3’ Reagent Kit V2, and each sample was given a unique i7 index. Libraries were pooled and subjected to sequencing in a single lane of an Illumina NovaSeq6000. Sequencing data were processed, and downstream analysis performed as described below.
RNA sequencing
For bulk RNA-sequencing experiments, whole foregut tissue was dissected from E11.5 Nkx2-1-/- or WT embryos, and lungs were removed at the time of dissection. For RNA-sequencing of wild type (WT) trachea and esophagus, trachea and esophagus were manually separated at the time of dissection. Foreguts of individual embryos were dissociated, stained, and sorted as described above. Each biological replicate consisted of RNA pooled from two Nkx2-1-/- or WT embryos, with a total of 3 biological replicates from different litters. RNA was purified using the RNeasy Micro kit (Qiagen, cat# 74004) and quantification was performed using the RNA 6000 Pico kit (Agilent, cat# 5067–1513) on an Agilent 2100 Bioanalyzer. RNA-sequencing libraries were prepared from 4 ng of input RNA using the SMARTer Stranded Total RNAseq kit V2 (Takara, cat# 634411) with 13 amplification cycles. Library size and quality was checked using an Agilent 2100 Bioanalyzer with the High Sensitivity DNA kit (Agilent, cat# 5067–4626), and library concentration was determined with the QuBit dsDNA HS Assay kit (Invitrogen, cat# Q32854). Libraries were normalized to 7 nM, pooled, and sequenced across two lanes of an Illumina HiSeq 4000 to generate 50 base pair single-end reads. Data processing and downstream analysis was performed as described below.
Chromatin immunoprecipitation and sequencing
For ChIP-seq experiments, tracheas were dissected from WT E11.5 mouse embryos and cross-linked with 1% cold PFA for 9 min. Crosslinking was stopped with glycine for a final concentration of 0.125M. The crosslinked tissue was washed 2x in PBS and stored at −80°C. For each replicate 175 trachea were pooled and the tissue was thawed and dissociated in cold PBS by passing through a 25G needle until fully dissociated. The cells were lysed in 500 µl lysis buffer (50 mM Tris-HCl pH8, 2 mM EDTA pH8, 0.1% NP-40, 10% glycerol in DNase/RNase-free water) with protease inhibitors (Aprotinin, Pepstatin A, Leupeptin, 1 mM PMSF) for 5 min on ice. Nuclei were pelleted by spinning cells at 845xg for 5 min at 8°C, then lysed with 500 µl SDS lysis buffer (50 mM Tris-HCl + 10 mM EDTA + 1% SDS in sterile water) for 5 min on ice. The chromatin from lysed nuclei in SDS lysis buffer was sheared to obtain 200–500 bp DNA fragments using a Diagenode Bioruptor with 35 cycles (30 s on/off) submerged in cold water. Fragment sizes were determined by running a 20 µl aliquot of reverse-crosslinked chromatin on a 1.5% agarose gel. The sheared chromatin was diluted 1:10 with ChIP dilution buffer (50 mM Tris-HCl, 2 mM EDTA, 0.5M NaCl, 0.1% SDS in sterile water) then pre-cleared with washed Dynabeads Protein G for 1 hr at 4°C. The Dynabeads were magnetically isolated from chromatin and 1% of chromatin was separated and reverse crosslinked to be used as input. The remaining sample was incubated with Nkx2-1 antibody (Millipore 07601) overnight at 4°C. To isolate antibody-bound DNA, washed Dynabeads Protein G were added to each sample (50 ul beads/sample) and incubated for 30 min at 4°C.The Dynabeads with antibody-bound chromatin were isolated magnetically and subjected to 3x washes each with wash buffer (10 mM Tris-HCl, 2 mM EDTA, 0.5M NaCl, 0.1% SDS, 1% NP-40 in sterile water), LiCl buffer (10 mM Tris-HCl, 2 mM EDTA, 0.5M LiCl, 0.1% SDS, 1% NP-40), and TE buffer (1 mM Tris-HCl, 1 mM EDTA) for 5 min on ice. The chromatin was eluted in 100 µl of 2% SDS in TE on a 65°C heatblock with vigorous shaking (1400 rpm) for 15 min. Input DNA and immunoprecipitated DNA were reverse crosslinked by adding 5 µl 5M NaCl to 100 µl eluate and incubating overnight at 65°C, followed by a 30 min treatment with RNase. The reverse crosslinked DNA was purified using MicroChIP Diapure columns (Diagenode, cat# C03040001) and eluted in 10 µl of elution buffer. The entire eluate of Nkx2-1 immunoprecipitated DNA and 0.5 ng of input DNA were used to prepare ChIP libraries. The libraries were prepared using the Microplex Library Preparation Kit v2 (Diagenode, cat# C05010012) according to manufacturer's instructions with 14 amplification cycles. Library quality and size were calculated using an Agilent 2100 Bioanalyzer with the High Sensitivity DNA kit (Agilent, cat# 5067–4626), and library concentration was quantified with the QuBit dsDNA HS Assay kit (Invitrogen, cat# Q32854). The libraries were pooled to 5 nM and sequenced in one lane of an Illumina HiSeq 4000. The sequencing data were processed and downstream analysis was performed as described below.
Analysis of scRNA-seq data
We used the Cell Ranger v2.1.1 pipeline from 10X Genomics for initial processing of raw sequencing reads. Briefly, raw sequencing reads were demultiplexed, aligned to the mouse genome (mm10), filtered for quality using default parameters, and UMI counts were calculated for each gene per cell. Filtered gene-barcode matrices were then analyzed using the Seurat v3.0 R package (Stuart et al., 2018). Seurat objects were generated with CreateSuratObject (min.cells = 10, min.features = 200) for E10.5 foregut and lung cells, E11.5 foregut cells, and E11.5 lung cells. E11.5 foregut and lung cells were merged to create a single gene-barcode matrix. Cells were further filtered based on the distribution of number of genes (nFeature) and percent mitochondrial genes (percent.mito) per cell across the dataset as follows. nFeature_RNA (E10.5):>2000,<7000, nFeature_RNA (E11.5):>2500,<8500, percent.mito:>0.5,<7.5. Data were normalized for sequencing depth, log-transformed, and multiplied by a scale factor of 10000 using the default parameters of NormalizeData. Linear regression was performed to eliminate variability across cell cycle stage (CellCycleScoring) and mitochondrial content using ScaleData. For E11.5 merged foregut and lung, nCount_RNA was also regressed out as these datasets retained slight variability in sequence depth that was not eliminated with ScaleData. The top 2000 variable genes within each dataset were selected based on a variance stabilizing transformation (FindVariableGenes, selection.method = ‘vst’) and used in downstream principal component analysis (PCA). The principal components (PCs) were identified with RunPCA and PCs to include in downstream analysis were empirically determined with visualization of PCs in an ElbowPlot. Cell clusters were identified by construction of a shared nearest neighbor graph (FindNeighbors) and a modularity optimization-based clustering algorithm (FindClusters) using the PCs determined by PCA (E10.5 dims = 1:20, E11.5 dims = 1:12). Clustering was performed at multiple resolutions between 0.2 and 2, and optimal resolution was determined empirically based on the expression of known population markers and the FindMarkers function (E10.5 resolution = 0.55, E11.5 resolution = 0.45). Several outlying clusters of mesenchymal contamination were removed, and cells were re-clustered for visualization purposes. Cells and clustering were visualized using Uniform Manifold Approximation and Projection (UMAP) dimensional reduction (RunUMAP). Markers for each cluster were identified with FindAllMarkers using default parameters, and cluster identity was determined based on the presence of known markers, as well as experimental evidence of RNA localization in specific cell types.
Analysis of bulk RNA-seq data
Analysis of RNA-seq reads was performed as described previously (Percharde et al., 2018). Differential expression analysis (Nkx2-1-/- vs WT, WT trachea vs WT esophagus) was performed using DESeq2 (Love et al., 2014) (test = c(‘Wald’), betaPrior = T) and genes with a log2 fold change > 0.7 or<−0.7 and an adjusted p-value<0.05 were determined to be differentially expressed. Differential expression results were visualized using the ggplot2 package.
Analysis of ChIP-seq data
FASTQ files of raw sequencing reads for NKX2-1 ChIP and input libraries were processed using a custom script (github.com/akelakuwahara/foregut/run ChIPseq). Quality and length trimming and generation of fastqc files to examine sequence quality were performed using Trim Galore (Krueger, 2014). Trimmed reads were aligned to the mouse genome (mm9) using bowtie2 and sorted deduplicated bam files were generated using samtools. Peak calling was performed with MACS2 (Zhang et al., 2008) using a false discovery rate less than 1e-5 (macs2 callpeak -t chip.sorted.bam -c input.sorted.bam -f BAM -q 0.00001 g mm -n nkx_peaks --outdir macs/). Peaks shared between both replicates were identified by finding the intersection of both replicates using the Intersect tool in Galaxy (usegalaxy.org). Motif analysis to test for the enrichment of the NKX2-1 motif was performed with MEME ChIP using a 500 bp region flanking the peak summit for all peaks shared between both replicates. NKX2-1 binding at specific loci was visualized in the Integrative Genomics Viewer. Peak-gene associations were generated with GREAT using the basal-plus-extension rule (McLean et al., 2010).
Code availability
All code used for data analysis is available at https://github.com/akelakuwahara/foregut (Kuwahara, 2020; copy archived at https://github.com/elifesciences-publications/foregut).
Acknowledgements
We thank Marta Losa for technical advice and guidance on ChIP-seq protocols. We thank Licia Selleri, Ophir Klein, Nadav Ahituv and our laboratory colleagues for constructive feedback on the project and comments on the manuscript. FACS was carried out at the UCSF Parnassus Flow Cytometry Core. Sequencing of bulk RNA and ChIP libraries was carried out by the UCSF Center for Advanced Technology. Single-cell capture and RNA sequencing was carried out by the UCSF Institute for Human Genetics. Computational analysis was performed on the XSEDE computing resource under NSF GRFP grant #1650113.
Funding Statement
The funders had no role in study design, data collection and interpretation, or the decision to submit the work for publication.
Contributor Information
Jeffrey O Bush, Email: jeffrey.bush@ucsf.edu.
Valerie Horsley, Yale University, United States.
Edward E Morrisey, University of Pennsylvania, United States.
Funding Information
This paper was supported by the following grants:
National Heart, Lung, and Blood Institute R01HL144785 to Jeffrey Ohmann Bush.
National Science Foundation GRFP1650113 to Akela Kuwahara.
California Institute for Regenerative Medicine EDUC2-08391 to Coohleen Coombes.
Additional information
Competing interests
No competing interests declared.
Author contributions
Conceptualization, Data curation, Formal analysis, Funding acquisition, Validation, Investigation, Writing - original draft, Writing - review and editing.
Formal analysis, Validation, Investigation.
Formal analysis, Investigation.
Investigation, Visualization.
Software, Formal analysis, Methodology.
Conceptualization, Data curation, Formal analysis, Supervision, Funding acquisition, Investigation, Writing - original draft, Project administration, Writing - review and editing.
Ethics
Animal experimentation: All animal procedures were performed at the University of California San Francisco (UCSF) under approval from the UCSF Institutional Animal Care and Use Committee (protocol # AN164190).
Additional files
Data availability
Source data for Figure 1, 2, 3, S1-4 are included as supplemental data files to the manuscript. All sequencing data has been uploaded to the Dryad (https://doi.org/10.7272/Q6WW7FVB).
The following dataset was generated:
Kuwahara A, Lewis A, Coombes C, Leung F-S, Percharde M, Bush JO. 2020. Delineating the early transcriptional specification of the mammalian trachea and esophagus; Expression matrices for scRNA-seq data. Dryad Digital Repository.
References
- Becht E, McInnes L, Healy J, Dutertre C-A, Kwok IWH, Ng LG, Ginhoux F, Newell EW. Dimensionality reduction for visualizing single-cell data using UMAP. Nature Biotechnology. 2019;37:38–44. doi: 10.1038/nbt.4314. [DOI] [PubMed] [Google Scholar]
- Billmyre KK, Hutson M, Klingensmith J. One shall become two: separation of the esophagus and Trachea from the common foregut tube. Developmental Dynamics. 2015;244:277–288. doi: 10.1002/dvdy.24219. [DOI] [PMC free article] [PubMed] [Google Scholar]
- Cardoso WV, Lü J. Regulation of early lung morphogenesis: questions, facts and controversies. Development. 2006;133:1611–1624. doi: 10.1242/dev.02310. [DOI] [PubMed] [Google Scholar]
- Domyan ET, Ferretti E, Throckmorton K, Mishina Y, Nicolis SK, Sun X. Signaling through BMP receptors promotes respiratory identity in the foregut via repression of Sox2. Development. 2011;138:971–981. doi: 10.1242/dev.053694. [DOI] [PMC free article] [PubMed] [Google Scholar]
- Dye BR, Hill DR, Ferguson MAH, Tsai Y-H, Nagy MS, Dyal R, Wells JM, Mayhew CN, Nattiv R, Klein OD, White ES, Deutsch GH, Spence JR. In vitro generation of human pluripotent stem cell derived lung organoids. eLife. 2015;4:e05098. doi: 10.7554/eLife.05098. [DOI] [PMC free article] [PubMed] [Google Scholar]
- Gerhardt B, Leesman L, Burra K, Snowball J, Rosenzweig R, Guzman N, Ambalavanan M, Sinner D. Notum attenuates Wnt/β–catenin signaling to promote tracheal cartilage patterning. Developmental Biology. 2018;436:14–27. doi: 10.1016/j.ydbio.2018.02.002. [DOI] [PMC free article] [PubMed] [Google Scholar]
- Goss AM, Tian Y, Tsukiyama T, Cohen ED, Zhou D, Lu MM, Yamaguchi TP, Morrisey EE. Wnt2/2b and beta-catenin signaling are necessary and sufficient to specify lung progenitors in the foregut. Developmental Cell. 2009;17:290–298. doi: 10.1016/j.devcel.2009.06.005. [DOI] [PMC free article] [PubMed] [Google Scholar]
- Guazzi S, Price M, De Felice M, Damante G, Mattei MG, Di Lauro R. Thyroid nuclear factor 1 (TTF-1) contains a homeodomain and displays a novel DNA binding specificity. The EMBO Journal. 1990;9:3631–3639. doi: 10.1002/j.1460-2075.1990.tb07574.x. [DOI] [PMC free article] [PubMed] [Google Scholar]
- Harris-Johnson KS, Domyan ET, Vezina CM, Sun X. beta-Catenin promotes respiratory progenitor identity in mouse foregut. PNAS. 2009;106:16287–16292. doi: 10.1073/pnas.0902274106. [DOI] [PMC free article] [PubMed] [Google Scholar]
- Hawkins F, Kramer P, Jacob A, Driver I, Thomas DC, McCauley KB, Skvir N, Crane AM, Kurmann AA, Hollenberg AN, Nguyen S, Wong BG, Khalil AS, Huang SX, Guttentag S, Rock JR, Shannon JM, Davis BR, Kotton DN. Prospective isolation of NKX2-1-expressing human lung progenitors derived from pluripotent stem cells. Journal of Clinical Investigation. 2017;127:2277–2294. doi: 10.1172/JCI89950. [DOI] [PMC free article] [PubMed] [Google Scholar]
- Herriges JC, Yi L, Hines EA, Harvey JF, Xu G, Gray PA, Ma Q, Sun X. Genome-scale study of transcription factor expression in the branching mouse lung. Developmental Dynamics. 2012;241:1432–1453. doi: 10.1002/dvdy.23823. [DOI] [PMC free article] [PubMed] [Google Scholar]
- Hou Z, Wu Q, Sun X, Chen H, Li Y, Zhang Y, Mori M, Yang Y, Que J, Jiang M. Wnt/Fgf crosstalk is required for the specification of basal cells in the mouse Trachea. Development. 2019;146:dev171496. doi: 10.1242/dev.171496. [DOI] [PMC free article] [PubMed] [Google Scholar]
- Huycke TR, Miller BM, Gill HK, Nerurkar NL, Sprinzak D, Mahadevan L, Tabin CJ. Genetic and mechanical regulation of intestinal smooth muscle development. Cell. 2019;179:90–105. doi: 10.1016/j.cell.2019.08.041. [DOI] [PMC free article] [PubMed] [Google Scholar]
- Kim HY, Pang MF, Varner VD, Kojima L, Miller E, Radisky DC, Nelson CM. Localized smooth muscle differentiation is essential for epithelial bifurcation during branching morphogenesis of the mammalian lung. Developmental Cell. 2015;34:719–726. doi: 10.1016/j.devcel.2015.08.012. [DOI] [PMC free article] [PubMed] [Google Scholar]
- Kim E, Jiang M, Huang H, Zhang Y, Robert J, Gilmore N, Gan L, Que J. Isl1 Regulation of Nkx2-1 in the Early Foregut Epithelium Is Required for Trachea-Esophageal Separation and Lung Lobation SSRN Scholarly Paper No ID 3387653. Social Science Research Network; 2019. [DOI] [PMC free article] [PubMed] [Google Scholar]
- Kishimoto K, Furukawa KT, LuzMadrigal A, Yamaoka A, Matsuoka C, Habu M, Alev C, Zorn AM, Morimoto M. Induction of tracheal mesoderm and chondrocyte from pluripotent stem cells in mouse and human. bioRxiv. 2019 doi: 10.1101/758235. [DOI]
- Krueger F. Trim Galore. Trim Galore. 2014 http://www.bioinformatics.babraham.ac.uk/projects/trim_galore/
- Kusakabe T, Kawaguchi A, Hoshi N, Kawaguchi R, Hoshi S, Kimura S. Thyroid-specific enhancer-binding protein/NKX2.1 is required for the maintenance of ordered architecture and function of the differentiated thyroid. Molecular Endocrinology. 2006;20:1796–1809. doi: 10.1210/me.2005-0327. [DOI] [PMC free article] [PubMed] [Google Scholar]
- Kuwahara A. foregut. 4819667GitHub. 2020 https://github.com/akelakuwahara/foregut
- Lewandoski M, Meyers EN, Martin GR. Analysis of Fgf8 gene function in vertebrate development. Cold Spring Harbor Symposia on Quantitative Biology; 1997. pp. 159–168. [DOI] [PubMed] [Google Scholar]
- Liang X, Zhou Q, Li X, Sun Y, Lu M, Dalton N, Ross J, Chen J. PINCH1 plays an essential role in early murine embryonic development but is dispensable in ventricular cardiomyocytes. Molecular and Cellular Biology. 2005;25:3056–3062. doi: 10.1128/MCB.25.8.3056-3062.2005. [DOI] [PMC free article] [PubMed] [Google Scholar]
- Litingtung Y, Lei L, Westphal H, Chiang C. Sonic hedgehog is essential to foregut development. Nature Genetics. 1998;20:58–61. doi: 10.1038/1717. [DOI] [PubMed] [Google Scholar]
- Little DR, Gerner-Mauro KN, Flodby P, Crandall ED, Borok Z, Akiyama H, Kimura S, Ostrin EJ, Chen J. Transcriptional control of lung alveolar type 1 cell development and maintenance by NK homeobox 2-1. PNAS. 2019;116:20545–20555. doi: 10.1073/pnas.1906663116. [DOI] [PMC free article] [PubMed] [Google Scholar]
- Love MI, Huber W, Anders S. Moderated estimation of fold change and dispersion for RNA-seq data with DESeq2. Genome Biology. 2014;15:550. doi: 10.1186/s13059-014-0550-8. [DOI] [PMC free article] [PubMed] [Google Scholar]
- Mao J, Kim BM, Rajurkar M, Shivdasani RA, McMahon AP. Hedgehog signaling controls mesenchymal growth in the developing mammalian digestive tract. Development. 2010;137:1721–1729. doi: 10.1242/dev.044586. [DOI] [PMC free article] [PubMed] [Google Scholar]
- Martin JF, Bradley A, Olson EN. The paired-like homeo box gene MHox is required for early events of skeletogenesis in multiple lineages. Genes & Development. 1995;9:1237–1249. doi: 10.1101/gad.9.10.1237. [DOI] [PubMed] [Google Scholar]
- McLean CY, Bristor D, Hiller M, Clarke SL, Schaar BT, Lowe CB, Wenger AM, Bejerano G. GREAT improves functional interpretation of cis-regulatory regions. Nature Biotechnology. 2010;28:495–501. doi: 10.1038/nbt.1630. [DOI] [PMC free article] [PubMed] [Google Scholar]
- Miller LA, Wert SE, Clark JC, Xu Y, Perl AK, Whitsett JA. Role of sonic hedgehog in patterning of tracheal-bronchial cartilage and the peripheral lung. Developmental Dynamics. 2004;231:57–71. doi: 10.1002/dvdy.20105. [DOI] [PubMed] [Google Scholar]
- Minoo P, Su G, Drum H, Bringas P, Kimura S. Defects in Tracheoesophageal and Lung Morphogenesis inNkx2.1(−/−) Mouse Embryos. Developmental Biology. 1999;209:60–71. doi: 10.1006/dbio.1999.9234. [DOI] [PubMed] [Google Scholar]
- Mizuno K, Gonzalez FJ, Kimura S. Thyroid-specific enhancer-binding protein (T/EBP): cDNA cloning, functional characterization, and structural identity with thyroid transcription factor TTF-1. Molecular and Cellular Biology. 1991;11:4927–4933. doi: 10.1128/MCB.11.10.4927. [DOI] [PMC free article] [PubMed] [Google Scholar]
- Morrisey EE, Cardoso WV, Lane RH, Rabinovitch M, Abman SH, Ai X, Albertine KH, Bland RD, Chapman HA, Checkley W, Epstein JA, Kintner CR, Kumar M, Minoo P, Mariani TJ, McDonald DM, Mukouyama YS, Prince LS, Reese J, Rossant J, Shi W, Sun X, Werb Z, Whitsett JA, Gail D, Blaisdell CJ, Lin QS. Molecular determinants of lung development. Annals of the American Thoracic Society. 2013;10:S12–S16. doi: 10.1513/AnnalsATS.201207-036OT. [DOI] [PMC free article] [PubMed] [Google Scholar]
- Morrisey EE, Hogan BL. Preparing for the first breath: genetic and cellular mechanisms in lung development. Developmental Cell. 2010;18:8–23. doi: 10.1016/j.devcel.2009.12.010. [DOI] [PMC free article] [PubMed] [Google Scholar]
- Nakazato M, Endo T, Saito T, Harii N, Onaya T. Transcription of the thyroid transcription factor-1 (TTF-1) gene from a newly defined start site: positive regulation by TTF-1 in the thyroid. Biochemical and Biophysical Research Communications. 1997;238:748–752. doi: 10.1006/bbrc.1997.7383. [DOI] [PubMed] [Google Scholar]
- Nilsson M, Fagman H. Development of the thyroid gland. Development. 2017;144:2123–2140. doi: 10.1242/dev.145615. [DOI] [PubMed] [Google Scholar]
- Oguchi H, Kimura S. Multiple transcripts encoded by the thyroid-specific enhancer-binding protein (T/EBP)/thyroid-specific transcription factor-1 (TTF-1) gene: evidence of autoregulation. Endocrinology. 1998;139:1999–2006. doi: 10.1210/endo.139.4.5933. [DOI] [PubMed] [Google Scholar]
- Ostrin EJ, Little DR, Gerner-Mauro KN, Sumner EA, Ríos-Corzo R, Ambrosio E, Holt SE, Forcioli-Conti N, Akiyama H, Hanash SM, Kimura S, Huang SXL, Chen J. β-Catenin maintains lung epithelial progenitors after lung specification. Development. 2018;145:dev160788. doi: 10.1242/dev.160788. [DOI] [PMC free article] [PubMed] [Google Scholar]
- Pepicelli CV, Lewis PM, McMahon AP. Sonic hedgehog regulates branching morphogenesis in the mammalian lung. Current Biology. 1998;8:1083–1086. doi: 10.1016/S0960-9822(98)70446-4. [DOI] [PubMed] [Google Scholar]
- Percharde M, Lin CJ, Yin Y, Guan J, Peixoto GA, Bulut-Karslioglu A, Biechele S, Huang B, Shen X, Ramalho-Santos M. A LINE1-Nucleolin partnership regulates early development and ESC identity. Cell. 2018;174:391–405. doi: 10.1016/j.cell.2018.05.043. [DOI] [PMC free article] [PubMed] [Google Scholar]
- Perl AK, Kist R, Shan Z, Scherer G, Whitsett JA. Normal lung development and function after Sox9 inactivation in the respiratory epithelium. Genesis. 2005;41:23–32. doi: 10.1002/gene.20093. [DOI] [PubMed] [Google Scholar]
- Que J, Okubo T, Goldenring JR, Nam KT, Kurotani R, Morrisey EE, Taranova O, Pevny LH, Hogan BL. Multiple dose-dependent roles for Sox2 in the patterning and differentiation of anterior foregut endoderm. Development. 2007;134:2521–2531. doi: 10.1242/dev.003855. [DOI] [PMC free article] [PubMed] [Google Scholar]
- Rajagopal J, Carroll TJ, Guseh JS, Bores SA, Blank LJ, Anderson WJ, Yu J, Zhou Q, McMahon AP, Melton DA. Wnt7b stimulates embryonic lung growth by coordinately increasing the replication of epithelium and mesenchyme. Development. 2008;135:1625–1634. doi: 10.1242/dev.015495. [DOI] [PMC free article] [PubMed] [Google Scholar]
- Rankin SA, Han L, McCracken KW, Kenny AP, Anglin CT, Grigg EA, Crawford CM, Wells JM, Shannon JM, Zorn AM. A retinoic Acid-Hedgehog cascade coordinates Mesoderm-Inducing signals and endoderm competence during lung specification. Cell Reports. 2016;16:66–78. doi: 10.1016/j.celrep.2016.05.060. [DOI] [PMC free article] [PubMed] [Google Scholar]
- Rankin SA, McCracken KW, Luedeke DM, Han L, Wells JM, Shannon JM, Zorn AM. Timing is everything: reiterative wnt, BMP and RA signaling regulate developmental competence during endoderm organogenesis. Developmental Biology. 2018;434:121–132. doi: 10.1016/j.ydbio.2017.11.018. [DOI] [PMC free article] [PubMed] [Google Scholar]
- Rockich BE, Hrycaj SM, Shih HP, Nagy MS, Ferguson MA, Kopp JL, Sander M, Wellik DM, Spence JR. Sox9 plays multiple roles in the lung epithelium during branching morphogenesis. PNAS. 2013;110:E4456–E4464. doi: 10.1073/pnas.1311847110. [DOI] [PMC free article] [PubMed] [Google Scholar]
- Sala FG, Del Moral PM, Tiozzo C, Alam DA, Warburton D, Grikscheit T, Veltmaat JM, Bellusci S. FGF10 controls the patterning of the tracheal cartilage rings via shh. Development. 2011;138:273–282. doi: 10.1242/dev.051680. [DOI] [PMC free article] [PubMed] [Google Scholar]
- Shaham O, Smith AN, Robinson ML, Taketo MM, Lang RA, Ashery-Padan R. Pax6 is essential for Lens fiber cell differentiation. Development. 2009;136:2567–2578. doi: 10.1242/dev.032888. [DOI] [PMC free article] [PubMed] [Google Scholar]
- Shannon JM, Nielsen LD, Gebb SA, Randell SH. Mesenchyme specifies epithelial differentiation in reciprocal recombinants of embryonic lung and Trachea. Developmental Dynamics. 1998;212:482–494. doi: 10.1002/(SICI)1097-0177(199808)212:4<482::AID-AJA2>3.0.CO;2-D. [DOI] [PubMed] [Google Scholar]
- Sher ZA, Liu KJ. Congenital tracheal defects: embryonic development and animal models. Genetics. 2016;73:60. doi: 10.3934/genet.2016.1.60. [DOI] [Google Scholar]
- Small EM, Vokes SA, Garriock RJ, Li D, Krieg PA. Developmental expression of the Xenopus Nkx2-1 and Nkx2-4 genes. Mechanisms of Development. 2000;96:259–262. doi: 10.1016/S0925-4773(00)00400-7. [DOI] [PubMed] [Google Scholar]
- Snowball J, Ambalavanan M, Whitsett J, Sinner D. Endodermal wnt signaling is required for tracheal cartilage formation. Developmental Biology. 2015;405:56–70. doi: 10.1016/j.ydbio.2015.06.009. [DOI] [PMC free article] [PubMed] [Google Scholar]
- Snyder EL, Watanabe H, Magendantz M, Hoersch S, Chen TA, Wang DG, Crowley D, Whittaker CA, Meyerson M, Kimura S, Jacks T. Nkx2-1 represses a latent gastric differentiation program in lung adenocarcinoma. Molecular Cell. 2013;50:185–199. doi: 10.1016/j.molcel.2013.02.018. [DOI] [PMC free article] [PubMed] [Google Scholar]
- Stanley EG, Biben C, Elefanty A, Barnett L, Koentgen F, Robb L, Harvey RP. Efficient Cre-mediated deletion in cardiac progenitor cells conferred by a 3'UTR-ires-Cre allele of the homeobox gene Nkx2-5. The International Journal of Developmental Biology. 2004;46:431–439. [PubMed] [Google Scholar]
- Steevens AR, Glatzer JC, Kellogg CC, Low WC, Santi PA, Kiernan AE. SOX2 is required for inner ear growth and cochlear nonsensory formation before sensory development. Development. 2019;146:dev170522. doi: 10.1242/dev.170522. [DOI] [PMC free article] [PubMed] [Google Scholar]
- Stevens ML, Chaturvedi P, Rankin SA, Macdonald M, Jagannathan S, Yukawa M, Barski A, Zorn AM. Genomic integration of wnt/β-catenin and BMP/Smad1 signaling coordinates foregut and hindgut transcriptional programs. Development. 2017;144:1283–1295. doi: 10.1242/dev.145789. [DOI] [PMC free article] [PubMed] [Google Scholar]
- Stuart T, Butler A, Hoffman P, Hafemeister C, Papalexi E, Mauck WM, Stoeckius M, Smibert P, Satija R. Comprehensive integration of single cell data. bioRxiv. 2018 doi: 10.1016/j.cell.2019.05.031. [DOI] [PMC free article] [PubMed]
- Tagne JB, Gupta S, Gower AC, Shen SS, Varma S, Lakshminarayanan M, Cao Y, Spira A, Volkert TL, Ramirez MI. Genome-wide analyses of Nkx2-1 binding to transcriptional target genes uncover novel regulatory patterns conserved in lung development and tumors. PLOS ONE. 2012;7:e29907. doi: 10.1371/journal.pone.0029907. [DOI] [PMC free article] [PubMed] [Google Scholar]
- Teramoto M, Sugawara R, Minegishi K, Uchikawa M, Takemoto T, Kuroiwa A, Ishii Y, Kondoh H. The absence of SOX2 in the anterior foregut alters the esophagus into Trachea and bronchi in both epithelial and mesenchymal components. bioRxiv. 2019 doi: 10.1242/bio.048728. [DOI] [PMC free article] [PubMed]
- Trisno SL, Philo KED, McCracken KW, Catá EM, Ruiz-Torres S, Rankin SA, Han L, Nasr T, Chaturvedi P, Rothenberg ME, Mandegar MA, Wells SI, Zorn AM, Wells JM. Esophageal organoids from human pluripotent stem cells delineate Sox2 functions during esophageal specification. Cell Stem Cell. 2018;23:501–515. doi: 10.1016/j.stem.2018.08.008. [DOI] [PMC free article] [PubMed] [Google Scholar]
- Vauclair S, Nicolas M, Barrandon Y, Radtke F. Notch1 is essential for postnatal hair follicle development and homeostasis. Developmental Biology. 2005;284:184–193. doi: 10.1016/j.ydbio.2005.05.018. [DOI] [PubMed] [Google Scholar]
- Weaver M, Yingling JM, Dunn NR, Bellusci S, Hogan BL. Bmp signaling regulates proximal-distal differentiation of endoderm in mouse lung development. Development. 1999;126:4005. doi: 10.1242/dev.126.18.4005. [DOI] [PubMed] [Google Scholar]
- Weidenfeld J, Shu W, Zhang L, Millar SE, Morrisey EE. The WNT7b promoter is regulated by TTF-1, GATA6, and Foxa2 in lung epithelium. Journal of Biological Chemistry. 2002;277:21061–21070. doi: 10.1074/jbc.M111702200. [DOI] [PubMed] [Google Scholar]
- Yuan B, Li C, Kimura S, Engelhardt RT, Smith BR, Minoo P. Inhibition of distal lung morphogenesis in Nkx2.1(-/-) embryos. Developmental Dynamics. 2000;217:180–190. doi: 10.1002/(SICI)1097-0177(200002)217:2<180::AID-DVDY5>3.0.CO;2-3. [DOI] [PubMed] [Google Scholar]
- Zhang Y, Liu T, Meyer CA, Eeckhoute J, Johnson DS, Bernstein BE, Nusbaum C, Myers RM, Brown M, Li W, Liu XS. Model-based analysis of ChIP-Seq (MACS) Genome Biology. 2008;9:R137. doi: 10.1186/gb-2008-9-9-r137. [DOI] [PMC free article] [PubMed] [Google Scholar]
- Zhang Y, Yang Y, Jiang M, Huang SX, Mori M, Chen Y-W, Balasubramanian R, Kim E, Lin S, Toste de Carvalho ALR, Serra C, Riccio PN, Bialecka M, de Sousa Lopes SMC, Cardoso W, Zhang X, Snoeck H-W, Que J. Efficient derivation of basal progenitor cells from human pluripotent stem cells for modeling esophageal development. SSRN Electronic Journal. 2018;23:519–523. doi: 10.2139/ssrn.3155797. [DOI] [Google Scholar]


