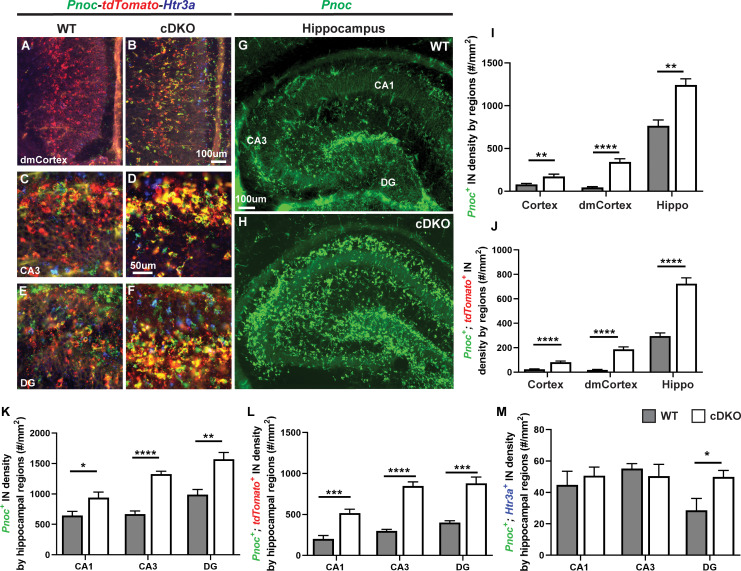
Figure 5. Maf cDKOs have preferential production of HINs over CINs that are Pnoc+.
(A–F) Multicolor FISH of tdTomato, Pnoc and Htr3a on P2 WT and cDKO neocortex (A–B) and hippocampus (C–F). (G–H) Pnoc expression in the WT and cDKO hippocampus. (I) Quantification of the Pnoc+ INs in the neocortex, dorsal-medial cortex (dmCortex) and hippocampus. (J) Quantification of the Pnoc+; tdTomato+ INs in the neocortex, dmCortex and hippocampus. (K) Quantification of the Pnoc+ HINs by regions. (L) Quantification of the Pnoc+; tdTomato+ HINs by regions. (M) Quantification of the Pnoc+; Htr3a+ HINs by regions. N = 3–4 per group and multiple sections were quantified per animal. Scale bar in (B) and (G) = 100 um and in (D) = 50 um. *p<0.05, **p<0.01, ***p<0.001, ****p<0.0001. Welch’s t test.


