

Abstract
Brain functions rely on specific patterns of connectivity. Teneurins are evolutionarily conserved transmembrane proteins that instruct synaptic partner matching in Drosophila and are required for vertebrate visual system development. The roles of vertebrate Teneurins in connectivity beyond the visual system remain largely unknown and their mechanisms of action have not been demonstrated. Here we show that mouse Teneurin-3 is expressed in multiple topographically interconnected areas of the hippocampal region, including proximal CA1, distal subiculum, and medial entorhinal cortex. Viral-genetic analyses reveal that Teneurin-3 is required in both CA1 and subicular neurons for the precise targeting of proximal CA1 axons to distal subiculum. Furthermore, Teneurin-3 promotes homophilic adhesion in vitro in a splicing isoform-dependent manner. These findings demonstrate striking genetic heterogeneity across multiple hippocampal areas and suggest that Teneurin-3 may orchestrate the assembly of a complex distributed circuit in the mammalian brain via matching expression and homophilic attraction.
The hippocampal region is critical for the acquisition of declarative memory and the neural representation of space1–4. The connections between hippocampal subregions and adjacent cortex are topographically organized along both the dorsal-ventral and proximal-distal axes5. Along the proximal-distal axis, proximal CA1, distal subiculum, and medial entorhinal cortex (MEC) neurons are specifically interconnected, as are distal CA1, proximal subiculum, and lateral entorhinal cortex (LEC) neurons6,7. These two parallel circuits may be preferentially used for processing spatial and object-related information, respectively8. Genetic heterogeneity that could contribute to the observed anatomical and functional differentiation along the proximal-distal axis in CA1 has been reported9. However, the mechanisms that control the exquisite wiring specificity remain unknown.
Since the proposal of the chemoaffinity hypothesis for establishing specific neuronal connections10, many cell surface and secreted proteins have been discovered that guide developing axons to target regions and recognize specific synaptic partners11,12. Members of the Teneurin family of type II transmembrane proteins exhibit matching expression in pre- and postsynaptic partners and instruct synaptic partner choice in the Drosophila olfactory and neuromuscular systems, likely through homophilic attraction13,14. Teneurins are evolutionarily conserved, with 4 members in mammals15 that are dynamically expressed during brain development16. Human Teneurins are risk loci in bipolar disorder17–20 and schizophrenia21, and are implicated in other neurological disorders22,23. Teneurin-3 (Ten3) is required for proper dendrite morphogenesis and axon targeting in the vertebrate visual system24–27. Although Ten3 has been hypothesized to function as a homophilic attractant, no cellular or molecular mechanisms have been demonstrated. Furthermore, conflicting evidence exists as to whether vertebrate Teneurins interact in trans in a homophilic manner28–30, and heterophilic trans interactions with the adhesion-type G-protein-coupled receptors Latrophilins have been demonstrated30–32. Here, we examine the role of Ten3 in the development of specific connections within the hippocampal region, and shed new light on its mechanism of action during mammalian neural development.
Ten3 expression in hippocampal regions
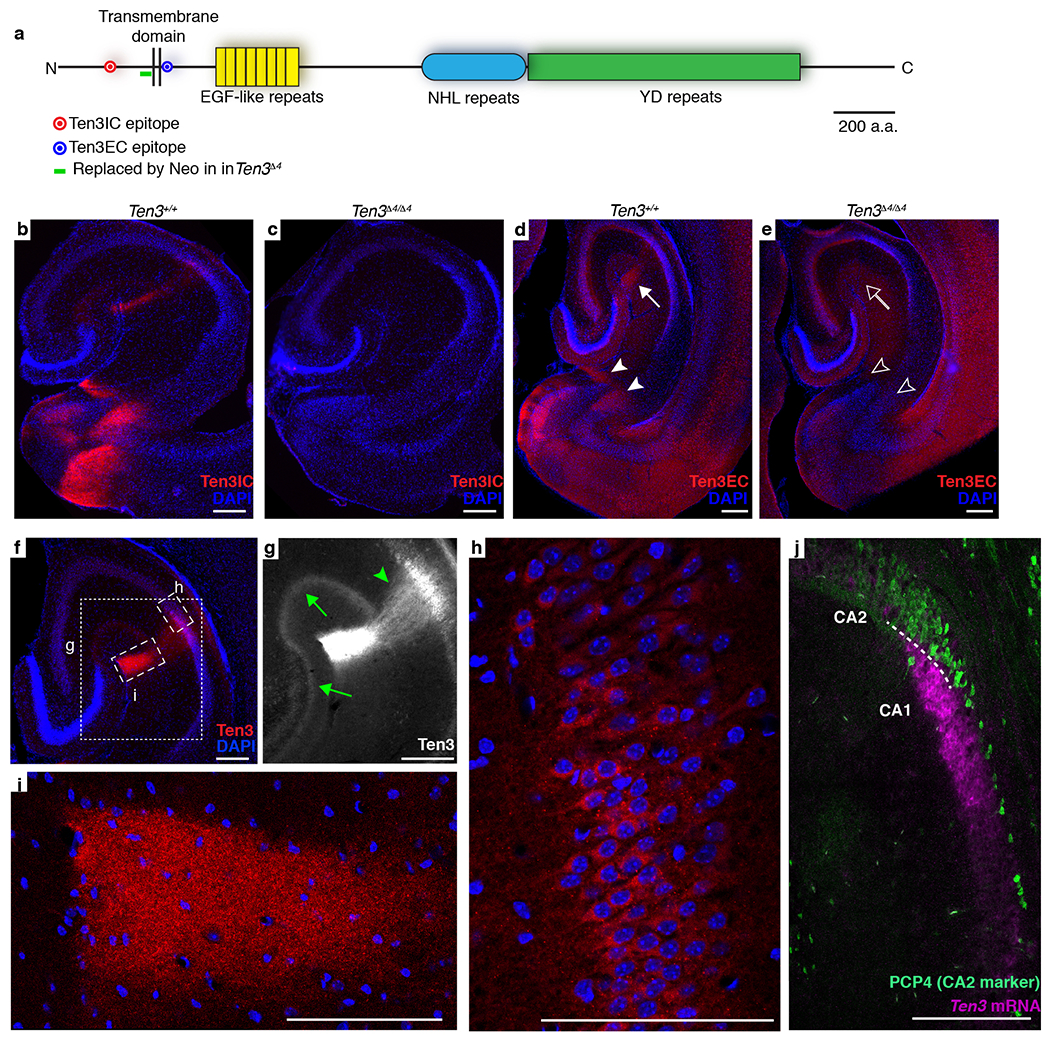
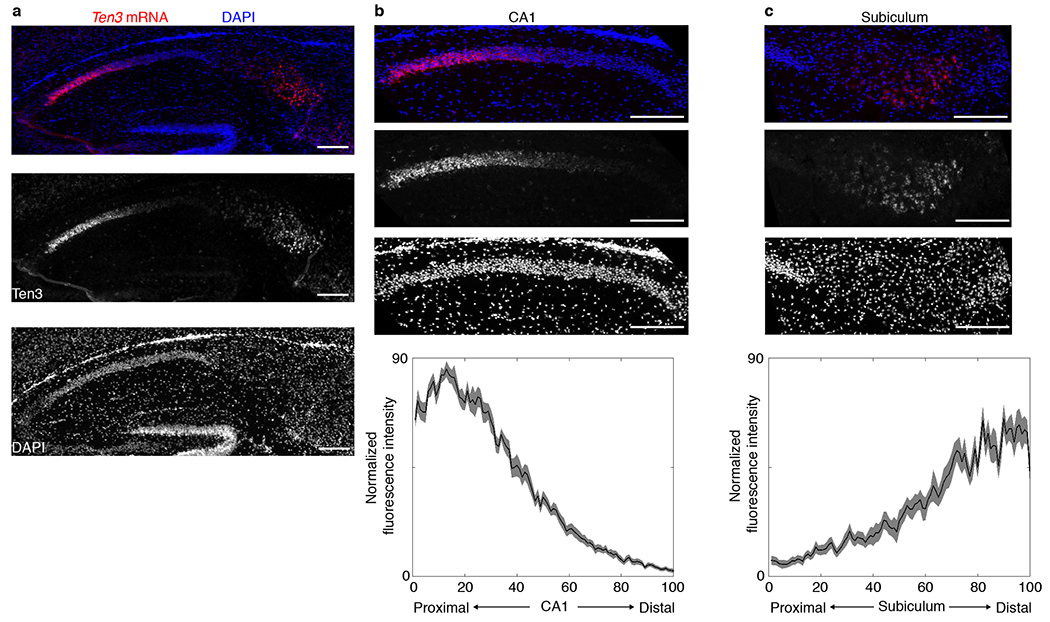
Using a custom antibody against a cytoplasmic epitope (Extended Data Fig. 1a), we found that Ten3 was expressed in highly specific regions of the postnatal brain. In particular, Ten3 was expressed in restricted domains of the developing hippocampal region (Fig. 1a), including proximal CA1, distal subiculum, and MEC. A second Ten3 antibody against an extracellular epitope recapitulated this staining pattern (Extended Data Fig. 1a, d). Staining with both antibodies was abolished in Ten3 knockout animals (Ten3Δ4/Δ4)24 (Extended Data Fig. 1b–e). Ten3 was most prominent in synaptic layers, including stratum lacunosum-moleculare of CA1 and the molecular layer of subiculum, consistent with Ten3 being present in synaptic cleft33. Ten3 was also present in axons, dendrites, and cell bodies (Extended Data Fig. 1f–i). In situ hybridization revealed that Ten3 mRNA was expressed in all regions where Ten3 protein was observed (Fig. 1b, Extended Data Fig. 1j). In both CA1 and subiculum, Ten3 mRNA showed a graded distribution along the proximal-distal axis, peaking in proximal CA1 and distal subiculum (Fig. 1c, Extended Data Fig. 2).
Figure 1 |. Ten3 expression in the developing hippocampal region.
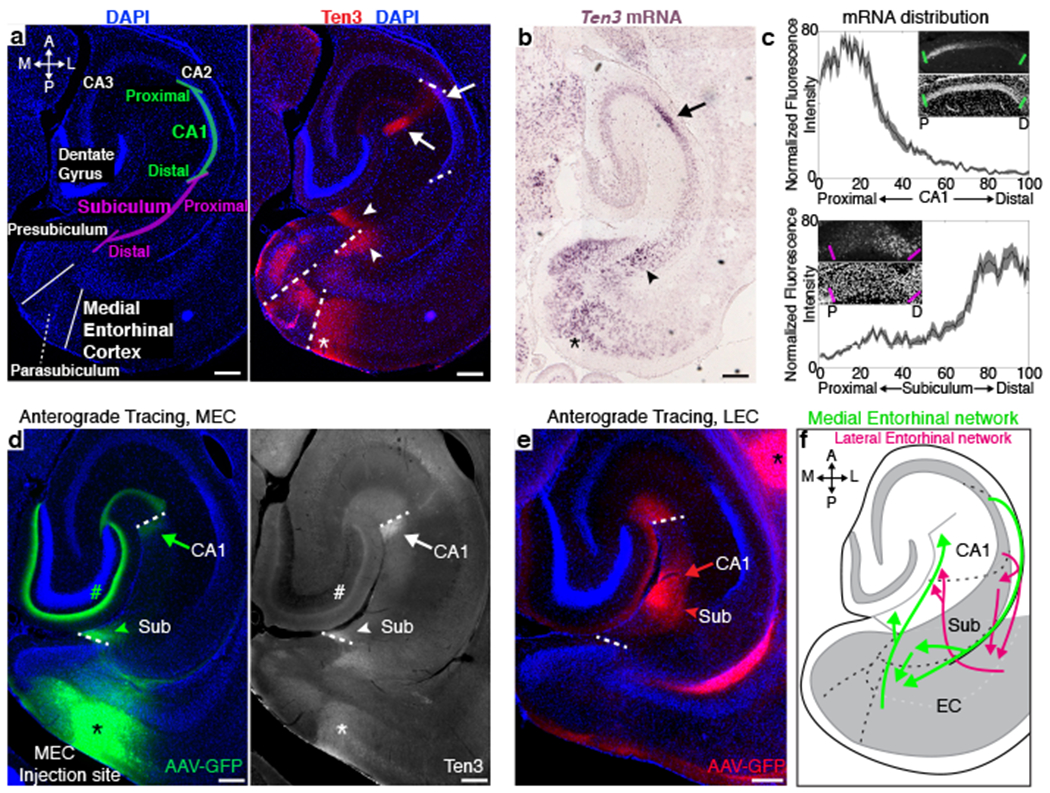
a, Left, diagram of the hippocampal region on a horizontal section of P10 mouse brain. A, anterior; P, posterior; M, medial; L, lateral. Right, same section with Ten3 immunostaining. b, In situ hybridization for Ten3 mRNA on a P9 horizontal section. In (a) and (b),_arrows denote proximal CA1; arrowheads, distal subiculum; asterisk, MEC. c, Quantification of Ten3 mRNA along the proximal-distal (P-D) axis of CA1 (n=12 sections, 4 animals) and subiculum (n=14 sections, 4 animals) of P10 horizontal sections. Insets: Ten3 mRNA (top) and DAPI staining (bottom). x-axis represents bin along the proximal-distal axis of CA1 or subiculum. Shaded curves, mean ± s.e.m. d, Labeling of MEC axons projecting to hippocampus in P70 brain after AAV1-CMV-GFP injection in MEC (asterisk) (left) and Ten3 staining on the same section (right). GFP in layer III MEC axons overlaps with Ten3 in proximal CA1 (arrows) and distal subiculum (arrowheads); GFP in layer II MEC axons also overlaps with Ten3 in dentate gyrus (#). e, Labeling of LEC axons in P55 brain projecting to distal CA1 (arrow) and proximal subiculum (arrowhead). Asterisk identifies track to the more ventral injection site. f, Summary of topographic connections between MEC, proximal CA1, and distal subiculum (green arrows), and between LEC, distal CA1, and proximal subiculum (red arrows). Scale bars, 200 μm.
Remarkably, Ten3 protein and mRNA expression patterns corresponded to the known topography of multiple connections in the hippocampal region. MEC neurons send axons to proximal CA1 and distal subiculum34–36, proximal CA1 neurons project to distal subiculum37,38 and MEC6,7, and distal subicular neurons project to MEC6,39. All of these regions highly expressed Ten3 protein and mRNA (Fig. 1a–c). In contrast, LEC neurons are interconnected with distal CA1 and proximal subiculum6,7,34–40, all of which expressed low or no Ten3. To further examine the relationship between Ten3 expression and topographic projections, we injected an anterograde viral tracer into MEC, and found that MEC axons and Ten3 protein clearly overlapped in the molecular layers of proximal CA1 and distal subiculum (Fig. 1d). In contrast, LEC axons projected to distal CA1 and proximal subiculum, regions of low Ten3 expression (Fig. 1e).
In summary, Ten3 expression matches with topographic connectivity between entorhinal cortex, CA1, and subiculum (Fig. 1f). Ten3 protein and mRNA were also specifically expressed in subregions of the presubiculum, parasubiculum, medial mammillary nucleus, and anteroventral thalamic nucleus that are topographically connected with subiculum or entorhinal cortex (Extended Data Fig. 3). Given the function of Drosophila Teneurins in synaptic partner matching13,14, we hypothesized that Ten3 may act as a homophilic attractant to control the development of these precise wiring patterns.
Ten3 knockout analysis
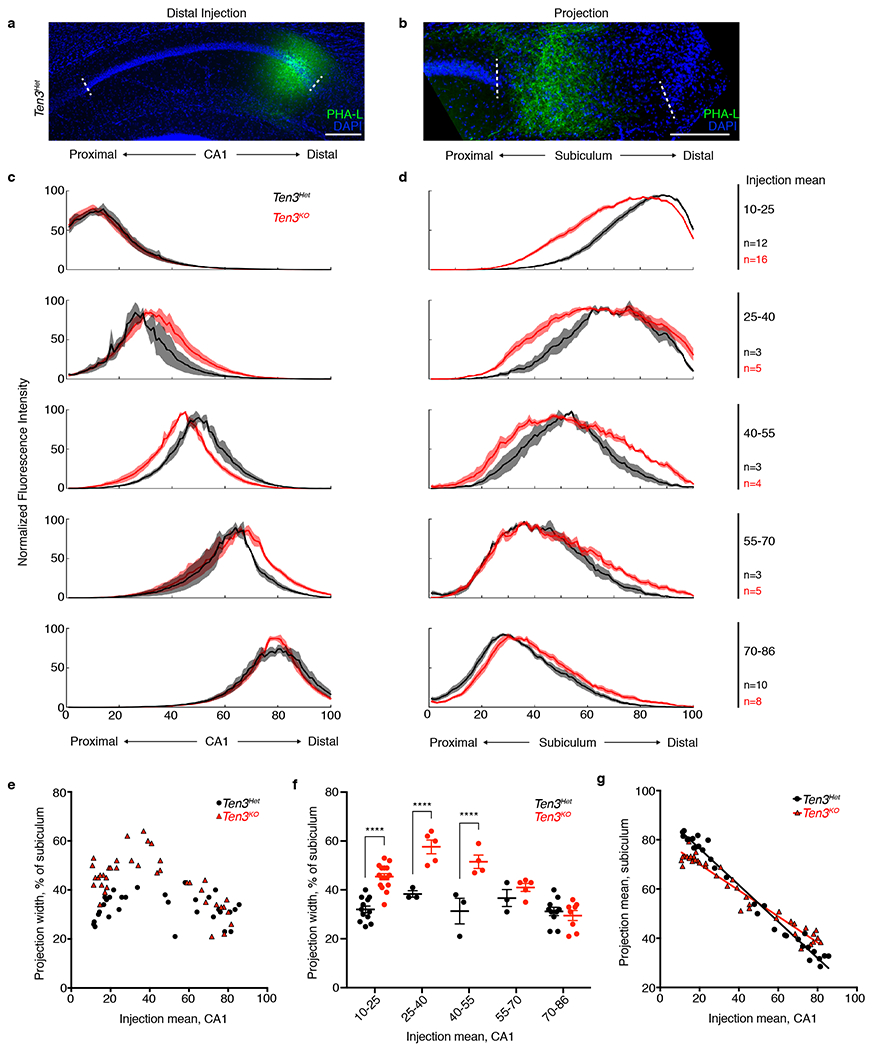
To test the function of Ten3 in hippocampal circuit development, we focused on the projection from CA1 to subiculum, where proximal CA1 neurons (Ten3-high) send axons to distal subiculum (Ten3-high), and distal CA1 neurons (Ten3-low) project to proximal subiculum (Ten3-low) (Fig. 2a–c). We generated a Ten3 knock-in Cre allele (Ten3Cre, Extended Data Fig. 4a), which functioned as a protein null and allowed us to visualize neurons that normally express Ten3 in a mutant background (Extended Data Fig. 4b–d). We injected the anterograde tracer PHA-L41 into proximal CA1 of the dorsal hippocampus of Ten3 heterozygous (Ten3Cre/+, hereafter Ten3Het) and knockout (Ten3Cre/Δ4, hereafter Ten3KO) mice, and analyzed the distribution of labeled CA1 axons in subiculum (Fig. 2c–g). In Ten3Het mice, proximal CA1-restricted injections labeled axons that arborized densely in distal subiculum, confirming the topography described in the rat37,38 (Fig. 2c). In Ten3KO mice, however, similarly placed injections in proximal CA1 labeled axons that spread significantly more proximally in subiculum (Fig. 2d, e), with increased overall width (Fig. 2f) and a proximal shift in the mean position (Fig. 2g) of the projection. Middle and distal CA1 injections revealed that the overall topography of the CA1→subiculum projection was less sharp in Ten3KO mice (Extended Data Fig. 5). Thus, Ten3 is required for the precise projections of proximal CA1 axons to distal subiculum.
Figure 2 |. Ten3 is required for the precise CA1→subiculum projection.
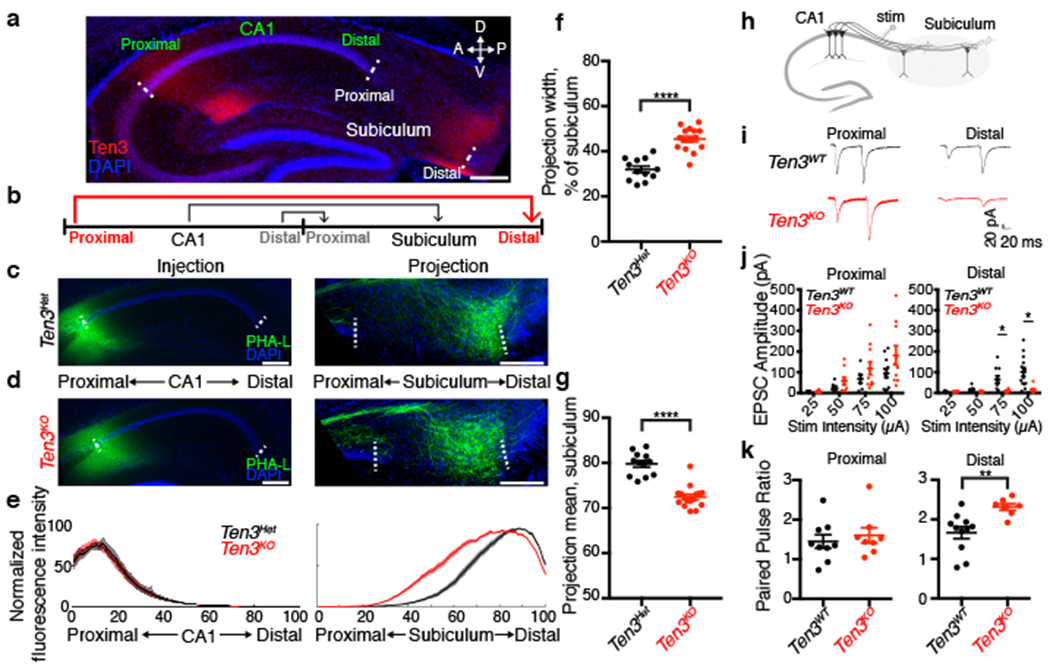
a, Sagittal section of P11 hippocampus, showing Ten3 expression in proximal CA1 and distal subiculum. A, anterior; P, posterior; D, dorsal; V, ventral. b, Diagram of the CA1→subiculum topographic projection, with Ten3-high regions and axons in red. c, d, PHA-L (green) injections in proximal CA1 and corresponding projections in subiculum of Ten3Het (c) or Ten3KO (d) mice. e, Averaged normalized fluorescence intensity traces for proximal injections in CA1 (left) and corresponding projections in subiculum (right) for Ten3Het (black, n=12 animals) and Ten3KO (red, n=16 animals). x-axis represents bin along the proximal-distal axis of CA1 or subiculum. Shaded curves represent mean ± s.e.m. at each bin. f, g, Projection width-at-half-max (f) and mean position (g) for Ten3Het and Ten3KO. **** p < 0.0001 (Ten3Het: n=12; Ten3KO: n=16; two-tailed t-test). h, Diagram of stimulating electrode (stim) and recording sites. i, EPSC traces from proximal and distal subicular cells in Ten3WT and Ten3KO. j, Average EPSC amplitude in proximal (left) and distal (right) subicular cells from Ten3WT and Ten3KO at increasing stimulation intensities (Proximal: Ten3WT, n = 12 cells; Ten3KO, n = 11 cells; p > 0.05 for all stimulation intensities. Distal: Ten3WT, n = 14 cells, 6 animals; Ten3KO, n = 9 cells, 7 animals; 75 μA stim, p = 0.035; 100 μA stim, p = 0.022, adjusted p-values from two-tailed t-tests with Holm-Sidak correction). k, Paired pulse ratio for proximal (left) and distal (right) subicular cells from Ten3WT and Ten3KO mice. (Proximal: Ten3WT, n = 9 cells, 6 animals; Ten3KO, n = 8 cells, 7 animals; p = 0.5566. Distal, Ten3WT: n = 11 cells, 6 animals; Ten3KO: n = 7 cells, 7 animals; p = 0.0049, two-tailed t-test). Scale bars, 200 μm. Error bars represent mean ± s.e.m.
We next recorded excitatory postsynaptic currents (EPSCs) from proximal and distal subicular cells in hippocampal slices from Ten3+/+ (Ten3WT) and Ten3KO animals in response to electrical stimulation of the CA1→subiculum axon bundles (Fig. 2h). In Ten3WT slices, stimulation reliably evoked EPSCs in proximal and distal subicular neurons (Fig. 2i). In Ten3KO animals, evoked EPSC amplitudes in distal but not proximal subicular neurons were strongly reduced, consistent with the anatomical defect in Ten3KO mice (Fig. 2i, j). The paired pulse ratio was unaffected in proximal subicular neurons but was increased in distal subicular knockout cells, indicating a lower baseline release probability in Ten3 mutants (Fig. 2k). Given that in knockout animals, some proximal CA1 axons still reached distal subiculum (Fig. 2d, e), the profound physiological changes suggest that Ten3 may also be required for formation or function of the synapses between proximal CA1 and distal subicular neurons, consistent with the persistent expression in Ten3 in adults (Fig. 1d) and the function of Drosophila Teneurins in synapse formation14,42.
CA1 conditional knockout analysis
To distinguish whether Ten3 is required in CA1, subiculum, or both, for the CA1→subiculum projection, we generated a conditional Ten3 allele (Ten3fl) that allowed us to delete Ten3 in cells expressing Cre recombinase (Extended Data Fig. 6). Because the CA1→subiculum projection develops postnatally (Extended Data Fig. 7), we injected Cre-expressing lentivirus into either CA1 or subiculum at postnatal day 0 (P0) to generate area-specific Ten3 knockouts.
For CA1 conditional knockout, we injected a Cre-dependent anterograde tracer into proximal CA1 of adults to visualize axons only from Cre-expressing neurons (Fig. 3a). In Ten3+/+ controls, proximal CA1 neurons sent axons to distal subiculum as expected (Fig. 3b, d). In Ten3fl/fl animals, however, proximal CA1 axons covered most of subiculum, with their intensity peaking near the center (Fig. 3c, d). The width of the projection was significantly increased in Ten3fl/fl, and the mean position shifted proximally (Fig. 3d–f). Thus, Ten3 is required in CA1 neurons for their precise axon targeting in subiculum.
Figure 3 |. Ten3 conditional knockout in CA1.
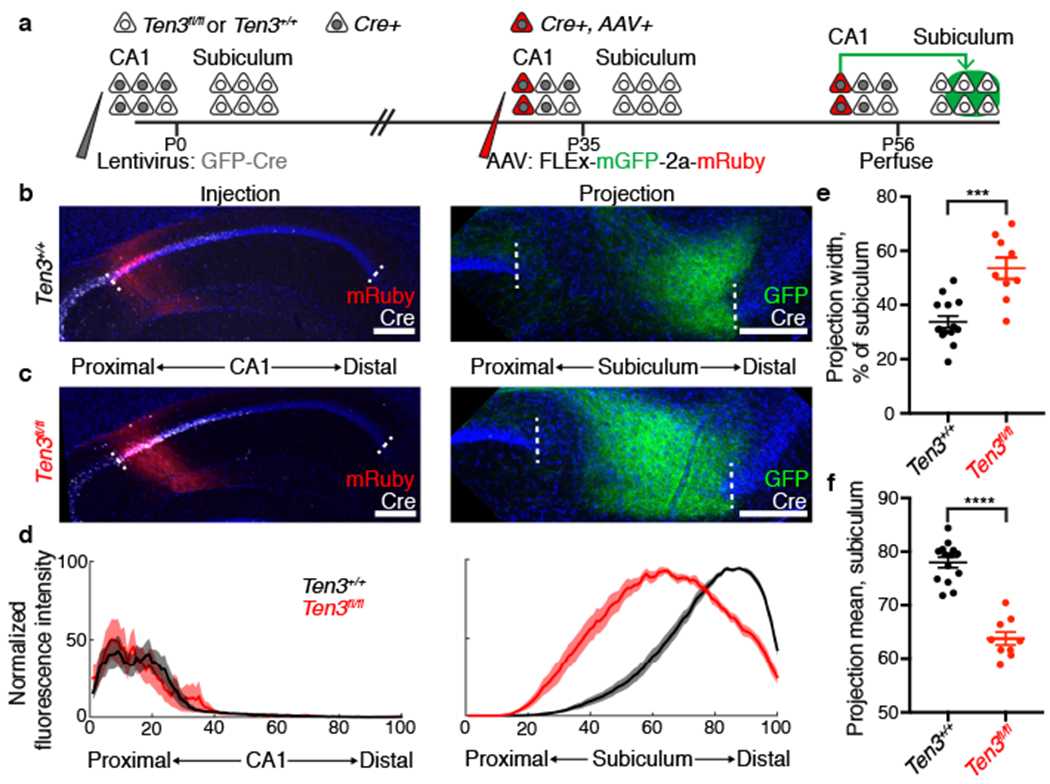
a, Experimental scheme. b, c, AAV injections in proximal CA1 (left) and corresponding projections in subiculum (right) of Ten3+/+ (b) and Ten3fl/fl (c) animals. Red, injections; green, projections; white, Cre staining. d, Average normalized fluorescence intensity traces for proximal CA1 injections (left) and corresponding subicular projections (right) for control (black, n = 14) and CA1 conditional knockout (red, n = 9) animals. e, f, Projection width-at-half-max (e) and mean position (f) for control and knockout animals. ***p = 0.0001, **** p < 0.0001, two-tailed t-tests. Scale bars, 200 μm. Error bars, mean ± s.e.m.
Subiculum conditional knockout analysis
To test if Ten3 is also required in subicular cells for CA1 axon targeting, we injected Cre-expressing lentivirus into subiculum at P0, the anterograde tracer PHA-L into proximal CA1 at P35, and analyzed the position of CA1 axons in subiculum (Fig. 4a). Because Cre expression covered a small region of subiculum relative to the target field of labeled CA1 axons, we asked whether CA1 axons targeted differently within Cre-expressing regions versus nearby Cre-negative regions. In Ten3+/+ controls, CA1 axons were unaffected when projecting into Cre-expressing subicular areas, as analyzed in serial histological sections (Fig. 4b, c, Extended Data Fig. 8a, c). In Ten3fl/fl animals, however, labeled CA1 axons appeared to avoid the patch of Cre-expressing, Ten3-deleted subicular cells (Fig. 4e, f, Extended Data Fig. 8b, d).
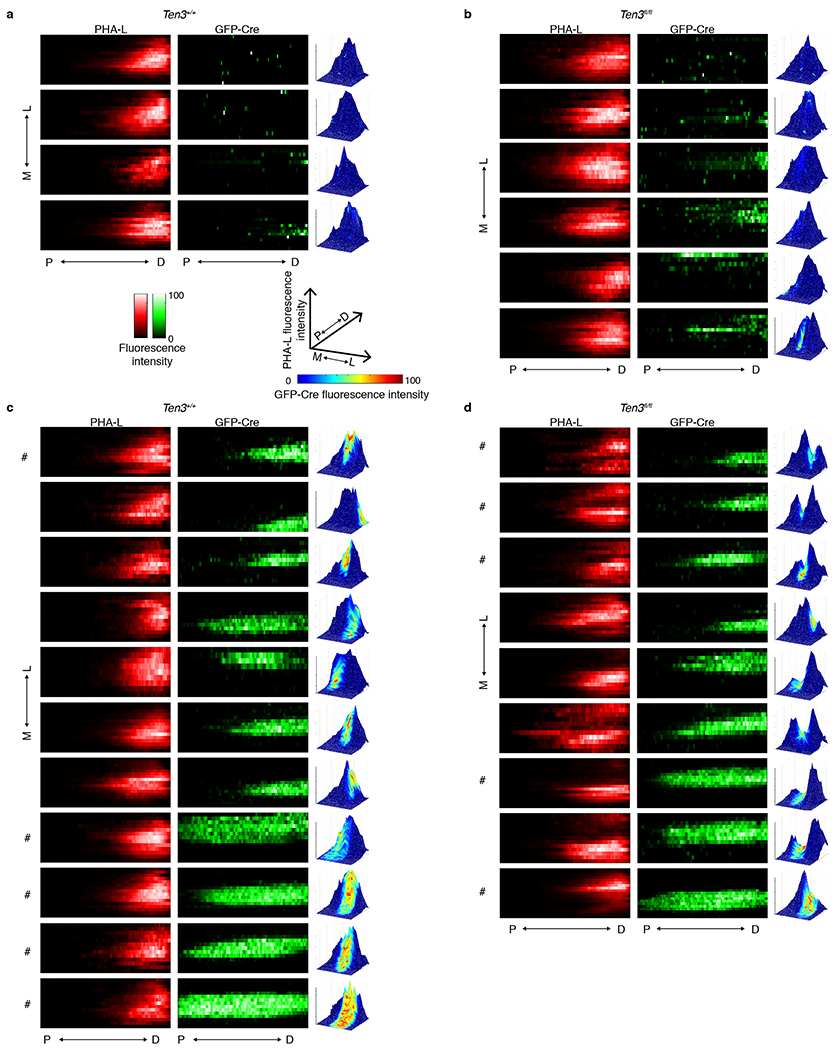
Figure 4 |. Ten3 conditional knockout in subiculum.
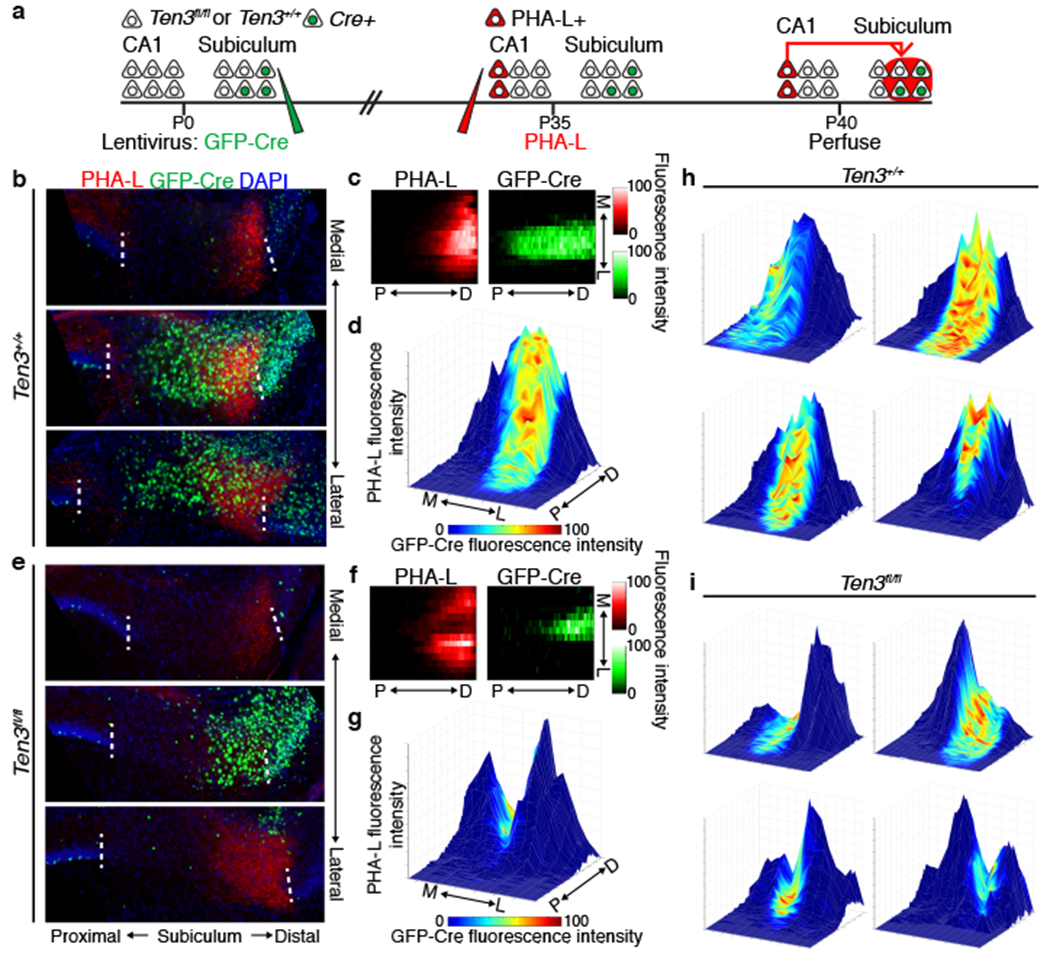
a, Experimental scheme. b, e, Example images from Ten3+/+ (b) and Ten3fl/fl (e) animals, showing axons from proximal CA1 PHA-L injection in red, and GFP-Cre in subiculum in green. Three 60-μm sections are arranged from medial to lateral, 480-600 μm between sections. c, f, Heatmaps showing normalized PHA-L fluorescence intensity (red, left) and normalized GFP-Cre intensity (green, right) in subiculum, same animals as (b) and (e). Each row is one section, 120 μm between rows. P, proximal; D, distal; M, medial; L, lateral. d, g, Surface plots showing normalized PHA-L intensity as height, and normalized GFP-Cre intensity as color according to the color map below, same data as (b, c) and (e, f). h, i, Surface plots from additional Ten3+/+ (h) and Ten3fl/fl (i) animals. See Extended Data Fig. 8 for all animals analyzed.
To visualize the relationship between the CA1→subiculum axon projections and GFP-Cre expression in the target, we plotted the intensities of CA1 axons and GFP-Cre on the same graph as height and color, respectively. While Cre expression (‘hot’ colored) did not affect the projection strength (height) in Ten3+/+ controls (Fig. 4d, h, Extended Data Fig. 8c), the projection strength was severely diminished in Cre-expressing patches in Ten3fl/fl animals (Fig. 4g, i, Extended Data Fig. 8d). Because we only made a focal deletion of Ten3 in subiculum with the lentivirus injection, there were many Ten3-expressing cells in nearby regions of distal subiculum. The simplest interpretation for this drastic phenotype is that Ten3-high proximal CA1 axons destined for the Ten3-deleted patch mistargeted to nearby Ten3-high distal regions, consistent with Ten3 in distal subiculum acting as an attractant for proximal CA1 axons (Fig. 5f).
Figure 5 |. Ten3 promotes homophilic adhesion in a splicing isoform-dependent manner.
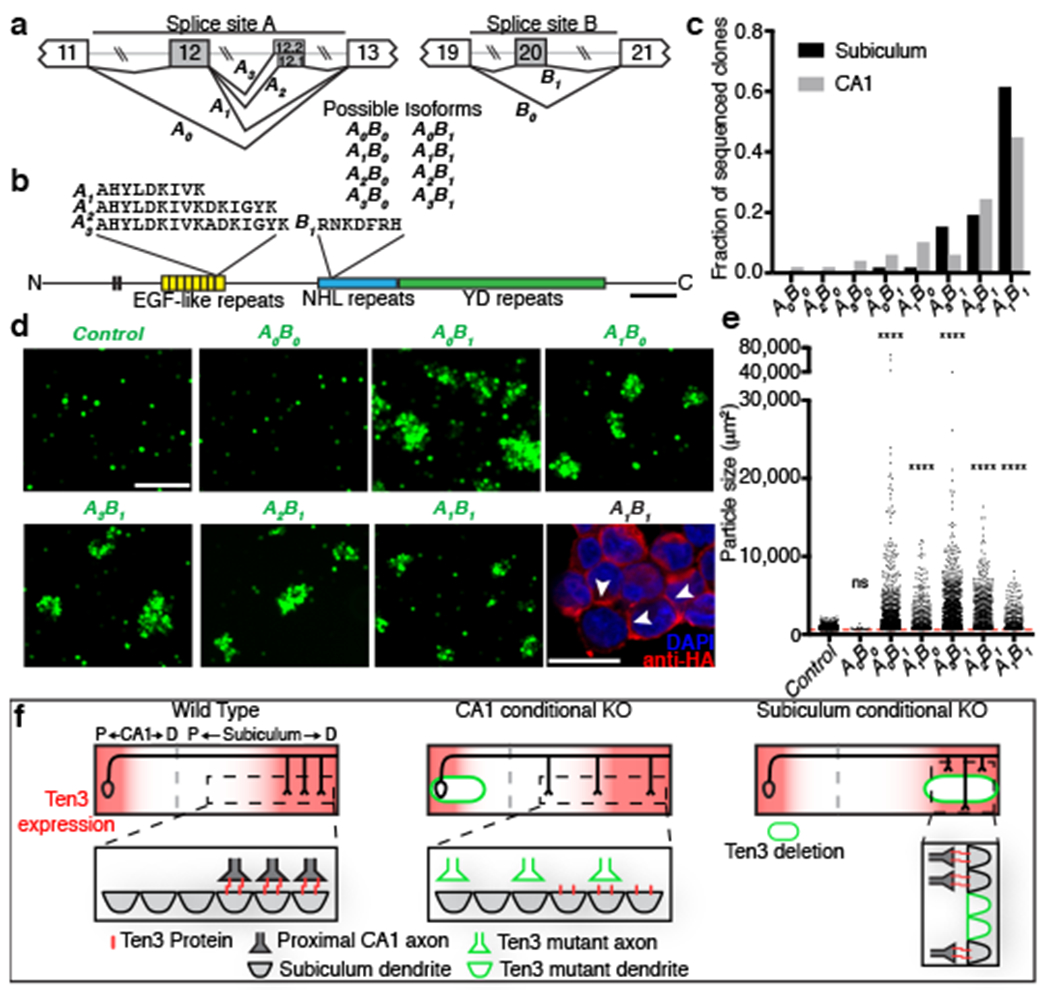
a, Partial Ten3 genomic regions (top) highlighting alternatively spliced exons (gray boxes) and constitutive exons (white boxes). Splice variant names are next to corresponding splicing pattern. b, Locations of alternative splicing sites A and B in Ten3 protein, and amino acid sequences produced. Scale bar, 200 amino acids. c, Summary of cDNA sequencing from P8 subiculum (n=52 clones) and CA1 (n=49 clones). d, Aggregation of K562 cells expressing different Ten3 isoforms and GFP. Scale bar, 200 μm. Bottom right panel: A1B1 aggregate stained for the N-terminal HA tag (red). Arrowheads highlight membrane-localized Ten3 at cell-cell junctions. Scale bar, 20 μm. e, Quantification of aggregate sizes pooled from three biological replicates. Dotted red line shows size cutoff at 600 μm2. ns, not significant; **** p ≤ 0.0001, adjusted p-values from Dunn’s multiple comparisons test after Kruskal-Wallis test, comparing all conditions to GFP. GFP, n = 1449 particles above threshold; A0B0, n = 26; A0B1, n = 1179; A1B0, n= 411; A3B1, n = 1268; A2B1, n= 628; A1B1, n= 336. f, Summary of data (top) and working model (bottom). See Discussion for details.
Ten3 promotes homophilic adhesion
If Ten3 functions as a homophilic cell adhesion molecule as previously proposed28,29,43, it could directly mediate the recognition of Ten3-expressing target cells by Ten3-expressing axons. Ten3 has alternatively spliced isoforms that differ by the inclusion or exclusion of exon 12 and exon 20 (at splice sites A and B, hereafter) encoding 9- and 7-amino acid peptides in the extracellular EGF- and NHL-repeats, respectively44,45 (Fig. 5a, b). We denote the splicing at site A as A0 (exon 12 excluded) or A1 (exon 12 included), and at site B as B0 (exon 20 excluded) or B1 (exon 20 included). We sequenced Ten3 cDNA clones from CA1 or subiculum at P8, a time when the CA1→subiculum projection was still developing (Extended Data Fig. 7). We found two additional alternative splicing variants at site A (termed A2 and A3) that were computationally predicted46; the inclusion of these exons (12.1 or 12.2) would add 6 or 7 additional amino acids to exon 12 containing-variants (Fig. 5a, b). Overall, CA1 and subiculum expressed similar splicing isoforms, most of which included inserts at sites A and B (Fig. 5c).
We next performed cell aggregation experiments, and found that all isoforms tested promoted homophilic adhesion except A0B0, which lacks all alternatively spliced exons (Fig. 5d, e). A0B0 was functionally expressed because it promoted adhesion with Latrophilin-3-expressing cells, as previously reported for other Teneurin and Latrophilin family proteins30 (Extended Data Fig. 9). The A0B0 isoform occurred in only 1 out of 101 sequenced clones, indicating that most Ten3 isoforms present in CA1 and subiculum were capable of interacting in trans to promote homophilic adhesion. When the three highest-expressed isoforms of Ten3 were tested in a mixed cell aggregation assay, all aggregates were mixed, indicating that the major Ten3 isoforms expressed in the hippocampus can interact with each other in trans (Extended Data Fig. 10). Together with the matching expression and conditional knockout phenotypes, these data suggest that homophilic Ten3 interactions between CA1 axons and subicular cell bodies and dendrites control the targeting specificity of proximal CA1 axons to distal subiculum.
Discussion
A striking feature of neural development is the formation of highly precise connections between neurons. Sensory and motor circuits have been extensively used to characterize the molecular control of wiring specificity11,12,47,48, but relatively little is known about how neurons in complex high-order circuits find appropriate partners. Here, we have shown that Ten3 acts in both pre- and postsynaptic neurons in the hippocampus to control the assembly of a precise topographic projection. Loss-of-function phenotypes support a homophilic attraction mechanism: when Ten3 is lost from CA1 neurons, proximal CA1 axons spread throughout the entire subiculum, instead of projecting only to distal, Ten3-high targets; when Ten3 is lost from a subset of distal subicular cells, Ten3-high proximal CA1 axons do not target these areas and instead innervate nearby Ten3-high regions (Fig. 5f). Our in vitro data further show that Ten3 can interact homophilically in trans, supporting a model in which Ten3 on CA1 axons interacts with Ten3 on subicular targets, leading to contact-mediated attraction or stabilization of proximal CA1 axons by distal subicular target cells. This mechanism of action resembles that of the Drosophila Teneurins in the development of olfactory and neuromuscular connections, suggesting an evolutionarily conserved mode of Teneurin function in neural circuit assembly from insects to mammals. However, whereas Drosophila Teneurins instruct matching of discrete types of pre- and postsynaptic cells, the graded expression in both CA1 and subiculum suggest that mouse Ten3 directs continuous topographic mapping along the proximal-distal axis (Fig. 5f).
Our model does not exclude the possibility that interactions of Ten3 with heterophilic partners play additional roles in circuit assembly. While in many cases we observed Ten3 expression in both pre- and postsynaptic partners of specific connections, there were also cases where Ten3 was only observed in axons but not targets (e.g., MEC→dentate gyrus/CA3). Further, the A0B0 isoform did not exhibit homophilic interactions but did interact heterophilically with Latrophilin-3. These observations suggest that interactions between Ten3 and Latrophilins or other potential heterophilic partners may also contribute to wiring specificity.
Our results highlight small regions of Ten3 critical for trans interactions. Splice site A corresponds to the most C-terminal of the 8 EGF-like repeats, which are thought to mediate cis-dimerization of Teneurin proteins44,49. Our results suggest that the EGF-like repeats may also participate in trans interactions, or that Teneurin cis interactions may influence trans interactions. Splice site B is within the NHL-repeat region, which was implicated in homophilic Teneurin interactions using single-cell force spectroscopy29. Our result supports the importance of the NHL repeats, and identifies specific residues that are required for homophilic interactions.
What controls the distal CA1→proximal subiculum projection? Since none of the other three mouse Teneurins exhibited differential expression along the proximal-distal axis of the hippocampal formation16, other differentially expressed proteins might act in parallel with Ten3 to control the distal CA1→proximal subiculum projection. Axon-axon competition could also contribute, as in retinotopic map development50. Indeed, the enhanced severity of the CA1-specific conditional knockout phenotype compared to the whole-animal Ten3KO phenotype (Fig. 3d–f vs. Fig. 2e–g) may result from Ten3-expressing CA1 axons out-competing mutant axons for space in distal subiculum, supporting a role of axon-axon competition in determining CA1→subiculum targeting specificity.
Finally, our findings reveal novel genetic heterogeneity within many areas of the hippocampal region. Although our genetic analyses focused on the CA1→subiculum projection, Ten3-high to Ten3-high connectivity was also observed in the entorhinal→hippocampal projections (Fig. 1d–f), and likely exists in additional hippocampus-associated projections (Extended Data Fig. 3). The matching expression of Ten3 in multiple topographically connected subregions, combined with our loss-of-function and in vitro data, suggests that Ten3 may control the assembly of a widely distributed circuit in mammalian brains.
Methods
Statistics and Reproducibility
All statistical analyses were performed in Prism 7 (Graphpad). No statistical methods were used to determine sample size. The experiments were not randomized. Experimenters were blind to genotype during injections and analysis of axon tracing, but not for electrophysiology or other experiments. Images of Ten3 immunostaining and in situ hybridization (Fig. 1a, Fig. 1b, Fig. 2a, Extended Data. Fig. 1b–j, Extended Data 3a–g, Extended Data 4b–d, Extended Data 6b–d) are representative of at least 3 separate experiments in all cases. Images of entorhinal cortex axon tracing (Fig. 1d, e) are representative of 3 injections. For developmental tracing, images shown are representative of 3 (P2 and P4) or 2 experiments (P6 and P8). For subiculum conditional knockout (Fig. 4, Extended Data Fig. 8), results from all experiments are shown in Extended Data Fig. 8.
Mice.
All animal procedures followed animal care guidelines approved by Stanford University’s Administrative Panel on Laboratory Animal Care (APLAC). Both male and female mice were used, and mice were group housed. CD1 animals from Charles River labs were used for all wild-type expression studies. Ten3Δ4 mice28 were provided by Mriganka Sur, Massachusetts Institute of Technology, and maintained on a CD1 background. Ten3Cre and Ten3fl were maintained on mixed CD1, C57BL/6, and 129 backgrounds. Ten3Cre animals used in this study still had the neomycin resistance cassette in the genome. Ten3fl animals were crossed to a germline-active GFP-FlpO line60 to delete the neomycin resistance cassette. Both neo-deleted and neo-containing Ten3fl mice were used for Fig. 3 and Fig. 4.
Generation of Ten3Cre and Ten3fl mice.
Mice were generated by the Gene Targeting and Transgenics core at Janelia Research Campus. Ten3Cre was generated by homologous recombination in ES cells using standard procedures. Ten3fl was generated by co-injection of the targeting construct with Cas9 mRNA and guide RNAs targeted just outside of the loxP sites. Target sequences for gRNAs were:
GGGTGTCTAGAAAGTCAGTG AGG
AAAGTCCTTCATGGGCTTGC AGG
Targeting was verified in ES cells by long-arm PCR. After microinjection, chimeras were bred to CD1 females and F1 offspring were screened by long-arm PCR and Southern blot to identify animals with germline transmission of the correctly targeted construct.
Generation and affinity purification of Ten3 antibodies.
Rabbit polyclonal antibodies (produced by YenZym Antibodies, LLC, South San Francisco) were raised to the following peptides: Ten3IC (used in main figures), amino acids 163-176, (C)ENRSDSESEQPSNN; Ten3EC, amino acids (C)DTFENGKVNSDTVPTNTVS. Affinity purification from serum was performed using target peptides immobilized on SulfoLink columns (ThermoFisher, 44999). Peptides were coupled to column following manufacturer’s instructions. After blocking and washing, 2 mL antiserum mixed with 2 mL PBS, pH 7.4, was added to column, and left on nutator overnight at 4°C. The next day, columns were washed with 40 mL PBS, pH 7.4, 40 mL PBS pH 7.4 + 0.5 M NaCl, and 40 mL PBS, pH 7.4, all by gravity flow. Columns were eluted with 20 mL 100 mM Glycine, pH 2.5. 1 mL fractions were collected into tubes containing 60 μL 1M Tris-HCl pH 8.8 for neutralization. All washes and elutions were performed at room temperature. Antibody concentration was measured using A280 on a NanoDrop 1000, IgG setting. Fractions containing protein were combined and dialyzed against PBS, pH 7.4 using Slide-a-lyzer cassettes (ThermoFisher, 66380). Antibody concentration was measured again using A280, and BSA (ThermoFisher 15561020) was added to raise total protein concentration to 1 mg/mL. Aliquots were snap frozen in liquid nitrogen and stored at −80°C.
Immunostaining.
Animals were given an overdose of 2.5% Avertin and were perfused transcardially with PBS followed by 4% paraformaldehyde (PFA) (by weight) in PBS. For Ten3 immunostaining, brains were dissected, post-fixed in 4% PFA for 1 hour, and cryoprotected for 24–48 hours in 30% sucrose. For all other immunostaining, brains were dissected, post-fixed in 4% PFA for 12–24 h, and placed in 30% sucrose for 24–48 h. They were then embedded in Optimum Cutting Temperature (OCT, Tissue Tek) on dry ice and stored at –80°C until sectioning. 60 μm floating sections were collected into PBS. Sections were incubated in the following solutions at room temperature unless otherwise indicated: 1 X 5–10 min in PBS, 1 h in 0.3% PBS/Triton X-100 (PBST) and 10% normal donkey serum (NDS), 2–4 nights in primary antibody at 4°C in 5% NDS in PBST, 2 X 15 min in PBST, 2 h in secondary antibody in 5% NDS in PBST, 2 X 15 min in PBST, 30 min in DAPI (1:10,000 of 5 mg/ml, Sigma-Aldrich) in PBS, and 5–10 min in PBS. Sections were mounted on Superfrost Plus slides and coverslipped with Fluoromount-G (SouthernBiotech). For adult Ten3 staining, tissue was fixed overnight. Antigen retrieval on sections was performed in 10 mM Sodium Citrate, pH 8.5 at 80°C for 30 minutes. Tissue was allowed to cool, washed 3 X with PBS, then blocked and immunostained as above. Primary antibodies used were: rabbit anti-Ten3IC (1:1000, 4 nights in primary antibody); rabbit anti-Ten3EC (1:200, 4 nights in primary antibody), mouse anti-Cre (1:1000, Millipore, MAB3120), rabbit anti-PHA-L (1:1000, Vector Labs, AS-2300, 2 nights in primary), chicken anti-GFP (1:2500, Aves Labs, GFP-1020), rat anti-mCherry (1:1000, ThermoFisher, M11217). Secondary antibodies conjugated to Alexa 488, Alexa 647, or Cy3 (Jackson ImmunoResearch) were used at 1:500 from 50% glycerol stocks. For BDA axon tracing, sections were washed 5 min in PBS, incubated in PBST for 30 minutes, streptavidin-Cy3 1:200 in PBST overnight, washed 3 X 15 minutes in PBST, and stained with DAPI and mounted as above. Sections were imaged on Zeiss epifluorescence and 780 confocal microscopes and on a Leica Ariol automated fluorescence slide scanning system. Images were processed in FIJI to stitch multiple fields-of-view of single sections and to adjust contrast and brightness of each channel. Images presented together were processed identically.
In situ hybridization.
In situ hybridization was performed as previously described61 with the following modifications. 12–16 μm cryosections were collected on Superfrost Plus slides. Ten3 probe containing base pairs 4124–4953 of Ten3 mRNA (located in exon 23; mRNA accession: NM_011857.3) was PCR amplified from genomic DNA using the following primers: 5’GTGGCTAAAAGCCCACTGTTGCC 3’, 5’ GAATGGCCCACTGACCTCGCG 3’. PCR product was cloned into pCR4-TOPO (K457502). RNA probes were transcribed using T3 or T7 RNA polymerases. For colorimetric development (Fig. 1d), Sigma-FAST NBT/BCIP (Sigma, B5655) was used. For combined in situ hybridization with immunostaining (Extended Data Fig. 1j) hybridized slides were incubated overnight with alkaline phosphatase-conjugated anti-DIG antibody (1:1000, Roche Applied Science, 1093274) and rabbit anti-PCP4 (1:200, Sigma, HPA005792). Signals were developed using Fast Red TR/Naphthol As-MX (sigma-Aldrich, F4523) and 488 donkey anti-rabbit secondary (1:200, Jackson Immunoresearch). Sections were imaged on Zeiss epifluorescence and 780 confocal microscopes. For fluorescent in situ hybridization for quantification, 12 μm sections of P10 brain were used. Sagittal sections were taken from dorsal hippocampus, and horizontal sections were from middle levels of the dorsal-ventral axis. After hybridization, washing, and blocking, slides were incubated with alkaline phosphatase-conjugated anti-DIG antibody (1:1000) for 1 hour and developed with Fast Red TR/Naphthol As-MX for 45 minutes. Sections were imaged at 10x on a Zeiss epifluorescence scope. Fluorescence intensity measurements were taken on unprocessed images in FIJI and data were processed using custom MATLAB scripts. For CA1 quantifications, a 45-pixel wide segmented line with spline fit was drawn along CA1, from proximal to distal. Intensity values along the CA1 line were measured using the Plot Profile command. For quantification of subiculum, a 125-pixel wide segmented line with spline fit was drawn along subiculum, from proximal to distal. The bottom of the line was aligned to the superficial border of the subicular pyramidal cell layer, the proximal border of subiculum was defined the same as the distal border of CA1, i.e., the point where the compact CA1 cell body layer ended. The distal subiculum border was defined by the increase in cell density of presubiculum layer 2. Because of the narrowing of the distal subicular cell layer, the line was drawn until the Ten3 fluorescent signal became narrower than the 125-pixel line, to avoid averaging areas with zero signal. This results in the exclusion of a small portion of the Ten3 signal in the most distal subiculum. Identical background subtraction was performed on all intensity traces, based on the signal in sense control slides. The intensity traces were binned into 100 bins from proximal to distal, and the traces for individual sections were normalized to a peak of 100. Traces for individual sections were then averaged to produce intensity plots. Numbers of sections were as follows: sagittal and horizontal CA1, 12 sections, 4 animals; sagittal and horizontal subiculum, 14 sections, 4 animals.
Electrophysiology.
At P14–P19, the brain was removed and placed in ice-cold carbogenated slicing artificial cerebrospinal fluid (ACSF) that contains (in mM) 83 NaCl, 2.5 KCl, 1 NaH2PO4, 26.2 NaHCO3, 22 glucose, 72 sucrose, 0.5 CaCl2, and 3.3 MgSO4. 300-μm coronal sections were cut on a Leica vibratome. Slices were allowed to recover at 31°C for 40 min and then at 23–25°C for 30 min to 6 h. Slices were then placed in carbogenated recording ACSF (119 NaCl, 2.5 KCl, 26 NaHCO3, 1 NaH2PO4, 1.5 MgSO4, 2.5 CaCl2, and 11 glucose, all in mM) that contained 50 μM picrotoxin (Sigma). Signals were recorded with a 5×gain, low-pass filtered at 2 kHz, digitized at 10 kHz (Molecular Devices Multiclamp 700B), and analyzed with pClamp 10 (Molecular Devices). Whole-cell recordings were made using 3–5 MΩ pipettes filled with an internal solution that contained (in mM) 123 cesium gluconate, 8 NaCl, 1 CaCl2, 10 EGTA, 10 HEPES, and 10 glucose, pH 7.3 with CsOH, 280–290 mOsm. Series resistance (Rs) and input resistance (Rin) were monitored throughout the experiment by measuring the capacitive transient and steady-state deflection, respectively, in response to a −5-mV test pulse. Rs and Rin did not differ across experimental conditions (Proximal subiculum recordings: Rs WT=4.397 ± 0.157 MΩ, n=12; Ten3 KO = 4.865 ± 0.417 MΩ, n=11, P=0.289, Student’s t-test; Rin in WT=201.6 ± 18.7 MΩ, n=12; Ten3 KO = 253.1 ± 28.64 MΩ, n=11; P=0.141, Student’s t-test; Distal subiculum recordings: Rs WT = 4.409 ± 0.114 MΩ, n=14; Ten3 KO = 4.561 ± 0.213 MΩ, n=9; P=0.502, Student’s t-test; Rin WT= 221.8 ± 29.57 MΩ, n=14; Ten3 KO =254.6 ± 34.83 MΩ, n=9; P= 0.486, Student’s t-test). Responses were evoked by a platinum two-contact cluster electrode (FHC) placed in the Stratum Oriens/alveus above distal CA1, at the stimulation intensities listed in the figure. Cells were clamped at −60 mV to measure GluA (AMPA-receptor)-mediated excitatory postsynaptic currents (EPSC). Analysis was based on the average of ten sweeps. The interstimulus interval for paired pulse ratio measurements was 50 ms.
Stereotactic surgery.
For stereotactic injections in neonatal mice, hypothermia was used for anesthesia. Coordinates were zeroed from lambda. For CA1, coordinates used were: 1 mm lateral, 1.1 mm anterior, 0.85 mm ventral from skull. For subiculum, coordinates were: 1.1 mm lateral, 0.3 mm anterior, 0.8 ventral from skull. For developmental axon tracing, Biotinylated Dextran Amine (BDA, ThermoFisher D1956, 5% in PBS) was iontophoretically injected into CA1 using a Digital Midgard Precision Current Source (Stoelting, 51595), pulled glass micropipettes (World Precision Instruments, 1B120F4) with tips broken to outer diameter of 10 μm, and current parameters 5 μA, alternating 7-sec on, 7-sec off, for 2 min. Animals were perfused between 2 and 8 days post-injection for histology as above. For conditional knockout experiments, 100 nL of lentivirus containing Ub-GFP-Cre (4.6–6.8e8 infectious units/μL, Neuroscience Gene Vector and Virus core, Stanford University) was injected at 100 nL per minute. Subsequent injections of PHA-L or AAV8-hSyn1-FLEx-mGFP-2a-Synaptophysin-mRuby62 were performed at P35–P40. For whole animal knockout studies, PHA-L was injected between P30–P45. Animals were anesthetized with ketamine/xylazine (Lloid Laboratories) or isoflurane and immobilized in stereotactic apparatus (KOPF). Coordinates were: proximal CA1 (from Bregma) 1.4 mm lateral, 1.25–1.3 mm posterior, 1.1–1.2 mm ventral from brain surface; distal CA1 1.4 mm lateral, 1.8–2 mm posterior, 1.1 mm ventral. For PHA-L iontophoresis, 2.5% (by weight) PHA-L (Vector Labs, L-1110) solution in PBS, pH 8, was iontophoretically injected using current parameters 2 μA, alternating 7-sec on, 7-sec off, for 1 min with pipette tips broken to outer diameter of 6–12 μm. For AAV iontophoresis, current parameters were 2 μA, 7-sec on, 7-sec off, for 2 min. Animals were perfused 5 (PHA-L) or 21 (AAV) days later and processed for PHA-L and Cre, or Cre, GFP, and mCherry immunostaining as described above. For entorhinal cortex axon tracing, CD-1 animals aged P40-P55 were used. 40–50 nL AAV1-CMV-GFP was injected at 20 nL per minute into the coordinates (from Bregma): Medial entorhinal 2.8 mm lateral, 4.75 mm posterior, 2.75 mm ventral from brain surface; Lateral entorhinal 4.6 mm lateral, 3.5 mm posterior, 3 mm ventral from brain surface. Animals were perfused 2 weeks later.
Imaging and data analysis for CA1 axon tracing.
For whole animal mutant tracing, every other 60-μm parasagittal section was stained and analyzed. Images of injections were taken at 5x on Zeiss epifluorescence scope and projections were imaged at 10x. Animals with labeling too faint to image or with retrogradely labeled cells were excluded. Images were acquired at identical gain and offset settings, but because injection and projection intensities varied between animals, exposure times were adjusted to avoid saturation. Fluorescence intensity measurements were taken on unprocessed images in FIJI and data were processed using custom MATLAB scripts. For quantification of injections, a 30-pixel wide segmented line with spline fit was drawn along CA1, from proximal to distal. DAPI and Cre signals (from Ten3Cre) were used to identify the proximal end of CA1, and DAPI signal was used to identify distal end of CA1. Intensity values along the CA1 line were measured using the Plot Profile command. For quantification of projections, a 180-pixel wide segmented line with spline fit was drawn along subiculum, from proximal to distal. The bottom of the line was aligned to the superficial border of subiculum pyramidal cell layer, the proximal border of subiculum was defined the same as the distal border of CA1, i.e., the point where the compact CA1 cell body layer ended. The distal border of subiculum was defined as the point where layer 2 of presubiculum becomes obvious as an increase in DAPI density in the superficial cell body layer. The 180-pixel wide curved line was straightened using the Straighten function under Selection. For injections that labeled CA2 and CA1, axons from CA2 were present near the distal border of CA1. Area selections were drawn around these axons and intensities were set to zero using the Clear function. Pixel values at each position were imported into MATLAB, and the 180 pixels for each point along the proximal-distal axis were averaged to give the fluorescence intensity at that coordinate of the proximal-distal axis. From this point forward, injections and projections were processed the same way. A manual background subtraction was performed by selecting a value that corresponds to an area of the trace that was only background signal, and this value was subtracted from all points on the trace. Any intensity values below zero after subtraction were set to 0. The length of the CA1 or subiculum axis was divided into 100 equally-sized bins and intensity values were averaged within each bin. For each injection or projection, the 3 sections with the highest total labeling were combined by summing the 3 intensity values at each binned position. This summed intensity trace was then normalized to a peak value of 100. The mean position of the trace was calculated by multiplying the intensity value by the bin position, summing across the entire axis, and dividing by the sum of the intensity values. The width of the trace was defined as the full width at half maximum. Traces were averaged across animals to produce the plots in Fig. 2e and Extended Data Fig. 5c, d, and the shaded error traces represent the standard error of the mean fluorescence intensity at that bin. For mean and width quantifications in Fig. 2f, g, the means were compared using two-tailed t-tests. For quantification of tracing across the proximal-distal axis of CA1 (Extended Data Fig. 5), injections and projections were processed as above. Values were combined into 5 groups for analysis and averaging based on the injection mean positions to the right of Extended Data Fig. 5d. Projection widths were compared using 2-way ANOVA followed by Sidak multiple comparisons test, and multiplicity-adjusted p-values are reported. Projection mean regression lines were generated and compared using Prism 7 (Graphpad). All statistical analyses were performed in Prism 7 (Graphpad).
Data analysis for conditional knockout experiments.
Tissue processing and imaging for CA1 and subiculum conditional knockout experiments was the same as for whole animal mutants, with the following modifications. For subiculum conditional knockout, animals were excluded if lentivirus-GFP-Cre cells spread into the proximal half of CA1 (>2 cells in proximal CA1 per section, or if any PHA-L+ cells were GFP-Cre+). Some animals had GFP-Cre expression in the distal CA1; however, because these cells express low to no Ten3, these animals were included as subiculum conditional knockouts. GFP-Cre signal in subiculum was measured and quantified along with the PHA-L labeling intensity. Heatmaps were generated in MATLAB using the ‘imagesc’ function, and 3-dimensional plots were generated in MATLAB using the ‘surf’ function. For CA1 conditional knockout, animals were excluded if lentivirus-GFP-Cre cells spread into the distal half of subiculum. The mRuby signal from AAV8-hSyn1-FLEx-mGFP-2a-Synaptophysin-mRuby was used for injection quantifications and the mGFP for projection quantifications. In addition, we stained for Cre in the 647 channel instead of using the GFP-Cre signal, because of the presence of mGFP. mGFP and GFP-Cre signal could be unambiguously distinguished by staining for Cre. In cases where GFP-Cre signal overlapped with mGFP signal, the Cre staining in the 647 channel was used to mask out Cre+ pixels, so the GFP-Cre signal was not counted as mGFP from CA1 axons. Analysis and quantification for CA1 conditional knockout projection mean and width was identical to the whole animal knockout. For both CA1 and subiculum conditional knockouts, animals were excluded that had injection mean positions > 30 in CA1.
Hippocampus cDNA sequencing.
Freshly dissected brains from P8 CD-1 mice were sliced horizontally into 1 mm slices using a tissue slicer. CA1 and subiculum were microdissected from individual slices using tungsten needles. Tissue from 5 mice was pooled, and total RNA was extracted using TRIzol reagent (Thermo-Fisher 15596018) and chloroform followed by purification using the RNeasy kit (Qiagen). DNA was removed by on-column digestion with DNase (Qiagen) for 15 minutes. cDNA was produced using the Superscript III First-strand synthesis System (Thermo-Fisher 18080-051) and a gene specific primer located 3’ of splice site B - 5’ ATCAGAGACGTACAAATCTCCGG 3’- followed by PCR for 30 cycles with Q5 polymerase (NEB) using the same primer and a primer located 5’ of splice site A – 5’ TGTAATCAGAGAGCTTGCCACC 3’. PCR products were cloned into pCR-Blunt II-TOPO (Thermo-Fisher 450245), and individual colonies were miniprepped and sequenced using T7 and SP6 sequencing primers (Sequetech) and the status at splice sites A and B was assigned to individual clones using Geneious 10 software.
DNA constructs.
Full-length mouse Ten3 cDNA was obtained from Source Bioscience, clone I.D. IRCKp5014M2020Q (Accession number BC145284.1). This sequence lacks all alternatively spliced exons (corresponding to isoform A0B0). HA-tag was added and cDNA was cloned into pCDNA3.1 (–) (ThermoFisher, V79520) in 2 steps using NEBuilder HiFi Assembly kit (NEB, E2621) and NEB Stable competent cells (NEB, C3040H). Phusion Taq polymerase (NEB M0530) was used to amplify the 5’ portion for Ten3 cDNA, adding a 5’ HA tag and Kozak sequence. Primers were as follows: 5’TAGACTCGAGCGGCCGCCACCATGTACCCATACGATGTTCCAGATTACGCTGATGTGAAGGAACGCAGG 3’ 5’ TGGAATTCTGCAGATATCCTGAGGATCAGGCAA 3’ NEBuilder HiFi Assembly mix was used to insert this PCR fragment into pCDNA3.1(–) digested with EcoRV and NotI. The assembled product was subsequently digested with EcoRV and KpnI, and the HiFi Assembly mix was used to insert the 3’ end of Ten3 cDNA, amplified using the following primers 5’ CCTGATCCTCAGGATATCATTAG 3’ 5’ TTAAACTTAAGCTTGGTACCTTACCTCTTGCCGATCTCA 3’ The assembled product was fully sequenced. Additional isoforms were generated using the Q5 Site Directed Mutagenesis kit (NEB E0554S). A0B1 was generated from A0B0 using the following primers: 5’ TTAGACATAGTAGCAACCCAGCTCACAG 3’ 5’ AATCTTTATTTCTTAGTTCTAAAACACTTGTCACATTC 3’ A1B0 and A1B1 were generated from A0B0 and A0B1, respectively, using the following primers: 5’ AAGATAGTTAAAGAGGGTTGCCCCGGCTTGT 3’ 5’ ATCCAAATAGTGAGCAATTGTGCAGTGCTCTCCGTTC 3’ A2B1 was generated from A1B1 using the following primers: 5’ GATATAAAGAGGGTTGCCCCGGCTTGT 3’ 5’ CTATCTTGTCTTTAACTATCTTATCCAAATAGTGAGCAATTGTGCAG 3’ A3B1 was generated from A1B1 using the following primers: 5’ GGATATAAAGAGGGTTGCCCCGGCTTGT 3’ 5’ TATCTTGTCTGCTTTAACTATCTTATCCAAATAGTGAGCAATTGTGCAG 3’
All of the HA-tagged Ten3 isoform open reading frames were then cloned into a dual transcription unit vector under the Ef1α promoter. The vector also contained mCherry or GFP under the CMV promoter. Primers for amplifying the HA-tagged open reading frames were:
5’ TACAAAAAAGCAGGCTGCCACCGTCGACATGTACCCATACGATGTTC 3’ 5’ TTGTACAAGAAAGCTGGGTGGATCCTTACCTCTTGCCGATC 3’
NEBuilder HiFi Assembly mix was used to insert this PCR fragment into the destination vector digested with BamHI and SalI.
CMV-mCherry and CMV-GFP were generated by cloning eGFP and mCherry into NheI and HindIII-digested pCDNA3.1 (–) using the NEBuilder HiFi Assembly kit. eGFP and mCherry were amplified from source plasmids using the following primers: 5’ GGAGACCCAAGCTGGCTAGCCACCATGGTGAGCAAGGGCGA 3’ 5’ ATCAGCGGTTTAAACTTAAGCTTTTACTTGTACAGCTCGTCCA 3’
The expression construct for human Latrophilin-3 was published previously63 and was provided by Rick Sando and Tom Südhof (Stanford University).
Single isoform K562 cell aggregation assay.
K562 cells (ATCC CCL-243, lot 61978333) were grown in RPMI-1640 (Gibco 11875-093 with 10% FBS (Gibco A3160501) and 1X Penicillin-Streptomycin (Gibco 15140122). Lot was authenticated and tested for mycoplasma by ATCC. Cells were electroporated using the Neon Transfection system (ThermoFisher MPK5000) in 100 μl tip sizes. DNA was prepared using HiPure Plasmid Filter MaxiPrep kit (ThermoFisher K210017). 15 μg of the Ef1α-Ten3 CMV-GFP dual transcription unit plasmid expressing a particular isoform was used for each electroporation. For GFP-only condition, 6.43 μg of Ef1α -empty CMV-GFP along with 8.57 μg of empty pCDNA3.1 were used. 2 x 10⁶ cells were washed once in 5 mL PBS, resuspended in 110 μl Buffer R, mixed with DNA, and electroporated using the following settings: 1450V, 10 ms, 3 pulses, and added to 5 mL of warm RPMI-1640 with 10% FBS. Cells were incubated in 6-well plates at 37°C and 5% CO2. 16–20 hours later, cells were centrifuged 200 x g for 3 minutes, resuspended in 1 mL RPMI-1640 + 10% FBS, and incubated for 15 minutes at 37°C with 0.1 mg/mL DNase (Worthington LS002060). Cells were washed twice with RPMI-1640 + 10% FBS, then resuspended in aggregation medium. Aggregation medium was neural growth medium: Neurobasal-A, 4% B27, 2 mM Glutamine, 10% FBS, 20 mM HEPES. Cells were passed through a 40-μm cell strainer, counted, and added to wells of a 24-well plate at 4 x 10⁵ cells/mL in 1 mL aggregation medium, and plate was placed on a nutator at 37°C for 1.5 hours. After 1.5 hours, cells were gently transferred to 2 mL of aggregation media in a 6 well plate and imaged with a Nikon Eclipse Ti microscope using a 4x lens. 5 images were taken for each well. Images were thresholded in FIJI and Analyze Particles was used to measure particle number and size. Particle sizes from 3 separate experiments were combined, and particles below a 600 μm2, the size of a large GFP cell in control wells, were filtered out to remove single cells. Combined particle sizes were then compared to GFP-only control using a Kruskal-Wallis test followed by Dunn’s multiple comparisons test. Family-wide significance level was set to 0.05, and multiplicity adjusted p-values were reported. For HA immunostaining following aggregation, cells were fixed in 4% PFA for 15 minutes, centrifuged for 3 min at 200 x g, rinsed once with PBS, and resuspended in 30% sucrose in PBS. Cells were spun onto Superfrost Plus slides using a homemade cytospin64 the incubated in the following solutions, at room temperature except for primary antibody: 2 X 5 min in PBS, 10 min in 0.1% Triton X-100 in PBS, 3 X 5 min in PBS, 30 minutes in 10% NDS in PBS, overnight in primary antibody (Ms anti-HA, Covance MMS-101R) at 4°C in 5% NDS in PBS, 3 X 5 min in PBS, 2 hr in secondary antibody (Donkey Alexa 647 anti-mouse, Jackson ImmunoResearch) in 5% NDS in PBS, 3 X 5 min in PBS, 5 min in DAPI, and 5 min in PBS. Aggregates were imaged at 40X on a Zeiss 780 confocal microscope.
K562 mixed cell aggregation assay.
For the Ten3 isoform mixing assay (Extended Data Fig. 10), electroporations and aggregation assay were performed as above with the following modifications. The mCherry versions of the dual promoter constructs were used where appropriate. The two populations of cells were mixed at 2 x 10⁵ each in 1 mL aggregation media, for a final cell concentration of 4 x 10⁵ cells/mL. Phase contrast images of the cells and aggregtates were also taken. For quantification, aggregates were identified from the phase image, then identified as mixed, GFP-only, or mCherry-only based on the merged fluorescence image. Mixed aggregates had to contain at least 3 cells of each color, in order to avoid identifying single population aggregates as mixed due to chance overlap with a single cell in the other channel. At least 100 aggregates across 3 separate experiments were counted. For the Latrophilin-3 and Ten3 mixing experiment, conditions and analysis differed as described below. For each electroporation, 5 μg CMV-GFP DNA was co-electroporated with 12 μg CMV-Ten3 or 12 μg empty pCDNA3.1, or 5 μg CMV-mCherry and 1.75 μg CMV-Latrophilin-3. Aggregation media was the same as above except with 1.25% FBS rather than 10%. After 1.5 hours of mixing, 3 μl aliquots were taken from the wells, spotten onto slides, and imaged at 5x on a Zeiss epifluorescence scope. 3–4 aliquots were taken per well, and 2 images were taken per aliquot. For aggregate size quantification, the GFP and mCherry channels were thresholded, combined, and Analyze Particles was used on the combined binary image to measure particle number and size. Particle sizes from 3 separate experiments were combined, and particles below a 600 μm2, the size of a large GFP+ cell in control wells, were filtered out to remove single cells. Combined particle sizes were then compared to Latrophilin-3 / GFP-only control using a Kruskal-Wallis test followed by Dunn’s multiple comparisons test. Family-wide significance level was set to 0.05, and multiplicity adjusted p-values were reported.
Extended Data
Extended Data Figure 1 |. Ten3 staining details and controls.
a, Diagram of Ten3 protein showing location of antibody epitopes, specific domains, and region deleted in the Ten3Δ4 mutant. In Ten3Δ4, a neomycin resistance cassette replaces 110 bp of sequence directly N-terminal to the transmembrane domain. The Ten3IC antibody is used for all Ten3 staining in the paper except (d, e) of this figure. Scale bar represents 200 amino acids. b, c, Ten3IC staining (red) on P9 horizontal sections of wild-type Ten3+/+ (b) and mutant Ten3Δ4/Δ4 (c) brains, showing loss of staining in Ten3 mutants. Note that the Ten3IC epitope is located N-terminal to Δ4, suggesting that in Ten3Δ4/Δ4 either the mRNA undergoes nonsense-mediated decay, or the truncated protein is not stable. d, e, Ten3EC staining on P10 horizontal sections of wild-type Ten3+/+ (d) and mutant Ten3Δ4/Δ4 (e) brains. Staining has higher background than Ten3IC antibody, but signal is present in proximal CA1 (arrow) and distal subiculum (arrowheads), similar to Ten3IC, which is absent in the knockout (open arrow/arrowheads). f, Ten3 staining (red) on P10 horizontal section with boxes around regions magnified in (g-i). g, Zoom-in showing Ten3 staining in dentate gyrus (DG), CA3, and CA1. Intensity was increased to highlight Ten3 signal in axons and dendrites. Ten3 in stratum radiatum of proximal CA1 (arrowhead) is most likely from CA1 dendrites, since CA3 cells, the major source of axons in this layer, did not express Ten3 mRNA (Fig. 1b). Ten3 in the molecular layers of DG and CA3 (arrows) is likely contributed by the axons of medial entorhinal cortex layer II neurons51, since DG and CA3 neurons did not express Ten3 mRNA (Fig. 1b). h, Zoom-in on proximal CA1 pyramidal cell layer showing Ten3 signal in cell bodies. i, Zoom-in on proximal CA1 stratum lacunosum-moleculare, showing Ten3 signal in the region where MEC axons synapse onto CA1 pyramidal neuron dendrites. j, In situ hybridization on P9 horizontal section for Ten3 mRNA (magenta) combined with immunostaining for PCP4 (green), a marker of CA2 neurons52. No overlap between Ten3 and PCP4 was observed. Scale bars represent 200 μm in (b–g, j), and 100 μm in (h, i).
Extended Data Figure 2 |. Distribution of Ten3 mRNA in sagittal sections.
a, In situ hybridization for Ten3 mRNA on sagittal section of P10 brain. Top, merged image with Ten3 mRNA signal in red and DAPI in blue; middle, Ten3 mRNA signal alone; bottom: DAPI signal alone. b, Top panels: magnified image of Ten3 in situ hybridization in CA1; bottom panel: quantification of Ten3 mRNA along the proximal-distal axis of CA1 (n=12 sections, 4 animals), showing a graded signal that peaks in proximal CA1 and decreases to a minimum in distal CA1. Proximal-distal axis is divided into 100 bins, with 1 being most proximal and 100 most distal. Shaded curves represent mean ± s.e.m. c, Top panels: magnified image of Ten3 in situ hybridization in subiculum; bottom panel: quantification of Ten3 mRNA along the proximal-distal axis of subiculum (n=14 sections, 4 animals) showing a graded signal that peaks in distal subiculum and decreases to a minimum in proximal subiculum. The distributions in CA1 and subiculum are similarly shaped but reversed along the proximal-distal axis, reflecting the graded topographic connections along this axis (see Fig. 2, Extended Data Fig. 5c). Scale bars represent 200 μm in all panels.
Extended Data Figure 3 |. Ten3 expression and topography details.
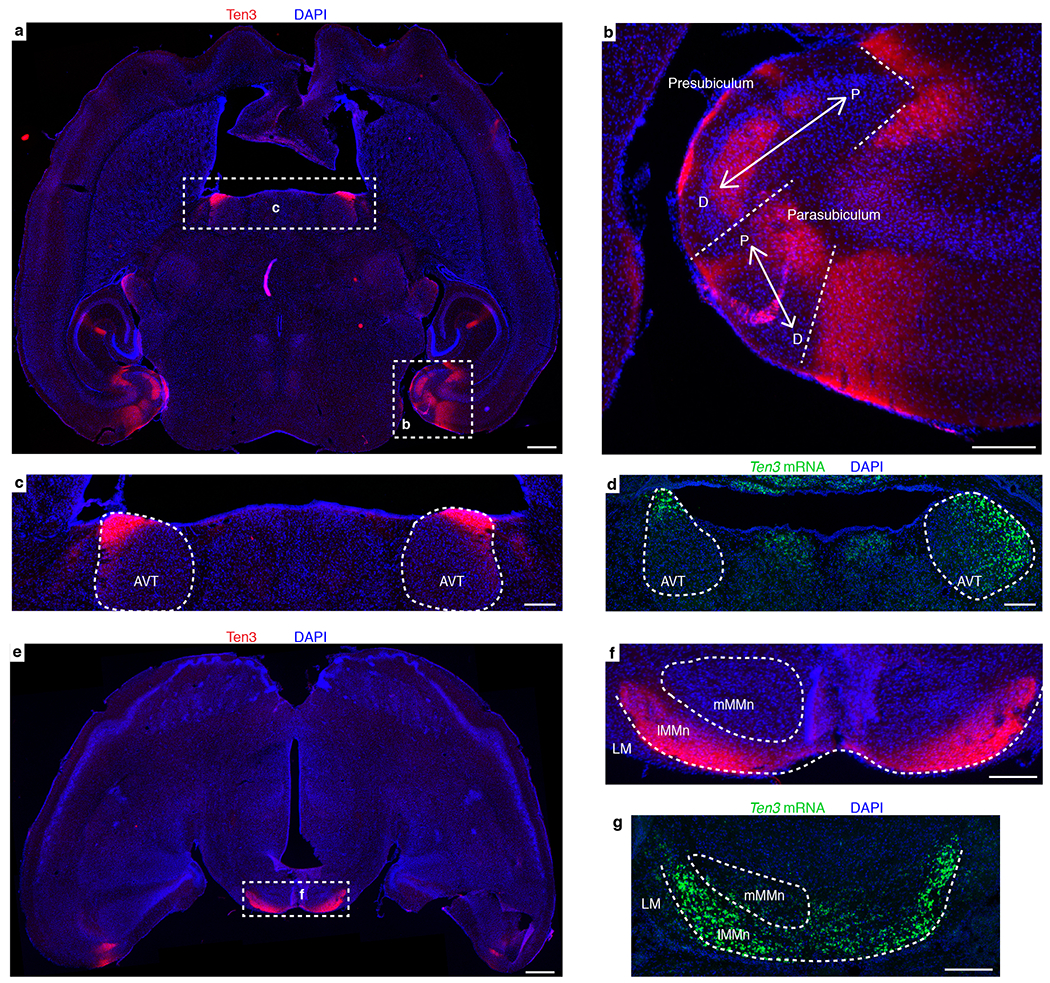
a, Ten3 staining (red) on P10 horizontal section. Dotted rectangles highlight staining in the hippocampal region and anteroventral thalamic nucleus, which are magnified in (b) and (c). b, Zoom-in on parahippocampal region, showing expression of Ten3 relative to the proximal-distal (P-D) axes (arrows) in the presubiculum and parasubiculum. The connectivity of these regions is complex53,54, but appears to be consistent with preferential connectivity between Ten3-expressing subregions. Ten3 is expressed in distal presubiculum (close to parasubiculum), which projects to medial entorhinal cortex near the parasubicular border54, and receives projections from distal subiculum38, both Ten3-high subregions. Ten3 is also expressed in proximal parasubiculum, which projects to medial entorhinal cortex53 and receives projections from distal subiculum55, again both Ten3-high subregions. c, Zoom-in on anteroventral thalamus, showing intense Ten3 staining in anterior and lateral division of the anteroventral thalamic nucleus (AVT, outlined). Distal subiculum, another Ten3-high region, projects to the AVT, whereas proximal subiculum projects to the anteromedial thalamus56. d, In situ hybridization for Ten3 mRNA (green) on P9 horizontal section from similar location as (c). e, Ten3 staining (red) on P10 horizontal section, more ventral than (a). Dotted rectangle highlights intense staining in medial mammillary nucleus, which is magnified in (f). f, Zoom-in on medial mammillary nucleus, showing Ten3 labeling in the lateral division of the medial mammillary nucleus (lMMn). Outlines show location of lateral mammillary nucleus (LM), lMMn, and medial subdivision of the medial mammillary nucleus (mMMn). Proximal subicular neurons project to mMMn, whereas Ten3-high distal subicular neurons project to Ten3-high lMMn39,57–59. lMMn neurons project to Ten3-high AVT, while mMMn neurons project to the anteromedial thalamic nucleus56. g, In situ hybridization for Ten3 mRNA (green) on P9 horizontal section from similar location as (f). Scale bars represent 500 μm in (a) and (e) and 200 μm elsewhere. In summary, the pattern of Ten3-high to Ten3-high connectivity observed for CA1, subiculum, and entorhinal cortex appears to extend to many of the topographic projections formed between these subregions and the presubiculum, parasubiculum, thalamus, and mammillary nucleus.
Extended Data Figure 4 |. Generation and characterization of Ten3Cre.
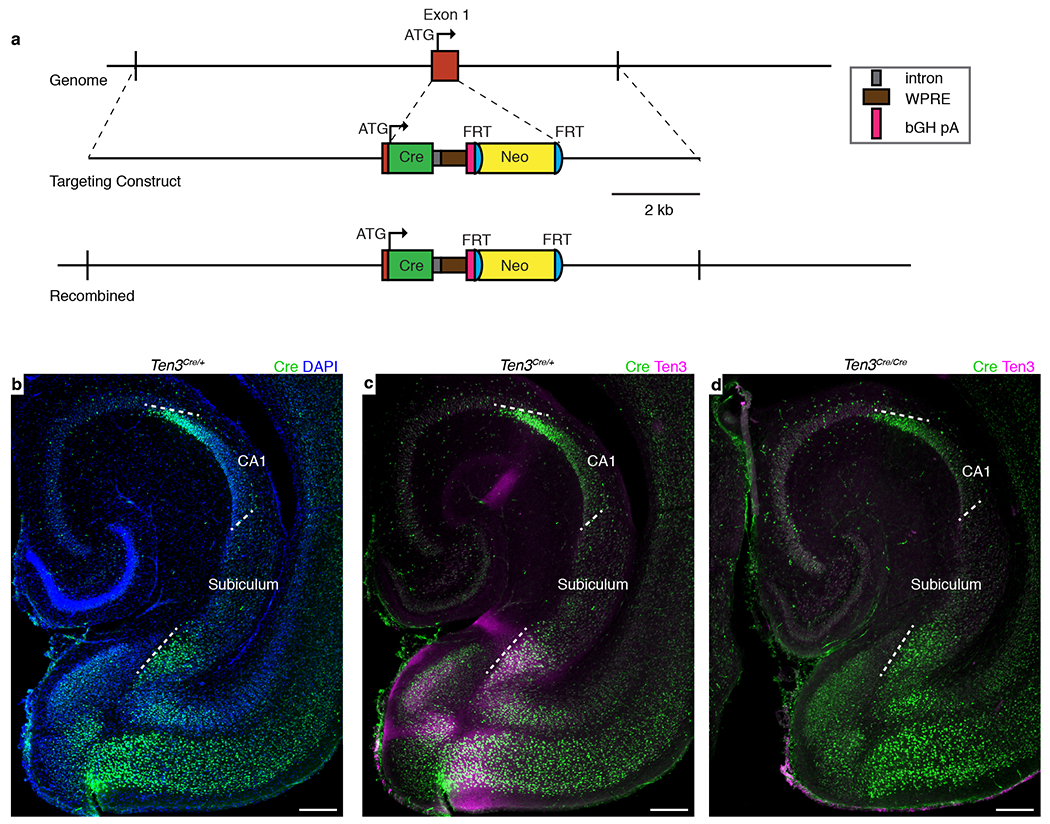
a, Design of Ten3Cre. Top – Region of chromosome 8 containing Ten3 exon 1, which contains the start codon (ATG). Middle – Targeting construct with Cre open reading frame inserted directly after the Ten3 start codon. Cre is followed by a synthetic intron, woodchuck hepatitis virus posttranscriptional regulatory element (WPRE), and bovine growth hormone polyadenylation sequence (bGH pA) (see key on right). The neomycin resistance cassette (Neo) includes PGK promoter driving the resistance gene. Bottom – Genomic region after homologous recombination. The endogenous exon 1 sequence after the start codon is replaced with Cre. Neo cassette was not removed by FLP-mediated recombination in the mice used in Fig. 2. b-d, Cre and Ten3 protein expression in P10 horizontal sections from Ten3Cre mice. White dotted lines highlight proximal and distal borders of CA1 and subiculum. (b, c) Cre expression (green) mimics the distribution of Ten3 expression (magenta) in Ten3Cre/+ mice. (d) In Ten3Cre/Cre mice, Ten3 immunostaining is absent. Scale bars, 200 μm.
Extended Data Figure 5 |. Analysis of CA1→subiculum projections with various injection sites in Ten3Het control and Ten3KO mice.
a, b, PHA-L (green) injection in distal CA1 (a) and corresponding projection in proximal subiculum (b) in Ten3Het mouse. Scale bars, 200 μm c, d Averaged normalized injection (c) and projection (d) traces of all Ten3Het (black) and Ten3KO (red) mice analyzed, binned into 5 groups by the mean position of the injection, and plotted from most proximal (top) to most distal (bottom) injections (bin limits and number of animals per bin listed on the right of (d). Proximal-distal axis position is numbered from 1 (most proximal) to 100 (most distal). Shaded error curves represent mean ± s.e.m. at each bin. e, Projection width in subiculum versus injection mean position in CA1 for all animals (Ten3Het: n = 31, black circles; Ten3KO: n = 38, red triangles). f, Projection width data binned by injection mean. Number of animals per bin same as (d). Projection width was significantly increased in Ten3KO for the 3 most proximal bins. **** denotes p < 0.0001; multiplicity adjusted p-values after 2-way ANOVA with Sidak correction for multiple comparisons. Error bars are mean ± s.e.m. g, Projection mean position in subiculum versus injection mean position in CA1 for all animals used (Ten3Het: n = 31; Ten3KO: n = 38), with superimposed linear regression lines (Ten3Het: R2 = 0.9812; Ten3KO: R2 = 0.9515). The slopes were significantly different (p < 0.0001), indicating a less sharp topography in Ten3KO mice. Bin 1 data (most proximal, injection mean 10-25) in (c–g) is the same data as in Fig. 2e–g.
Extended Data Figure 6 |. Generation and characterization of Ten3flox.
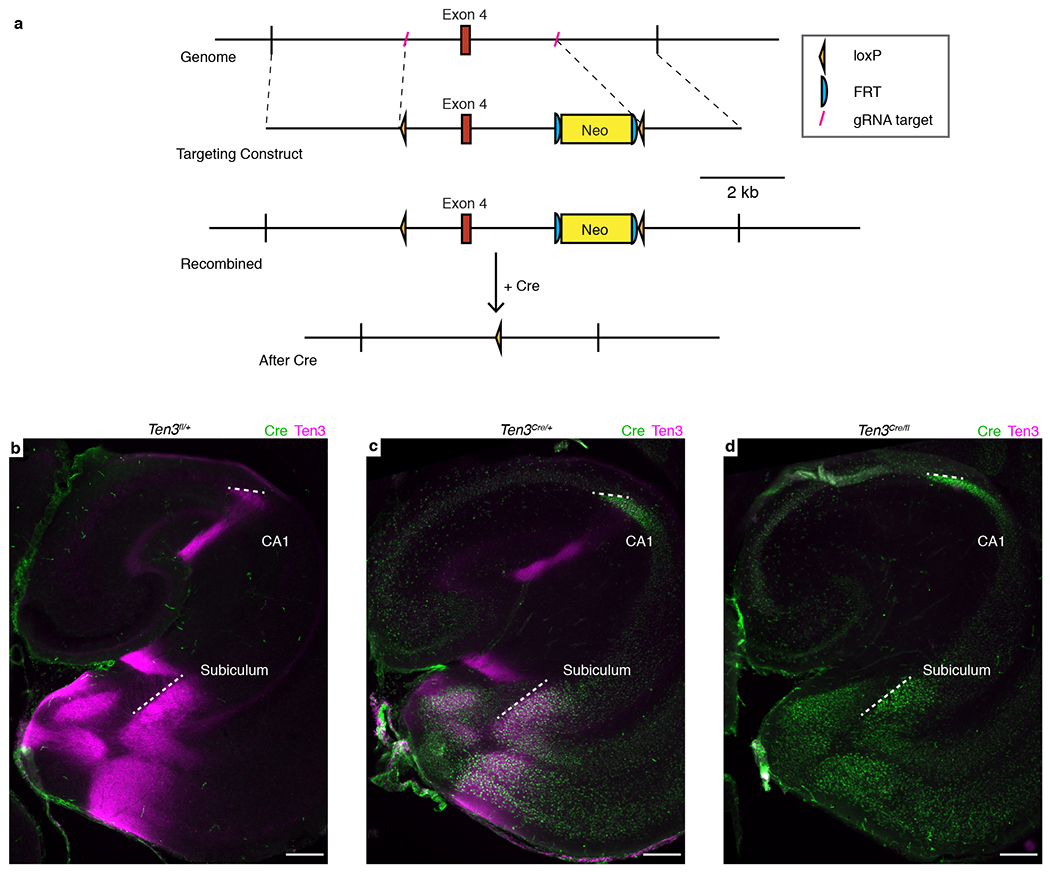
a, Design of Ten3fl. Top – region of chromosome 8 containing Ten3 exon 4, which is 239 base pairs long and encodes 19 of the 21 amino acids in the transmembrane domain. Guide RNA (gRNA) targets shown in red (see key at right). Line 2 – targeting construct with loxP sites inserted 5’ and 3’ of exon 4. The neomycin resistance cassette (Neo) includes PGK promoter driving the resistance gene. Line 3 – genomic region after homology-directed repair. Bottom – deletion of exon 4 after Cre-mediated recombination between loxP sites. Neo cassette was removed by FLP-mediated recombination in some of the mice used in Fig. 3 and 4. In addition to deleting exon 4, the reading frame 3’ to exon 4 is frame-shifted with respect to the reading frame 5’ to exon 4. b–d, Cre (green) and Ten3 (magenta) protein expression in P10 horizontal sections from Ten3fl/+ (b), Ten3Cre/+ (c), and Ten3Cre/fl (d) mice. Ten3 staining is absent in Ten3Cre/fl mice. White dotted lines highlight proximal and distal borders of CA1 and subiculum. Scale bars, 200 μm.
Extended Data Figure 7 |. Time-course of CA1→subiculum projection development.
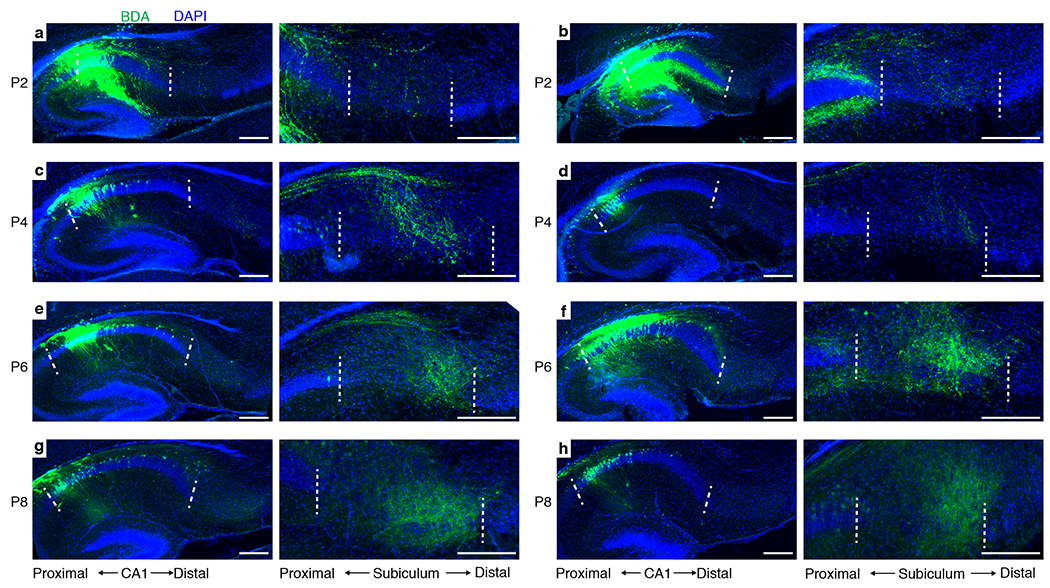
Sagittal sections from animals injected with BDA (green) in CA1 at P0, and perfused for staining at P2 (a, b), P4 (c, d), P6 (e, f), or P8 (g, h). 2 animals are shown for each time point with a pair of images per animal. Within each pair, the left image shows the section that contains the center of the injection site at CA1, whereas the right panel shows a magnified image of the section that contains the highest density of projection at subiculum. Dashed lines mark proximal and distal CA1 borders in the left panels and proximal and distal subicular borders in the right panels. CA1 axons are largely absent at subiculum at P2, and increase intensity from P4 to P8. Scale bars, 200 μm.
Extended Data Figure 8 |. Subiculum conditional knockout plots.
a, b, Plots from Ten3+/+ (a) and Ten3fl/fl (b) animals with minimal GFP-Cre expression. Heatmaps show normalized PHA-L fluorescence intensity (red, left) and normalized GFP-Cre intensity (green, middle) in subiculum, same animals. Each row is one section, 120 μm between rows, colorbars shown below (a), and proximal-distal position is on the x-axis. Surface plots are shown to the right of the corresponding heatmaps, and show PHA-L fluorescence intensity as height and GFP-Cre fluorescence intensity according to the colormap shown below (a). P, proximal; D, distal; M, medial; L, lateral. Projections are similar between Ten3+/+ and Ten3fl/fl. c, d, Plots from Ten3+/+ (c) and Ten3fl/fl (d) animals with high GFP-Cre expression in subiculum. In Ten3fl/fl animals, PHA-L signal is decreased in GFP-Cre regions. # denotes animals shown in Fig. 4.
Extended Data Figure 9 |. Latrophilin-3 and Ten3 aggregation assay.
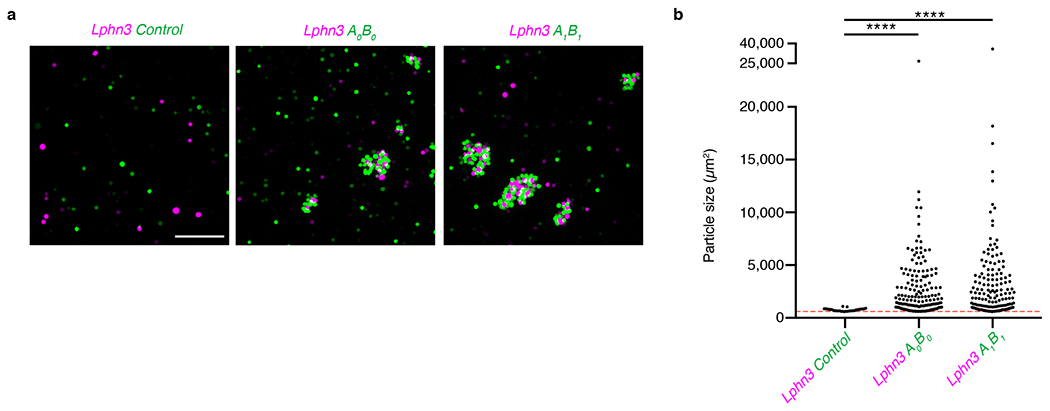
a, Images from aggregation assay with cells co-transfected with Latrophilin-3 (Lphn3) and mCherry (magenta) mixed with cells co-transfected with GFP and empty vector (left), A0B0 isoform of Ten3 (middle), or A1B1 isoform of Ten3 (right). Scale bar, 200 μm, applies to all images. b, Quantification of aggregate sizes pooled from three biological replicates. Dotted red line shows cutoff at 600 μm2, the size of a large GFP+ cell from the control images. Asterisks denote significance from Dunn’s multiple comparisons test after Kruskal-Wallis test, comparing all conditions to the Lphn3 and control mix, Lphn3 + control: n = 32 particles above threshold; Lphn3 + A0B0: n = 172; Lphn3 + A1B1: n = 159. ns, not significant; **** p ≤ 0.0001, multiplicity adjusted p-values.
Extended Data Figure 10 |. Aggregation assays for cells expressing different Ten3 splicing isoforms.
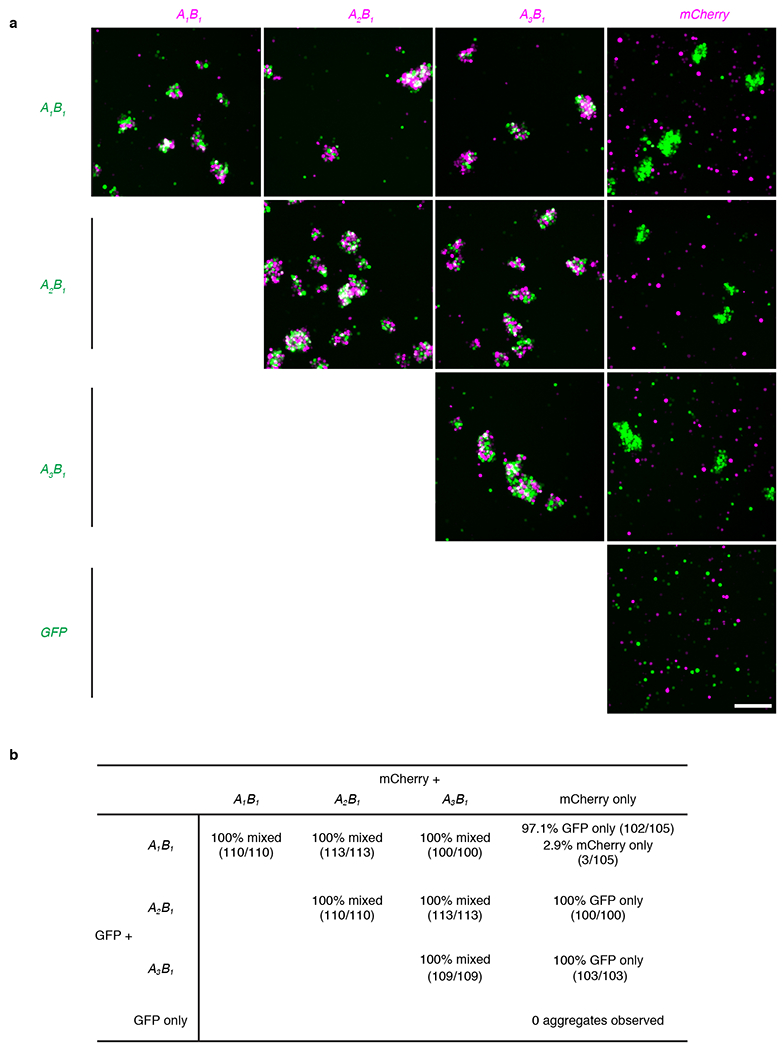
a, Cell aggregation assay with combinations of K562 cells expressing the A1B1, A2B1, or A3B1 Ten3 isoform along with GFP or mCherry. Scale bar in bottom right panel, 200 μm, applies to all images. b, Quantification of aggregates observed in 3 biological replicates of the aggregation experiment in a. At least 100 aggregates were counted across the 3 replicates in each of the 10 mixing conditions, except for the GFP-alone and mCherry-alone control, where no aggregates were observed. 100% of aggregates were mixed in combinations where both cell populations expressed a Ten3 isoform. No mixed aggregates were observed in combinations of Ten3-expressing cells with cells expressing mCherry alone, confirming that the aggregation is Ten3-dependent and not due to an endogenously expressed interaction partner. Fractions in parentheses indicate aggregates of a particular type out of all aggregates counted in that condition.
Acknowledgements
We thank C. Guo and HHMI/Janelia Research Campus for producing the Ten3Cre and Ten3fl alleles, M. Sur for providing the Ten3Δ4 allele, the Neuroscience Gene Vector and Virus Core at Stanford for producing viruses, K. DeLoach for technical assistance, T. Mosca and W. Hong for advice and inspiration, members of the Luo lab for discussion and support, P. Thomas for the dual transcription unit vector, T. Südhof for advice and the Latrophilin-3 construct, and K. Shen, L. Giocomo, T. Mosca, H. Li, J. Li, J. Lui, E. Richman, and A. Shuster for critiques of the manuscript. D.S.B. was supported by an NIDCD predoctoral fellowship (F31DC013240), L.A.D. was supported by an NINDS postdoctoral fellowship (F32NS087860), and L.L. is an investigator of HHMI. This work was supported by an NIH grant (R01-NS050580 to L.L.).
Footnotes
Code Availability. Custom MATLAB scripts used in analyzing data are available from the corresponding author upon reasonable request.
Data availability. All data supporting the findings reported in this study are available from the corresponding author upon reasonable request. Accession codes for Ten3 isoform cDNA sequences: Genbank MG387139-MG387146.
Author Information The authors declare no competing financial interests.
References
- 1.Scoville WB & Milner B Loss of recent memory after bilateral hippocampal lesions. J. Neurol. Neurosurg. Psychiatry 20, 11–21 (1957). [DOI] [PMC free article] [PubMed] [Google Scholar]
- 2.Squire LR, Stark CEL & Clark RE The medial temporal lobe. Annu. Rev. Neurosci 27, 279–306 (2004). [DOI] [PubMed] [Google Scholar]
- 3.O’Keefe J & Dostrovsky J The hippocampus as a spatial map. Preliminary evidence from unit activity in the freely-moving rat. Brain Res. 34, 171–175 (1971). [DOI] [PubMed] [Google Scholar]
- 4.Hafting T, Fyhn M, Molden S, Moser M & Moser EI Microstructure of a spatial map in the entorhinal cortex. Nature 436, 801–806 (2005). [DOI] [PubMed] [Google Scholar]
- 5.van Strien NM, Cappaert NLM & Witter MP The anatomy of memory: an interactive overview of the parahippocampal–hippocampal network. Nat. Rev. Neurosci 10, 272–282 (2009). [DOI] [PubMed] [Google Scholar]
- 6.Tamamaki N & Nojyo Y Preservation of topography in the connections between the subiculum, field CA1, and the entorhinal cortex in rats. J. Comp. Neurol 353, 379–390 (1995). [DOI] [PubMed] [Google Scholar]
- 7.Naber PA, Lopes Da Silva FH & Witter MP Reciprocal connections between the entorhinal cortex and hippocampal fields CA1 and the subiculum are in register with the projections from CA1 to the subiculum. Hippocampus 11, 99–104 (2001). [DOI] [PubMed] [Google Scholar]
- 8.Igarashi KM, Ito HT, Moser EI & Moser MB Functional diversity along the transverse axis of hippocampal area CA1. FEBS Lett. 588, 2470–2476 (2014). [DOI] [PubMed] [Google Scholar]
- 9.Cembrowski MS et al. Spatial Gene-Expression Gradients Underlie Prominent Heterogeneity of CA1 Pyramidal Neurons. Neuron 89, 351–368 (2016). [DOI] [PubMed] [Google Scholar]
- 10.Sperry RW Chemoaffinity in the orderly growth of nerve fiber patterns and connections. PNAS 50, 703–710 (1963). [DOI] [PMC free article] [PubMed] [Google Scholar]
- 11.Sanes JR & Yamagata M Many paths to synaptic specificity. Annu. Rev. Cell Dev. Biol 25, 161–195 (2009). [DOI] [PubMed] [Google Scholar]
- 12.Kolodkin AL & Tessier-Lavigne M in Cold Spring Harb. Perspect. Biol Vol. 3 1–14 (2011). [DOI] [PMC free article] [PubMed] [Google Scholar]
- 13.Hong W, Mosca TJ & Luo L Teneurins instruct synaptic partner matching in an olfactory map. Nature 484, 201–207 (2012). [DOI] [PMC free article] [PubMed] [Google Scholar]
- 14.Mosca TJ, Hong W, Dani VS, Favaloro V & Luo L Trans-synaptic Teneurin signalling in neuromuscular synapse organization and target choice. Nature 484, 237–241 (2012). [DOI] [PMC free article] [PubMed] [Google Scholar]
- 15.Tucker RP, Beckmann J, Leachman NT, Scholer J & Chiquet-Ehrismann R Phylogenetic Analysis of the Teneurins: Conserved Features and Premetazoan Ancestry. Mol. Biol. Evol 29, 1019–1029 (2012). [DOI] [PMC free article] [PubMed] [Google Scholar]
- 16.Li H, Bishop KM & O’Leary DDM Potential target genes of EMX2 include Odz/Ten-M and other gene families with implications for cortical patterning. Molecular and Cellular Neuroscience 33, 136–149 (2006). [DOI] [PubMed] [Google Scholar]
- 17.Psychiatric GWAS Consortium Bipolar Disorder Working Group. Large-scale genome-wide association analysis of bipolar disorder identifies a new susceptibility locus near ODZ4. Nat. Genet 43, 977–983 (2011). [DOI] [PMC free article] [PubMed] [Google Scholar]
- 18.Green EK et al. Replication of bipolar disorder susceptibility alleles and identification of two novel genome-wide significant associations in a new bipolar disorder case-control sample. Mol. Psychiatry 18, 1302–1307 (2013). [DOI] [PMC free article] [PubMed] [Google Scholar]
- 19.Muhleisen TW et al. Genome-wide association study reveals two new risk loci for bipolar disorder. Nature communications 5, 3339 (2014). [DOI] [PubMed] [Google Scholar]
- 20.Croarkin PE et al. Genetic Risk Score Analysis in Early-Onset Bipolar Disorder. J. Clin. Psychiatry (2017). [DOI] [PMC free article] [PubMed] [Google Scholar]
- 21.Ivorra JL et al. Replication of previous genome-wide association studies of psychiatric diseases in a large schizophrenia case-control sample from Spain. Schizophr. Res 159, 107–113 (2014). [DOI] [PubMed] [Google Scholar]
- 22.Aldahmesh MA, Mohammed JY, Al-Hazzaa S & Alkuraya FS Homozygous null mutation in ODZ3 causes microphthalmia in humans. Genet. Med 14, 900–904 (2012). [DOI] [PubMed] [Google Scholar]
- 23.Alkelai A et al. A role for TENM1 mutations in congenital general anosmia. Clin. Genet 90, 211–219 (2016). [DOI] [PubMed] [Google Scholar]
- 24.Leamey CA et al. Ten_m3 Regulates Eye-Specific Patterning in the Mammalian Visual Pathway and Is Required for Binocular Vision. PLoS Biol. 5, e241 (2007). [DOI] [PMC free article] [PubMed] [Google Scholar]
- 25.Dharmaratne N et al. Ten-m3 Is required for the development of topography in the ipsilateral retinocollicular pathway. PLoS One 7, e43083 (2012). [DOI] [PMC free article] [PubMed] [Google Scholar]
- 26.Antinucci P, Nikolaou N, Meyer MP & Hindges R Teneurin-3 specifies morphological and functional connectivity of retinal ganglion cells in the vertebrate visual system. Cell Reports 5, 582–592 (2013). [DOI] [PMC free article] [PubMed] [Google Scholar]
- 27.Antinucci P, Suleyman O, Monfries C & Hindges R Neural Mechanisms Generating Orientation Selectivity in the Retina. Curr. Biol 26, 1802–1815 (2016). [DOI] [PMC free article] [PubMed] [Google Scholar]
- 28.Rubin BP, Tucker RP, Brown-Luedi M, Martin D & Chiquet-Ehrismann R Teneurin 2 is expressed by the neurons of the thalamofugal visual system in situ and promotes homophilic cell-cell adhesion in vitro. Development 129, 4697–4705 (2002). [DOI] [PubMed] [Google Scholar]
- 29.Beckmann J, Schubert R, Chiquet-Ehrismann R & Muller DJ Deciphering teneurin domains that facilitate cellular recognition, cell-cell adhesion, and neurite outgrowth using atomic force microscopy-based single-cell force spectroscopy. Nano Letters 13, 2937–2946 (2013). [DOI] [PubMed] [Google Scholar]
- 30.Boucard AA, Maxeiner S & Sudhof TC Latrophilins function as heterophilic cell-adhesion molecules by binding to teneurins: Regulation by alternative splicing. J. Biol. Chem 289, 387–402 (2014). [DOI] [PMC free article] [PubMed] [Google Scholar]
- 31.Silva J-P et al. Latrophilin 1 and its endogenous ligand Lasso/teneurin-2 form a high-affinity transsynaptic receptor pair with signaling capabilities. PNAS 108, 12113–12118 (2011). [DOI] [PMC free article] [PubMed] [Google Scholar]
- 32.O’Sullivan ML et al. FLRT Proteins Are Endogenous Latrophilin Ligands and Regulate Excitatory Synapse Development. Neuron 73, 903–910 (2012). [DOI] [PMC free article] [PubMed] [Google Scholar]
- 33.Loh KH et al. Proteomic Analysis of Unbounded Cellular Compartments: Synaptic Clefts. Cell 166, 1295–1307 e1221 (2016). [DOI] [PMC free article] [PubMed] [Google Scholar]
- 34.Steward O Topographic organization of the projections from the entorhinal area to the hippocampal formation of the rat. The Journal of Comparative Neurology 167, 285–314 (1976). [DOI] [PubMed] [Google Scholar]
- 35.van Groen T, Miettinen P & Kadish I The entorhinal cortex of the mouse: Organization of the projection to the hippocampal formation. Hippocampus 13, 133–149 (2003). [DOI] [PubMed] [Google Scholar]
- 36.Muraoka D, Katsuyama Y, Kikkawa S & Terashima T Postnatal development of entorhinodentate projection of the reeler mutant mouse. Dev. Neurosci 29, 59–72 (2006). [DOI] [PubMed] [Google Scholar]
- 37.Tamamaki N & Nojyo Y Disposition of the slab-like modules formed by axon branches originating from single CA1 pyramidal neurons in the rat hippocampus. J. Comp. Neurol 291, 509–519 (1990). [DOI] [PubMed] [Google Scholar]
- 38.Amaral DG, Dolorfo C & Alvarez-Royo P Organization of CA1 projections to the subiculum: A PHA-L analysis in the rat. Hippocampus 1, 415–435 (1991). [DOI] [PubMed] [Google Scholar]
- 39.Honda Y & Ishizuka N Topographic distribution of cortical projection cells in the rat subiculum. Neurosci. Res 92, 1–20 (2015). [DOI] [PubMed] [Google Scholar]
- 40.Witter MP & Groenewegen HJ The subiculum: cytoarchitectonically a simple structure, but hodologically complex. Prog. Brain Res 83, 47–58 (1990). [DOI] [PubMed] [Google Scholar]
- 41.Gerfen CR & Sawchenko PE An anterograde neuroanatomical tracing method that shows the detailed morphology of neurons, their axons and terminals: Immunohistochemical localization of an axonally transported plant lectin, Phaseolus vulgaris leucoagglutinin (PHA-L). Brain Res. 290, 219–238 (1984). [DOI] [PMC free article] [PubMed] [Google Scholar]
- 42.Mosca TJ & Luo L Synaptic organization of the Drosophila antennal lobe and its regulation by the Teneurins. eLife 3, e03726 (2014). [DOI] [PMC free article] [PubMed] [Google Scholar]
- 43.Leamey C. a. et al. Differential Gene Expression between Sensory Neocortical Areas: Potential Roles for Ten_m3 and Bcl6 in Patterning Visual and Somatosensory Pathways. Cereb. Cortex 18, 53–66 (2008). [DOI] [PubMed] [Google Scholar]
- 44.Oohashi T et al. Mouse ten-m/Odz is a new family of dimeric type II transmembrane proteins expressed in many tissues. The Journal of Cell Biology 145, 563–577 (1999). [DOI] [PMC free article] [PubMed] [Google Scholar]
- 45.Ben-Zur T, Feige E, Motro B & Wides R The mammalian Odz gene family: homologs of a Drosophila pair-rule gene with expression implying distinct yet overlapping developmental roles. Dev. Biol 217, 107–120 (2000). [DOI] [PubMed] [Google Scholar]
- 46.O’Leary NA et al. Reference sequence (RefSeq) database at NCBI: current status, taxonomic expansion, and functional annotation. Nucleic Acids Res. 44, D733–745 (2016). [DOI] [PMC free article] [PubMed] [Google Scholar]
- 47.Luo L & Flanagan JG Development of continuous and discrete neural maps. Neuron 56, 284–300 (2007). [DOI] [PubMed] [Google Scholar]
- 48.Bonanomi D & Pfaff SL Motor axon pathfinding. Cold Spring Harb. Perspect. Biol 2, a001735 (2010). [DOI] [PMC free article] [PubMed] [Google Scholar]
- 49.Feng K et al. All Four Members of the Ten-m/Odz Family of Transmembrane Proteins Form Dimers. J. Biol. Chem 277, 26128–26135 (2002). [DOI] [PubMed] [Google Scholar]
- 50.Triplett JW et al. Competition is a driving force in topographic mapping. Proc. Natl. Acad. Sci. U. S. A 108, 19060–19065 (2011). [DOI] [PMC free article] [PubMed] [Google Scholar]
Additional References:
- 51.Witter M in The Mouse Nervous System p112–139 (Elsevier Inc, 2012). [Google Scholar]
- 52.Kohara K et al. Cell type-specific genetic and optogenetic tools reveal hippocampal CA2 circuits. Nat. Neurosci 17, 269–279 (2014). [DOI] [PMC free article] [PubMed] [Google Scholar]
- 53.Caballero-Bleda M & Witter MP Regional and laminar organization of projections from the presubiculum and parasubiculum to the entorhinal cortex: an anterograde tracing study in the rat. J. Comp. Neurol 328, 115–129 (1993). [DOI] [PubMed] [Google Scholar]
- 54.Honda Y & Ishizuka N Organization of Connectivity of the Rat Presubiculum: I. Efferent Projections to the Medial Entorhinal Cortex. J. Comp. Neurol 473, 463–484 (2004). [DOI] [PubMed] [Google Scholar]
- 55.O’Reilly KC, Gulden Dahl A, Ulsaker Kruge I & Witter MP Subicular-parahippocampal projections revisited: Development of a complex topography in the rat. J. Comp. Neurol 521, 4284–4299 (2013). [DOI] [PubMed] [Google Scholar]
- 56.Wright NF, Vann SD, Erichsen JT, O’Mara SM & Aggleton JP Segregation of parallel inputs to the anteromedial and anteroventral thalamic nuclei of the rat. J. Comp. Neurol 521, 2966–2986 (2013). [DOI] [PMC free article] [PubMed] [Google Scholar]
- 57.Meibach R & Siegel A Efferent connections of the hippocampal formation in the rat. Brain Res. 124, 197–224 (1977). [DOI] [PubMed] [Google Scholar]
- 58.Ishizuka N Laminar organization of the pyramidal cell layer of the subiculum in the rat. J. Comp. Neurol 435, 89–110 (2001). [DOI] [PubMed] [Google Scholar]
- 59.Wright NF, Erichsen JT, Vann SD, O’Mara SM & Aggleton JP Parallel but separate inputs from limbic cortices to the mammillary bodies and anterior thalamic nuclei in the rat. J. Comp. Neurol 518, 2334–2354 (2010). [DOI] [PMC free article] [PubMed] [Google Scholar]
- 60.Tasic B et al. Site-specific integrase-mediated transgenesis in mice via pronuclear injection. PNAS 108, 7902 (2011). [DOI] [PMC free article] [PubMed] [Google Scholar]
- 61.Weissbourd B et al. Presynaptic partners of dorsal raphe serotonergic and GABAergic neurons. Neuron 83, 645–662 (2014). [DOI] [PMC free article] [PubMed] [Google Scholar]
- 62.Beier KT et al. Circuit Architecture of VTA Dopamine Neurons Revealed by Systematic Input-Output Mapping. Cell 162, 622–634 (2015). [DOI] [PMC free article] [PubMed] [Google Scholar]
- 63.Lu YC et al. Structural Basis of Latrophilin-FLRT-UNC5 Interaction in Cell Adhesion. Structure 23, 1678–1691 (2015). [DOI] [PMC free article] [PubMed] [Google Scholar]
- 64.Sisino G, Bellavia D, Corallo M, Geraci F, & Barbieri R A homemade cytospin apparatus. Analytical Biochemistry 359, 283–284 (2006). [DOI] [PubMed] [Google Scholar]