

Abstract
The association between maternal serum total bile acid (TBA) levels and small-for-gestational-age (SGA) infants is unclear. We investigated the association between various degrees of serum TBA levels and the risk of SGA infants in a Chinese population. The current study performed a cohort study among 11811 mothers with singleton pregnancy. Subjects were divided into seven categories according to maternal serum TBA levels. Interestingly, birth sizes were reduced, whereas the rate of SGA infants was increased across increasing categories of serum TBA. Compared to category 1, adjusted ORs (95%CI) for SGA infants were 0.99 (0.82–1.21) in category 2, 1.22 (0.97–1.53) in category 3, 1.99 (1.53–2.58) in category 4, 2.91 (2.16–3.93) in category 5, 4.29 (3.33–5.54) in category 6, and 9.01 (5.99–13.53) in category 7, respectively. Furthermore, adjusted ORs (95%CI) for SGA infants for each 1-SD increase in serum TBA levels were 1.36 (1.29–1.43) among all subjects, 2.40 (1.82–3.45) among subjects without cholestasis, and 1.13 (1.06–1.22) among subjects with cholestasis, respectively. These results suggest that gestational cholestasis increases the risk of SGA infants. Additionally, our results indicate strong, continuous associations of serum TBA levels below those diagnostic of cholestasis with a decreased birth sizes and an increased risk of SGA infants.
Subject terms: Signs and symptoms, Risk factors
Introduction
Intrahepatic cholestasis of pregnancy (ICP), also named gestational cholestasis, is defined as the presence of pruritus in combination with elevated serum total bile acid (TBA) levels (≥10 μmol/L). ICP is one of the most prevalent obstetric disease1,2. ICP occurs usually in the second half of pregnancy until delivery. The incidence of ICP ranges from 0.4% to 15% in different countries, ethnic populations and climatic conditions3,4. The majority of studies had demonstrated that ICP was associated with adverse maternal outcomes, including 3-fold increased risks of gestational diabetes mellitus and pre-eclampsia5–7. A large cohort study from Sweden showed that women with ICP had increased risks of later liver and biliary tree cancer, later specifically diabetes mellitus, later autoimmune-mediated and cardiovascular diseases after childbirth8. On the other hand, several epidemiological studies reported the association between ICP and the increased risks of adverse fetal outcomes, including spontaneous and iatrogenic preterm delivery, a low (<7) 5-minute Apgar score, respiratory distress syndrome, meconium-stained fluid, stillbirth and intrauterine fetal death3,9–11. In addition, a report on human and rodent animal demonstrated that ICP was also associated with sex-specific increased susceptibility to severe obese, diabetic phenotype with hepatosteatosis in adult offspring, indicating a programming effect of the high bile acid exposure in utero12,13.
Small for gestational age (SGA), defined as fetal weight less than the 10th percentile based on gender and gestational age, is one of the leading causes for stillbirth, neonatal death and perinatal morbidity14–16. Several epidemiological reports showed that the risks of autism in childhood and cardiovascular and metabolic diseases in adulthood were increased in people born with SGA17–20. Nevertheless, no report analyzed the association between ICP and an increased risk of SGA infants in a cohort study. It is more obscure whether maternal serum TBA levels less severe than that in cholestasis are associated with an increased risk of SGA infants.
The present study conducted a birth cohort study to investigate the risk of SGA infants associated with various degrees of serum TBA levels. The present study found that ICP elevated the risk of SGA infants. Additionally, our results indicate strong, continuous associations of serum TBA levels below those diagnostic of cholestasis with a decreased birth sizes and an increased risk of SGA infants.
Results
The demographic characteristics and laboratory measurements of study participants
The demographic characteristics of study participants were presented in Table 1. There were significant differences on maternal age, education, and mode of delivery among different groups (Table 1). No significant differences were observed on maternal pre-pregnancy BMI, parity, and gravidity among different groups (Table 1). The incidence of preeclampsia was significantly lower in the TBA <10 μmol/L group than those in the other two groups (Table 1). No significant differences were observed on the incidence of pregnancy-induced hypertension and gestational diabetes mellitus among different groups (Table 1). Maternal serum alanine transaminase concentrations, aspartate transaminase concentrations, serum total bilirubin concentrations, direct bilirubin concentrations, and indirect bilirubin concentrations were measured. Results showed that those were increased across the increasing serum TBA levels categories (Table 2).
Table 1.
Characteristics of the study participants.
| Demographic variables | Serum TBA levels (μmol/L) | P-value | ||
|---|---|---|---|---|
| <10.0 (n = 11120) | 10.0–39.9 (n = 563) | ≥40.0 (n = 128) | ||
| Maternal age (years) | ||||
| <25 [n (%)] | 1636 (14.71) | 121 (21.49) | 37 (28.91) | <0.001 |
| 25–34 [n (%)] | 8227 (73.98) | 371 (65.90) | 71 (55.47) | |
| ≥35 [n (%)] | 1257 (11.30) | 71 (12.61) | 20 (15.63) | |
| Pre-pregnancy BMI (kg/m2) | ||||
| <18.5 [n (%)] | 1916 (17.23) | 113 (20.07) | 29 (22.66) | 0.159 |
| 18.5–22.9 [n (%)] | 6875 (61.83) | 328 (58.26) | 79 (61.72) | |
| 23.0–27.4 [n (%)] | 2003 (18.01) | 102 (18.12) | 15 (11.72) | |
| ≥27.5 [n (%)] | 326 (2.93) | 20 (3.55) | 5 (3.90) | |
| Maternal education (years) | ||||
| ≤9 (Junior school) | 3547 (31.72) | 288 (52.93) | 74 (57.81) | <0.001 |
| 10–15 (High school) | 3477 (31.09) | 155 (26.47) | 31 (24.22) | |
| ≥16 (University) | 3689 (32.99) | 111 (19.00) | 15 (11.72) | |
| Data missing | 407 (4.20) | 9 (1.60) | 8 (6.25) | |
| Mode of delivery [n (%)] | ||||
| Vaginal delivery | 6276 (56.44) | 342 (60.75) | 81 (63.28) | 0.042 |
| Cesarean delivery | 4844 (43.56) | 221 (39.25) | 47 (36.72) | |
| Parity [n(%)] | ||||
| 1 | 8288 (74.53) | 418 (74.25) | 89 (69.53) | 0.432 |
| ≥2 | 2832 (25.47) | 145 (25.75) | 39 (30.47) | |
| Gravidity | ||||
| 1 | 5931 (53.34) | 297 (52.75) | 61 (47.66) | 0.428 |
| ≥2 | 5189 (46.66) | 266 (47.25) | 67 (52.34) | |
| Gestational diabetes mellitus [n(%)] | ||||
| Yes | 917 (8.25) | 60 (10.66) | 12 (9.38) | 0.121 |
| No | 10203 (91.75) | 503 (89.34) | 116 (90.62) | |
| Gestational hypertension [n(%)] | ||||
| Yes | 359 (3.23) | 21 (3.73) | 8 (6.25) | 0.135 |
| No | 10761 (96.77) | 542 (96.27) | 120 (93.75) | |
| Preeclampsia [n(%)] | ||||
| Yes | 611 (5.49) | 77 (13.68) | 18 (14.06) | <0.001 |
| No | 10506 (94.51) | 489 (86.32) | 110 (85.94) | |
Abbreviation: TBA, total bile acid.
Table 2.
Laboratory measurements within the study participants.
| Parameter | Serum TBA levels (μmol/L) | ||||||
|---|---|---|---|---|---|---|---|
| <2.0 (n = 3196) | 2.0–3.9 (n = 4580) | 4.0–5.9 (n = 2075) | 6.0–7.9 (n = 835) | 8.0–9.9 (n = 434) | 10.0–39.9 (n = 563) | ≥40.0 (n = 128) | |
| Alanine transaminase (IU/L) | 13.7 ± 14.7 | 17.0 ± 27.5** | 21.1 ± 34.1** | 29.4 ± 49.9** | 34.4 ± 64.1** | 110.2 ± 152.6** | 189.3 ± 171.4** |
| Aspartate transaminase (IU/L) | 20.3 ± 13.2 | 21.8 ± 18.4 | 25.0 ± 31.2** | 30.1 ± 40.2** | 36.2 ± 65.1** | 93.2 ± 128.8** | 168.7 ± 167.0** |
| Total bilirubin (μmol/L) | 8.1 ± 3.4 | 8.1 ± 11.1 | 7.7 ± 3.8 | 8.0 ± 4.1 | 8.7 ± 4.7 | 12.6 ± 11.4** | 33.9 ± 68.7** |
| Direct bilirubin (μmol/L) | 1.7 ± 0.9 | 1.8 ± 1.9 | 2.0 ± 4.2 | 2.1 ± 1.9 | 2.5 ± 4.3* | 7.5 ± 5.2** | 24.4 ± 33.8** |
| Indirect bilirubin (μmol/L) | 6.7 ± 2.8 | 6.4 ± 2.9* | 6.3 ± 2.9* | 6.6 ± 3.3 | 6.5 ± 3.6 | 4.1 ± 5.8** | 9.5 ± 10.3** |
Abbreviation: TBA, total bile acid.
The mean differences between two groups were analyzed using least significant difference (LSD) post hoc test.
*P < 0.05, **P < 0.01 as compared with < 2.0μmol/L group.
Birth sizes among different groups
Subjects were divided into seven categories according to maternal serum TBA levels. Birth weight was compared among seven categories. As shown in Table 3, birth sizes, including birth weight, birth length, head circumference and chest circumference, were decreased across increasing categories of serum TBA levels. Gestational age was also compared among seven categories. Gestational age was reduced across increasing categories of serum TBA levels (Table 3).
Table 3.
Birth sizes and gestational age in different categories.
| Parameter | Maternal serum TBA levels (μmol/L) | ||||||
|---|---|---|---|---|---|---|---|
| <2.0 (n = 3196) | 2.0–3.9 (n = 4580) | 4.0–5.9 (n = 2075) | 6.0–7.9 (n = 834) | 8.0–9.9 (n = 434) | 10.0–39.9 (n = 563) | ≥40.0 (n = 128) | |
| Birth weight (g) | |||||||
| Mean ± SDa | 3288.5 ± 652.5 | 3213.3 ± 563.7** | 3186.7 ± 602.0** | 2966.2 ± 650.7** | 2776.6 ± 755.0** | 2847.6 ± 704.4** | 2575.1 ± 685.8** |
| Median (25th, 75th)b | 3310 (3000, 3700) | 3300 (3000, 3550)** | 3250 (2950, 3550)** | 3000 (2650, 3400)** | 2900 (2280, 3350) | 2900 (2450, 3350)** | 2550 (2100, 3000)** |
| Birth length (cm) | |||||||
| Mean ± SDa | 50.1 ± 3.3 | 49.9 ± 3.1** | 49.8 ± 3.1** | 48.9 ± 3.5** | 47.9 ± 4.5** | 48.3 ± 4.0** | 47.1 ± 4.0** |
| Median (25th, 75th)b | 50.0 (49.0, 52.0) | 50.0 (49.0, 52.0)** | 50.0 (49.0, 51.0)** | 50.0 (48.0, 51.0)** | 49.0 (46.0, 51.0) | 49.0 (47.0, 51.0)** | 48.0 (45.3, 50.0)** |
| Head circumference (cm) | |||||||
| Mean ± SDa | 33.7 ± 2.3 | 33.4 ± 2.0** | 33.5 ± 2.2** | 32.9 ± 2.4** | 32.5 ± 2.7** | 32.3 ± 2.5** | 31.5 ± 2.8** |
| Median (25th, 75th)b | 34.0 (32.0, 35.0) | 34.0 (32.0, 35.0)** | 34.0 (32.0, 35.0)** | 33.0 (32.0, 34.0)** | 33.0 (31.0, 34.0) | 33.0 (31.0, 34.0)** | 32.0 (30.0, 33.0)** |
| Chest circumference (cm) | |||||||
| Mean ± SDa | 33.5 ± 2.6 | 33.1 ± 2.3** | 33.1 ± 2.4** | 32.3 ± 2.7** | 31.8 ± 3.3** | 31.8 ± 2.9** | 31.0 ± 2.9** |
| Median (25th, 75th)b | 34.0 (32.0, 35.0) | 33.0 (32.0, 34.0)** | 33.0 (32.0, 34.0)** | 33.0 (31.0, 34.0)** | 32.0 (30.0, 34.0) | 32.0 (30.0, 34.0)** | 31.0 (29.0, 33.0)** |
| Gestational age (wks) | |||||||
| Mean ± SDa | 38.9 + 2.3 | 39.0 + 2.4 | 38.8 + 2.5 | 38.2 + 2.6** | 37.6 + 3.1** | 37.8 + 2.7** | 36.6 + 2.7** |
| Median (25th, 75th)b | 39.4 (38.4, 40.3) | 39.4 (38.4, 40.3) | 39.3 (38.3, 40.3) | 38.9 (37.1, 40.0)** | 38.4 (35.8, 39.9)** | 38.3 (36.7, 39.6)** | 37.0 (35.1, 38.3)** |
Abbreviation: TBA, total bile acid; SD, standard deviation.
aThe mean differences between two groups were analyzed using least significant difference (LSD) post hoc test.
bThe median differences were analyzed using non-parametric statistics.
**P < 0.01 as compared with < 2.0μmol/L group.
Association between serum TBA as a categorical variable and the risk of SGA infants
Participants were divided into seven categories according to maternal serum TBA levels. The rate of SGA infants across serum TBA levels categories is shown in Fig. 1. With increasing categories of maternal serum TBA levels, the rate of SGA infants was increased (Fig. 1). Table 4 shows the associations of maternal serum TBA levels as a categorical variable with each primary outcome, including odds ratios (ORs) and 95% confidence intervals (95%CIs) for each category, as compared with the lowest category. After adjustment for confounders, there were strong associations with SGA infants that increased across increasing categories of serum TBA levels. Additionally, there were no obvious thresholds at which risk increased (Table 4).
Figure 1.
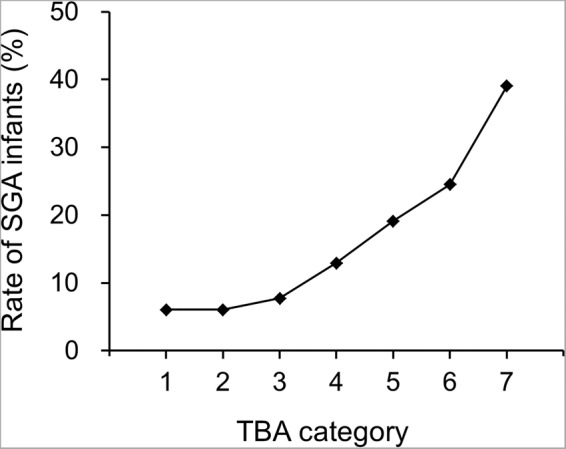
Rate of SGA infants. Serum TBA categories are as follows: category 1, less than 2.0 μmol/L; category 2, 2.0 to 3.9 μmol/L; category 3, 4.0 to 5.9 μmol/L; category 4, 6.0 to 7.9 μmol/L; category 5, 8.0 to 9.9 μmol/L; category 6, 10.0 to 39.9 μmol/L; category 7, 40 μmol/L or more. SGA, small for gestational age; TBA, total bile acid.
Table 4.
Crude and adjusted ORs for the associations between serum TBA as a categorical variable and SGA infants.
| Parameter | Pregnant women (n) | SGA (n) | Crude OR (95% CI) | Adjusted OR (95% CI) a | Adjusted OR (95% CI) b |
|---|---|---|---|---|---|
| Serum TBA levels (μmol/L) | |||||
| <2.0 | 3196 | 193 | 1.00 | 1.00 | 1.00 |
| 2.0–3.9 | 4580 | 278 | 1.01 (0.83, 1.22) | 1.02 (0.85, 1.24) | 0.99 (0.82, 1.21) |
| 4.0–5.9 | 2075 | 160 | 1.30 (1.05, 1.62)* | 1.31 (1.06, 1.63)* | 1.22 (0.97, 1.53) |
| 6.0–7.9 | 835 | 108 | 2.31 (1.80, 2.97)** | 2.32 (1.81, 2.97)** | 1.99 (1.53, 2.58)** |
| 8.0–9.9 | 434 | 83 | 3.68 (2.78, 4.87)** | 3.64 (2.75, 4.82)** | 2.91 (2.16, 3.93)** |
| 10.0–39.9 | 563 | 138 | 5.05 (3.97, 6.43)** | 5.10 (4.00, 6.49)** | 4.29 (3.33, 5.54)** |
| ≥40.0 | 128 | 50 | 9.98 (6.80, 14.64)** | 9.90 (6.74, 14.55)** | 9.01 (5.99, 13.53)** |
Abbreviation: TBA, total bile acid; SGA, small for gestational age; OR, odds ratio.
aAdjustment for gestational hypertension.
bAdjustment for maternal age, pre-pregnancy BMI, maternal education, parity, gestational diabetes mellitus, gestational hypertension and preeclampsia.
**P < 0.01 as compared with < 2.0 μmol/L group.
Association between serum TBA as a continuous variable and the risk of SGA infants and birth sizes
Table 5 shows the association between serum TBA as a continuous variable and the risk of SGA infants. Adjusted ORs for SAG infants for each 1-SD increase in serum TBA level were 1.36 (95%CI: 1.29, 1.43) among all subjects, 2.40 (95%CI: 1.82, 3.45) among subjects without cholestasis (TBA <10.0 μmol/L), and 1.13 (95%CI: 1.06, 1.22) among subjects with cholestasis (TBA ≥10.0 μmol/L), respectively (Table 5).
Table 5.
Association between serum TBA as a continuous variable and the risk of SGA infants.
| Parameter | Crude models | Adjusted modelsb | Adjusted modelsc | |||
|---|---|---|---|---|---|---|
| OR (95%CI)a | p | OR (95%CI) | p | OR (95%CI) | p | |
| TBA categoryd | ||||||
| All | 1.37 (1.31, 1.43) | <0.001 | 1.37 (1.31, 1.43) | <0.001 | 1.36 (1.29, 1.43) | <0.001 |
| <10.0 μmol/L | 3.41 (2.68, 4.34) | <0.001 | 3.36 (2.64, 4.28) | <0.001 | 2.40 (1.82, 3.45) | <0.001 |
| ≥10.0 μmol/L | 1.10 (1.04, 1.16) | 0.001 | 1.10 (1.04, 1.16) | 0.001 | 1.13 (1.06, 1.22) | 0.001 |
Abbreviation: TBA, total bile acid; SGA, small for gestational age; OR, odds ratio.
aORs were for an increase in serum TBA level of 1 SD
bAdjustment for gestational hypertension.
cAdjustment for maternal age, BMI, parity, maternal education, gestational diabetes mellitus, gestational hypertension and preeclampsia.
Discussion
The aim of the present study was to clarify the risk of SGA infants associated with various degrees of serum TBA levels, especially less severe than that in overt cholestasis in a birth cohort study. The present study found that birth sizes, including birth weight, birth length, head circumference and chest circumference, were decreased across increasing categories of serum TBA levels. The association between serum TBA and the risk of SGA infants was analyzed. After adjustment for confounders, there were strongly associations with SGA infants that increased across the increasing serum TBA levels categories.
Maternal demographic characteristics, such as maternal age, pre-pregnancy BMI, parity and maternal education, were associated with birth weight and the risk of SGA infants. A number of epidemiological studies demonstrated that advanced maternal age, primiparity and low BMI before pregnancy elevated the risks of SGA and low birth weight infants21–23. Several reports indicated that the risk of SGA was higher in low educational subjects compared with high educational subjects24,25. On the other hand, pregnancy complications, such as gestational diabetes mellitus, gestational hypertension and pre-eclampsia, were also associated with birth weight and the risk of SGA. Several reports showed that gestational hypertension and pre-eclampsia elevated the risk of SGA infants26,27. In contrast, gestational diabetes mellitus was significantly associated with higher birth weight and 2-fold increased risk of large for gestational age (LGA) infants and macrosomia28,29. The present study further estimated the adjusted ORs with 95%CI with respect to the incidence of SGA infants using multiple logistic regression models. After adjustment for these confounders, our results still found that the risk of SGA infants was increased across the increasing serum TBA levels categories.
The mechanism by which elevated serum TBA increases the risk of SGA remains obscure. Several case-control studies showed that the levels of proinflammatory cytokines and chemokines in placenta and maternal serum were significantly higher in the cholestasis group as compared to the control group30,31. Reports in vivo and in vitro found that bile acids stimulated the expression of a series of inflammatory cytokines and reactive oxygen species via activating both signal 1 and 2 of the NLRP3 inflammasome and NF-κB pathway32–34. These studies indicated that cholestasis was associated with inflammation and oxidative stress. Indeed, many epidemiological studies showed that maternal serum and umbilical cord serum TNF-α, C-reactive protein and IL-8 levels were significantly higher in the SGA group than in the control group35,36. According to a recent nest case-control study, strongly nuclear NF-κB p65 immunoreactivity was observed in placentas from pregnant women with SGA infants37. Animal experiments also found that maternal inflammation and oxidative stress resulted in FGR in rodents38,39. Therefore, we guess that inflammation and oxidative stress may play a vital role in TBA-mediated SGA. On the other hand, recent evidence suggested that the deficiency or downregulation of selective miRNA may be involved in placental-induced diseases, such as pre-eclampsia and fetal growth restriction, through the epigenetic mechanism40–42. Indeed, several studies found that bile acid, such as deoxycholic acid, inhibited miRNA expression in cell lines43,44. Consequently, we speculate downregulation of miRNA in placentas may be play a key role in TBA-mediated SGA. Moreover, a recent study reported that maternal serum TBA levels at diagnosis and at delivery were correlated positively with umbilical cord blood TBA levels, which provides evidence that bile acids could transport across the placenta45. Recently, numerous reports found that bile acids induced oncosis, necrotic cell death and apoptosis46,47. Thus, the present study does not exclude that elevated TBA-associated SGA is due to the direct toxic effect of bile acids.
The present study laid emphasis on whether serum TBA levels less severe than that in cholestasis was associated with an increased risk of SGA infants. However, the present study has three faults. Firstly, the nutritional status, drinking and smoking during pregnancy could affect fetal growth, but we did not have data on the variable. Secondly, the present cohort included only Chinese population, so our results should be treated cautiously when branched out to other ethnic populations. Another potential fault is the lack of information on treatment to pregnant women with cholestasis. Although previous reports demonstrated that treatment with ursodeoxycholic acid, a common drug for treating cholestasis during pregnancy, did not reduce adverse perinatal outcomes in pregnant women with ICP, it was associated with the reduction of serum TBA levels in ICP patients48,49.
In summary, the present study investigated the risk of SGA infants associated with various degrees of serum TBA levels in a large birth cohort study. The present study demonstrated that birth sizes were decreased across increasing categories of serum TBA levels. Further analysis found that ICP elevated the risk of SGA infants. Additionally, our results indicate strong, continuous associations of serum TBA levels below those diagnostic of cholestasis with a decreased birth sizes and an increased risk of SGA infants. There were no obvious thresholds at which risk increased. Thus, our study suggests the need to reconsider current criteria for diagnosing and treating ICP.
Subjects and Methods
Cohort study
We conducted a retrospective birth cohort in Hefei, a city of central China21. Total 13801 pregnant women who delivered at First Affiliated Hospital of Anhui Medical University between January 2011 and December 2014 were recruited. Maternal demographic characteristics and obstetric records were recorded by midwives on the Birthing Outcomes System and all data included in the study was extracted from this database. Maternal nonfasting blood samples were obtained before labor. The exclusion criteria of the current study included the following: unavailable data of detailed delivery records (n = 897), fetal deaths or stillbirths (n = 270), pregnant women giving birth to multiple births (n = 294), induced-abortions (n = 147) and unavailable serum TBA data (n = 382). Finally, 11811 (85.6%) mothers with singleton pregnancy were eligible for this study. The present study obtained ethics approval from the ethics committee of Anhui Medical University (No. 20160010). All participants signed a written informed consent for this study. All methods were carried out in accordance with the approved guidelines.
Measurement of serum TBA
Serum TBA levels were measured using enzymatic cycling method by an automatic biochemical analyzer (Dirui CS-T300, Ltd, Changchun, China) according to a previous protocol50.
Definition of small-for-gestational age
The cutoff value used for defining the small-for-gestational age (SGA) is birth weight of live-born infants below the 10th percentile for gender and gestational age from a reference population for Chinese51.
Statistical analysis
SPSS 17.0 was used to analysis the data. The mean differences were analyzed using one-way ANOVA and least significant difference (LSD) post hoc test. Categorical variables were analyzed using χ2 tests. The median differences were analyzed using non-parametric statistics (Mann-Whitney U test). The incidence and odds ratio (OR) of SGA infants were calculated in different groups. Multiple logistic regression models were used to estimate the risks of SGA infants in relation to lowest TBA category by crude and adjusted ORs with 95% confidence intervals (95% CI). Linear regression was used to explore the association between serum TBA levels and birth sizes. A p-value of <0.05 (two-tailed) or a 95%CI not including 1 and 0 (for relative risk) was considered statistically significant.
Acknowledgements
The authors thank Prof. Guiying Nie (from Hudson Institute of Medical Research, Australia) for assistance in reviewing the data and revising the manuscript. This study was supported by National Natural Science Foundation of China (81471467, 81630084, 81671471, 81801477), National College Students’ Innovation and Entrepreneurship Training Program (201910366007), and Key projects of Anhui provincial natural science research in colleges and universities (KJ2019A0224).
Author contributions
Y.H.C. designed research; L.L., W.C., L.M., Z.B.L., X.L., X.X.G., Y.L., H.W., M.Z. and Y.H.C. conducted research. L.L., X.L.L. and L.C. provided obstetric expertise. Y.H.C., L.L. and W.C. analyzed data and performed statistical analysis; Y.H.C. wrote paper; Y.H.C. and D.X.X. had primary responsibility for final content. All authors reviewed the manuscript.
Competing interests
The authors declare no competing interests.
Footnotes
Publisher’s note Springer Nature remains neutral with regard to jurisdictional claims in published maps and institutional affiliations.
These authors contributed equally: Li Li and Wei Chen.
Contributor Information
De Xiang Xu, Email: xudex@126.com.
Yuan Hua Chen, Email: yuanhuach@126.com.
References
- 1.Williamson C, Geenes V. Intrahepatic cholestasis of pregnancy. Obstet. Gynecol. 2014;124:120–133. doi: 10.1097/AOG.0000000000000346. [DOI] [PubMed] [Google Scholar]
- 2.Joshi D, James A, Quaglia A, Westbrook RH, Heneghan MA. Liver disease in pregnancy. Lancet. 2010;375:594–605. doi: 10.1016/S0140-6736(09)61495-1. [DOI] [PubMed] [Google Scholar]
- 3.Lammert F, Marschall HU, Glantz A, Matern S. Intrahepatic cholestasis of pregnancy: molecular pathogenesis, diagnosis and management. J. Hepatol. 2000;33:1012–1021. doi: 10.1016/s0168-8278(00)80139-7. [DOI] [PubMed] [Google Scholar]
- 4.Geenes V, Williamson C. Intrahepatic cholestasis of pregnancy. World. J. Gastroenterol. 2009;15:2049–2066. doi: 10.3748/wjg.15.2049. [DOI] [PMC free article] [PubMed] [Google Scholar]
- 5.Wikström-Shemer E, Marschall HU, Ludvigsson JF, Stephansson O. Intrahepatic cholestasis of pregnancy and associated adverse pregnancy and fetal outcomes: a 12-year population-based cohort study. BJOG. 2013;120:717–723. doi: 10.1111/1471-0528.12174. [DOI] [PubMed] [Google Scholar]
- 6.McIlvride S, Dixon PH, Williamson C. Bile acids and gestation. Mol. Aspects. Med. 2017;56:90–100. doi: 10.1016/j.mam.2017.05.003. [DOI] [PubMed] [Google Scholar]
- 7.Rezai S, Lora I, Henderson CE. Severe intrahepatic cholestasis of pregnancy is a risk factor for preeclampsia in singleton and twin pregnancies. Am. J. Obstet. Gynecol. 2015;213:395.e1–8. doi: 10.1016/j.ajog.2015.08.007. [DOI] [PubMed] [Google Scholar]
- 8.Wikström Shemer EA, et al. Intrahepatic cholestasis of pregnancy and cancer, immune-mediated and cardiovascular diseases: A population-based cohort study. J. Hepatol. 2015;63:456–461. doi: 10.1016/j.jhep.2015.03.010. [DOI] [PubMed] [Google Scholar]
- 9.Geenes V, et al. Association of severe intrahepatic cholestasis of pregnancy with adverse pregnancy outcomes: a prospective population-based case-control study. Hepatology. 2014;59:1482–1491. doi: 10.1002/hep.26617. [DOI] [PMC free article] [PubMed] [Google Scholar]
- 10.Herrera CA, et al. Perinatal outcomes associated with intrahepatic cholestasis of pregnancy. J. Matern. Fetal Neonatal Med. 2018;31:1913–1920. doi: 10.1080/14767058.2017.1332036. [DOI] [PubMed] [Google Scholar]
- 11.Puljic A, et al. The risk of infant and fetal death by each additional week of expectant management in intrahepatic cholestasis of pregnancy by gestational age. Am. J. Obstet. Gynecol. 2015;212:667.e1–5. doi: 10.1016/j.ajog.2015.02.012. [DOI] [PubMed] [Google Scholar]
- 12.Papacleovoulou G, et al. Maternal cholestasis during pregnancy programs metabolic disease in offspring. J. Clin. Invest. 2013;123:3172–3181. doi: 10.1172/JCI68927. [DOI] [PMC free article] [PubMed] [Google Scholar]
- 13.Desai M, Ross MG. Reproductive endocrinology: maternal cholestasis and offspring metabolic abnormalities. Nat. Rev. Endocrinol. 2013;9:567–568. doi: 10.1038/nrendo.2013.165. [DOI] [PMC free article] [PubMed] [Google Scholar]
- 14.Blue NR, et al. A Comparison of Methods for the Diagnosis of Fetal Growth Restriction Between the Royal College of Obstetricians and Gynaecologists and the American College of Obstetricians and Gynecologists. Obstet. Gynecol. 2018;131:835–841. doi: 10.1097/AOG.0000000000002564. [DOI] [PubMed] [Google Scholar]
- 15.Ray JG, Park AL, Fell DB. Mortality in Infants Affected by Preterm Birth and Severe Small-for-Gestational Age Birth Weight. Pediatrics. 2017;140:e20171881. doi: 10.1542/peds.2017-1881. [DOI] [PubMed] [Google Scholar]
- 16.Yao F, Miao H, Li B, Wu Y, Zhao Q. New birthweight percentiles by sex and gestational age in Southern China and its comparison with the INTERGROWTH-21st Standard. Sci. Rep. 2018;8:7567. doi: 10.1038/s41598-018-25744-7. [DOI] [PMC free article] [PubMed] [Google Scholar]
- 17.Moore GS, Kneitel AW, Walker CK, Gilbert WM, Xing G. Autism risk in small- and large-for-gestational-age infants. Am. J. Obstet. Gynecol. 2012;206:314.e1–9. doi: 10.1016/j.ajog.2012.01.044. [DOI] [PMC free article] [PubMed] [Google Scholar]
- 18.Brøns C, Saltbæk PN, Friedrichsen M, Chen Y, Vaag A. Endocrine and metabolic diurnal rhythms in young adult men born small vs appropriate for gestational age. Eur. J. Endocrinol. 2016;175:29–40. doi: 10.1530/EJE-16-0177. [DOI] [PubMed] [Google Scholar]
- 19.Crispi F, et al. Cardiovascular programming in children born small for gestational age and relationship with prenatal signs of severity. Am. J. Obstet. Gynecol. 2012;207:121.e1–9. doi: 10.1016/j.ajog.2012.05.011. [DOI] [PubMed] [Google Scholar]
- 20.Glantz A, Marschall HU, Mattsson LA. Intrahepatic cholestasis of pregnancy: Relationships between bile acid levels and fetal complication rates. Hepatology. 2004;40:467–474. doi: 10.1002/hep.20336. [DOI] [PubMed] [Google Scholar]
- 21.Chen YH, et al. Pre-pregnancy underweight and obesity are positively associated with small-for-gestational-age infants in a Chinese population. Sci. Rep. 2019;9:15544. doi: 10.1038/s41598-019-52018-7. [DOI] [PMC free article] [PubMed] [Google Scholar]
- 22.Dzakpasu S, et al. Contribution of prepregnancy body mass index and gestational weight gain to adverse neonatal outcomes: population attributable fractions for Canada. BMC. Pregnancy Childbirth. 2015;15:21. doi: 10.1186/s12884-015-0452-0. [DOI] [PMC free article] [PubMed] [Google Scholar]
- 23.Kim SS, et al. Obstetric and Neonatal Risks Among Obese Women Without Chronic Disease. Obstet. Gynecol. 2016;128:104–112. doi: 10.1097/AOG.0000000000001465. [DOI] [PMC free article] [PubMed] [Google Scholar]
- 24.Fujiwara T, Ito J, Kawachi I. Income inequality, parental socioeconomic status, and birth outcomes in Japan. Am. J. Epidemiol. 2013;177:1042–1052. doi: 10.1093/aje/kws355. [DOI] [PubMed] [Google Scholar]
- 25.Tamura N, et al. Different Risk Factors for Very Low Birth Weight, Term-Small-for-Gestational-Age, or Preterm Birth in Japan. Int. J. Environ. Res. Public Health. 2018;15:369. doi: 10.3390/ijerph15020369. [DOI] [PMC free article] [PubMed] [Google Scholar]
- 26.Panaitescu AM, et al. Chronic hypertension and adverse pregnancy outcome: a cohort study. Ultrasound Obstet. Gynecol. 2017;50:228–235. doi: 10.1002/uog.17493. [DOI] [PubMed] [Google Scholar]
- 27.Hung TH, Hsieh TT, Chen SF. Risk of abnormal fetal growth in women with early- and late-onset preeclampsia. Pregnancy Hypertens. 2018;12:201–206. doi: 10.1016/j.preghy.2017.09.003. [DOI] [PubMed] [Google Scholar]
- 28.Martino. J, et al. Maternal Body Weight and Gestational Diabetes Differentially Influence Placental and Pregnancy Outcomes. J. Clin. Endocrinol. Metab. 2016;101:59–68. doi: 10.1210/jc.2015-2590. [DOI] [PMC free article] [PubMed] [Google Scholar]
- 29.Lekva T, et al. Prediction of Gestational Diabetes Mellitus and Pre-diabetes 5 Years Postpartum using 75 g Oral Glucose Tolerance Test at 14-16 Weeks’ Gestation. Sci. Rep. 2018;8:13392. doi: 10.1038/s41598-018-31614-z. [DOI] [PMC free article] [PubMed] [Google Scholar]
- 30.Shao Y, Chen J, Zheng J, Liu CR. Effect of Histone Deacetylase HDAC3 on Cytokines IL-18, IL-12 and TNF-α in Patients with Intrahepatic Cholestasis of Pregnancy. Cell. Physiol. Biochem. 2017;42:1294–1302. doi: 10.1159/000478958. [DOI] [PubMed] [Google Scholar]
- 31.Biberoglu E, et al. Role of inflammation in intrahepatic cholestasis of pregnancy. J. Obstet. Gynaecol. Res. 2016;42:252–257. doi: 10.1111/jog.12902. [DOI] [PubMed] [Google Scholar]
- 32.Hao H, et al. Farnesoid X Receptor Regulation of the NLRP3 Inflammasome Underlies Cholestasis-Associated Sepsis. Cell Metab. 2017;25:856–867.e5. doi: 10.1016/j.cmet.2017.03.007. [DOI] [PMC free article] [PubMed] [Google Scholar]
- 33.Li M, Cai SY, Boyer JL. Mechanisms of bile acid mediated inflammation in the liver. Mol. Aspects Med. 2017;56:45–53. doi: 10.1016/j.mam.2017.06.001. [DOI] [PMC free article] [PubMed] [Google Scholar]
- 34.Chen W, et al. Obeticholic Acid Protects against Gestational Cholestasis-Induced Fetal Intrauterine Growth Restriction in Mice. Oxid. Med. Cell. Longev. 2019;2019:7419249. doi: 10.1155/2019/7419249. [DOI] [PMC free article] [PubMed] [Google Scholar]
- 35.Tosun M, et al. Maternal and umbilical serum levels of interleukin-6, interleukin-8, and tumor necrosis factor-alpha in normal pregnancies and in pregnancies complicated by preeclampsia. J. Matern. Fetal Neonatal Med. 2010;23:880–886. doi: 10.3109/14767051003774942. [DOI] [PubMed] [Google Scholar]
- 36.Amarilyo G, et al. Increased cord serum inflammatory markers in small-for-gestational-age neonates. J. Perinatol. 2011;31:30–32. doi: 10.1038/jp.2010.53. [DOI] [PubMed] [Google Scholar]
- 37.Wang H, et al. Maternal zinc deficiency during pregnancy elevates the risks of fetal growth restriction: a population-based birth cohort study. Sci. Rep. 2015;5:11262. doi: 10.1038/srep11262. [DOI] [PMC free article] [PubMed] [Google Scholar]
- 38.Chen YH, et al. Obeticholic Acid Protects against Lipopolysaccharide-Induced Fetal Death and Intrauterine Growth Restriction through Its Anti-Inflammatory Activity. J. Immunol. 2016;197:4762–4770. doi: 10.4049/jimmunol.1601331. [DOI] [PubMed] [Google Scholar]
- 39.Chen YH, et al. Vitamin D3 inhibits lipopolysaccharide-induced placental inflammation through reinforcing interaction between vitamin D receptor and nuclear factor kappa B p65 subunit. Sci. Rep. 2015;5:10871. doi: 10.1038/srep10871. [DOI] [PMC free article] [PubMed] [Google Scholar]
- 40.Chiofalo B, et al. Do miRNAs Play a Role in Fetal Growth Restriction? A Fresh Look to a Busy Corner. Biomed. Res. Int. 2017;2017:6073167. doi: 10.1155/2017/6073167. [DOI] [PMC free article] [PubMed] [Google Scholar]
- 41.Laganà AS, et al. miRNA expression for early diagnosis of preeclampsia onset: hope or hype? J. Matern. Fetal Neonatal Med. 2018;6:817–821. doi: 10.1080/14767058.2017.1296426. [DOI] [PubMed] [Google Scholar]
- 42.Balaguer N, et al. MicroRNA-30d deficiency during preconception affects endometrial receptivity by decreasing implantation rates and impairing fetal growth. Am. J. Obstet. Gynecol. 2019;221:46.e1–46.e16. doi: 10.1016/j.ajog.2019.02.047. [DOI] [PubMed] [Google Scholar]
- 43.Rodrigues PM, et al. Inhibition of NF-κB by deoxycholic acid induces miR-21/PDCD4-dependent hepatocellular apoptosis. Sci. Rep. 2015;5:17528. doi: 10.1038/srep17528. [DOI] [PMC free article] [PubMed] [Google Scholar]
- 44.Krattinger R, et al. Chenodeoxycholic acid significantly impacts the expression of miRNAs and genes involved in lipid, bile acid and drug metabolism in human hepatocytes. Life Sci. 2016;156:47–56. doi: 10.1016/j.lfs.2016.04.037. [DOI] [PubMed] [Google Scholar]
- 45.Brouwers L, et al. Intrahepatic cholestasis of pregnancy: maternal and fetal outcomes associated with elevated bile acid levels. Am. J. Obstet. Gynecol. 2015;212:100.e1–7. doi: 10.1016/j.ajog.2014.07.026. [DOI] [PubMed] [Google Scholar]
- 46.Gonzalez-Sanchez E, et al. Protective role of biliverdin against bile acid-induced oxidative stress in liver cells. Free Radic. Biol. Med. 2016;97:466–477. doi: 10.1016/j.freeradbiomed.2016.06.016. [DOI] [PubMed] [Google Scholar]
- 47.Hohenester S, et al. Physiological hypoxia prevents bile salt-induced apoptosis in human and rat hepatocytes. Liver. Int. 2014;34:1224–1231. doi: 10.1111/liv.12368. [DOI] [PubMed] [Google Scholar]
- 48.Chappell LC, et al. Ursodeoxycholic acid versus placebo in women with intrahepatic cholestasis of pregnancy (PITCHES): a randomised controlled trial. Lancet. 2019;394:849–860. doi: 10.1016/S0140-6736(19)31270-X. [DOI] [PMC free article] [PubMed] [Google Scholar]
- 49.Grymowicz M, Czajkowski K, Smolarczyk R. Pregnancy course in patients with intrahepatic cholestasis of pregnancy treated with very low doses of ursodeoxycholic acid. Scand. J. Gastroenterol. 2016;51:78–85. doi: 10.3109/00365521.2015.1064990. [DOI] [PubMed] [Google Scholar]
- 50.Tian G, et al. A novel electrochemical biosensor for ultrasensitive detection of serum total bile acids based on enzymatic reaction combined with the double oxidation circular amplification strategy. Biosens. Bioelectron. 2018;118:31–35. doi: 10.1016/j.bios.2018.07.030. [DOI] [PubMed] [Google Scholar]
- 51.Dai L, et al. Birth weight reference percentiles for Chinese. PLoS. One. 2014;9:e104779. doi: 10.1371/journal.pone.0104779. [DOI] [PMC free article] [PubMed] [Google Scholar]