

Abstract
Objective
All respiratory care represents some risk of becoming an aerosol‐generating procedure (AGP) during COVID‐19 patient management. Personal protective equipment (PPE) and environmental control/engineering is advised. High velocity nasal insufflation (HVNI) and high flow nasal cannula (HFNC) deliver high flow oxygen (HFO) therapy, established as a competent means of supporting oxygenation for acute respiratory distress patients, including that precipitated by COVID‐19. Although unlikely to present a disproportionate particle dispersal risk, AGP from HFO continues to be a concern. Previously, we published a preliminary model. Here, we present a subsequent highresolution simulation (higher complexity/reliability) to provide a more accurate and precise particle characterization on the effect of surgical masks on patients during HVNI, low‐flow oxygen therapy (LFO2), and tidal breathing.
Methods
This in silico modeling study of HVNI, LFO2, and tidal breathing presents ANSYS fluent computational fluid dynamics simulations that evaluate the effect of Type I surgical mask use over patient face on particle/droplet behavior.
Results
This in silico modeling simulation study of HVNI (40 L min−1) with a simulated surgical mask suggests 88.8% capture of exhaled particulate mass in the mask, compared to 77.4% in LFO2 (6 L min−1) capture, with particle distribution escaping to the room (> 1 m from face) lower for HVNI+Mask versus LFO2+Mask (8.23% vs 17.2%). The overwhelming proportion of particulate escape was associated with mask‐fit designed model gaps. Particle dispersion was associated with lower velocity.
Conclusions
These simulations suggest employing a surgical mask over the HVNI interface may be useful in reduction of particulate mass distribution associated with AGPs.
Keywords: aerosol‐generating procedures, exhalation, high flow nasal cannula, high flow oxygen, high velocity nasal insufflation, low flow oxygen, masks, particle dispersion/transmission, patient simulation, prevention/control
1. INTRODUCTION
COVID‐19, the clinical disease related to infection with the SARS‐CoV‐2 coronavirus (COVID‐19) represents a major world‐wide health risk. It is associated with varying degrees of respiratory distress, hypoxemia, and failure. Management of the oxygenation of these patients has been the topic of much discussion, receiving current guidance from numerous international and national agencies and organizations. 1 , 2 , 3 , 4 These guidance documents all include the use of high flow oxygen (HFO) therapy in the list of possible interventions. These guidance documents also caution regarding the potential aerosol generation from the use of respiratory support. According to the World Health Organization (WHO), COVID‐19 is transmitted via respiratory droplets and fomites during close unprotected contact between people. 5 Based on current evidence, classically defined airborne spread has not been reported for COVID‐19 as of this writing and it is not believed to be a major driver of transmission. Caution is recommended due to the unclear nature of particle dispersion during aerosol generation. 6 All guidelines are clear and reinforce the requirement for strict adherence to personal protective equipment (PPE) guidelines and use of environmental controls, including negative pressure rooms, when available.
AGPs can produce airborne particles which can remain suspended in the air, travel over a distance and may cause infection if they are inhaled/contacted; therefore, AGPs create the potential for airborne transmission of infections that may otherwise only be transmissible by the droplet route. 7 Respiratory therapies that are known AGPs include intubation, extubation and related procedures such as manual ventilation and open suctioning, bronchoscopy, non‐invasive ventilation (NIV) such as non‐invasive positive pressure ventilation (NiPPV) and continuous positive airway pressure (CPAP), high‐frequency oscillating ventilation (HFOV), high flow oxygen (HFO, HFNC, and HVNI), induction of sputum, and any procedure that induces coughing. 8 , 9 Particle sizes of droplets or aerosolized infectious pathogens can directly have bearing on transmission distance. Other factors such as room ventilation, people walking nearby, environmental factors, and air flows of any variety can influence particle dispersion distance from the host/origin. 10 , 11 , 12 , 13 , 14
The transmission risk of HFO was brought into question, noting that (1) all AGPs, including HFNC, are high risk for COVID‐19 infection transmission; and (2) due to non‐universal interfaces across multiple device technologies, that HFNC and NIV (specifically NiPPV), with a potential for poor application to the patient, is not recommended for use without an isolation room. 15 Prior research found there was no significant increase in risk for HFO therapy, with lower risk compared to manipulation of oxygen mask, endotracheal aspiration, bronchoscopy, and nebulizer treatment. 8 Studies have shown that good interface practice should be in place for NIV and HFNC. 6 , 16 These studies determined that HFNC aerosol dispersion distance is lower than found in NiPPV and CPAP. Good interface practice for HFNC is a simple and practical consideration of cannula placement into the patient nares, whereas a more significant challenge exists in the case of placing an NiPPV mask‐to‐skin interface. 6 , 16
Although mechanistically different for ventilatory effect, HVNI shares characteristics with HFNC/HFO therapy, in that both deliver heated humidified gas through an open nasal interface, and both are able to deliver oxygen‐rich gas at supraphysiologic flows, allowing a more precise FiO2 delivery in management of hypoxic respiratory failure. HVNI and HFNC have been shown to effectively manage hypoxic respiratory failure in adult patients presenting in the emergency department (ED). 17 , 18 High flow therapy in general has demonstrated broad capability to manage acute respiratory failure, wherein a meta‐analysis demonstrated that HFNC provided superior outcomes regarding avoidance of endotracheal intubation as compared to conventional oxygen therapy, and comparable rates of intubation compared to NiPPV. 19
Computational fluid dynamics (CFD) is an in silico simulation method used to evaluate fluid‐flow problems. Complex geometry is broken down into a mesh of discreet elements. Boundary conditions, such a flow inlets, outlets, and surface conditions are applied to the surfaces of some of the elements. An algorithm then iteratively solves the flow in each element based on the boundary conditions and flow conditions in the elements surrounding it. Smaller elements increase the accuracy, but also the total number of mesh elements (mesh count) required to model the geometry, thus increasing the computation time for the simulation. There are several advantages in comparing in silico CFD with in vitro and in vivo testing. CFD allows measurements of any fluid property simultaneously at all points in the flow, where other methods only allow measurement at specific points at which sensors are placed. For particle studies, CFD allows precise tracking of particle sizes and location that is generally not possible with other methods. Most importantly, CFD allows testing of complex problems without the need to fabricate a physical experiment. There are also disadvantages to CFD, such as the need for careful design of the model and assumptions to avoid obtaining inaccurate results.
The addition of a simple surgical mask over a high flow therapy interface has been proposed as a mitigation to particle dispersal. 3 This study evaluated this recommendation in the case of tidal breathing, low flow oxygen therapy (LFO2), and HVNI. This study expands upon previous work, and by employing high‐resolution CFD. The in silico model included a room simulation to evaluate the fluid dynamic behavior of the effect of a surgical mask on particles which may be generated in the airway while receiving HVNI therapy. A preliminary study was published with lower mesh‐count and lower resolution. 20 This report provides a subsequent high‐mesh‐count simulation with improved fidelity, performed in ANSYS fluent CFD, of the noted models, thereby generating results with higher reliability/acuity than initially published.
2. METHODS
2.1. Model description and specifications
CFD allows for the simulation of complex flow fields, tracking of particles through those fields, interactions of those particles with the carrier fluid, and the differential capturing of particles by a porous media. Evaluation of the use of a Type I surgical mask with HVNI, low flow oxygen, and tidal breathing was performed in ANSYS Fluent CFD (ANSYS, Inc, Canonsburg, PA, USA). Simulations were performed on control cases modeling a patient on HVNI (40 L min−1), low flow oxygen (LFO2) therapy (6 L min−1 via nasal cannula), and simulated breathing (tidal breathing, no therapy) without a surgical mask. Summary of all the evaluated cases are shown in Table 1. The patient is modeled to be breathing at 32 breaths per minute with a tidal volume of 500 mL with a sinusoidal 1:1 ratio (inspiratory:expiratory) breath curve, without a pause (no inter‐breath interval) among the inspiratory/expiratory phases. The peak expiratory flow rate is 49 L min−1. Detailed and expanded description of the CFD modeling methods, validation, and assumptions are provided in the Appendix.
TABLE 1.
Summary of the evaluated room simulation cases
| Simulated case | Therapy flow | Mask | Breathing | Particle range |
|---|---|---|---|---|
| HVNI w/mask | 40 L min−1 | Yes | 32 bpm, 500 ml Vt | 0.1–100 µm |
| Low flow O2 w/mask | 6 L min−1 | Yes | 32 bpm, 500 ml Vt | 0.1–100 µm |
| No therapy w/ mask | N/A | Yes | 32 bpm, 500 ml Vt | 0.1–100 µm |
| HVNI w/o mask | 40 L min−1 | No | 32 bpm, 500 ml Vt | 0.1–100 µm |
| Low flow O2 w/o mask | 6 L min−1 | No | 32 bpm, 500 ml Vt | 0.1–100 µm |
| No therapy w/o mask | N/A | No | 32 bpm, 500 ml Vt | 0.1–100 µm |
Tidal volume is denoted as Vt.
A 3D modeled human head, positioned 736 mm above the floor with a 30° incline, was placed on a bed in a room. The head model includes a simplified airway structure, an adult small/pediatric cannula (Vapotherm Inc, Exeter, NH, USA) and a surgical mask (Figure 1). There are 2 inlet vents and 2 outlet vents located on the ceiling and wall near the floor across the room from the patient. There are 6 air changes per hour (ACH) implemented to simulate a conservative (non‐negative pressure) room ventilation flow.
FIGURE 1.
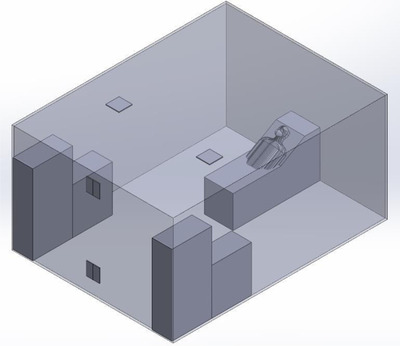
Model of the room simulation 3D surfaces
The Bottom Line
Placing a simple surgical mask over high flow nasal oxygen devices reduced dispersion of respiratory particles in a simulation‐based modeling study.
A Type I surgical mask, appropriate for use on patients to prevent the spread of droplet particles carrying infectious diseases, is modeled for the simulation (Figure 2, left). The model employs a mask fitted to a simulated head. To imitate clinical practice, gaps between skin and mask were modeled in 8 discrete locations (Figure 2, right). Simulated gaps were modeled as a “poor‐fitting” mask at the nose (eg, failure to “pinch the nose” at the bridge of the nose/face interface). Each side of the face has 1 gap that simulates a cannula tube passing through the edge of the mask. The Vapotherm adult‐small/pediatric cannula nose piece is modeled in position with its prongs in the simulated nares. Therapeutic gas flow is defined to emit from the prongs of this cannula.
FIGURE 2.
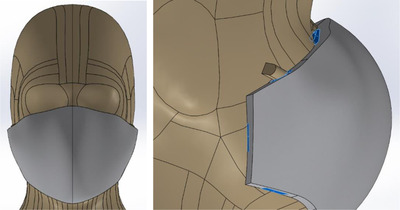
(Left) Image of head with surgical mask. (Right) The skin to mask designed gap locations (blue) are symmetric on each side of mask, representative of a “poorlyfitted” or “worst‐case” mask‐fit on a patient. Both images depicted are for the room simulation
The mask properties were obtained from the standard governing surgical masks, EN14683, 21 and from data in Chen et al. 22 The mask is modeled as a porous medium which allows flow to pass through with a pre‐defined resistance. Particle penetration is obtained from Chen et al data for a mask with a filtration layer at 100 L min−1. As the simulated flow rate through the modeled mask does not exceed 80 L min−1, this is conservative. As the Chen et al data does not include efficiency for particle sizes above 4 µm, the data was extrapolated with the assumption that for every additional 5 µm, the percentage of particles passing through is halved.
2.2. Particle modeling
The distribution of particle sizes emitted by a patient breathing, talking, coughing, and sneezing has been investigated in several studies. The specific distributions vary; however, the range of particle sizes that are meaningful to the study is generally from 0.1 to 100 µm. Particles larger than 100 µm are highly unlikely to penetrate a mask or travel far without a very high velocity flow. Particles smaller than 0.1 µm account for a very small fraction of the total particles and are likely to escape regardless of a mask and will remain airborne regardless of the velocity.
The particle distribution (Table 3), for the simulation is taken from exhaled droplets due to talking and coughing. 13 Particles smaller than 0.1 µm and larger than 100 µm were not included. Virtual particles are introduced in this simulation at just above the larynx, and material properties (mass) of the particles/droplets were defined as water in the ANSYS model. This allows the model to account for both particle size, as denoted in Table 2, and particle mass using water as a correlate.
TABLE 3.
Flow loss rate near the peak expiratory flow for tested cases with a Type I surgical mask
| Simulated case | Flow loss rate |
|---|---|
| HVNI | 67.9% |
| Low flow oxygen | 76.2% |
| No therapy | 73.6% |
TABLE 2.
Particle size filtration efficiency of the Type I surgical mask during the room simulation
| Particle size (µm) | Efficiency | Particle size (µm) | Efficiency |
|---|---|---|---|
| <0.8 | 40% | 5 ≤ d < 10 | 98% |
| 0.8 ≤ d < 0.9 | 50% | 10 ≤ d < 15 | 99% |
| 0.9 ≤ d < 1 | 60% | 15 ≤ d < 20 | 99% |
| 1 ≤ d < 2 | 90% | 20 ≤ d < 25 | 100% |
| 2 ≤ d < 3 | 95% | 25 ≤ d < 30 | 100% |
| 3 ≤ d < 4 | 95% | 30 ≤ d < 40 | 100% |
| 4 ≤ d < 5 | 95% | ≥40 | 100% |
3. RESULTS
3.1. Characterization of the airflow ventilation dynamics
The standard clinical room simulation is transient, accounting for variations of the flow with time caused by cyclic breathing. The simulation was allowed to run until the flow in the room reached a steady state. Streamlines of the fully developed room ventilation flow are shown in Figure 4. The simulations then run for 6 breath cycles (9.8 seconds). Particles are injected at 5 timesteps near peak‐expiratory (PE); PE ‐0.2 seconds, PE ‐0.1 seconds, PE +0.1 seconds, and PE +0.2 seconds. The particles are tracked along their trajectories (Lagrangian) and their final position is calculated.
The particle final positions are grouped into 1 of the following categories, with the results averaged across the 5 timesteps: (1) caught in the mask, (2) trapped in the vicinity of the patient, and (3) escaped. Particles caught in the mask are absorbed in the filter and become trapped, and as such are removed from consideration in the additional airflow dynamics. Particles trapped in the vicinity of the patient are deposited on the patient head, upper torso, bed, or pillow with path lengths less than 1 m, normally considered a likely risk area. Escaped particles are considered to have traveled further than 1 m and could remain in an airflow for longer time within the room.
Sensitivity studies were performed to ascertain the effects of various computational methods used in the fluid flow simulation. Based on the sensitivity studies, the final simulations were all run using the 16.2.1 solver, SST turbulence model, 0.001 second timestep, and without Advanced Numerics (to be more conservative). Particle modeling was performed in post‐processing using 1‐way coupling, so the feedback effects of momentum and turbulence augmentation or suppression by the particles on the fluid flow are not considered. A sensitivity study of mass flow rate of particles on the results confirmed that the mass flow does not affect the percentage of particles caught in the mask or in the vicinity of the patient.
3.2. Characterization of the airflow velocity
Larger particles may remain suspended for a longer time in a flow which has a higher velocity. This demonstrates that in all cases the velocity of the expiratory flow is substantially reduced by the presence of a mask. The mask resists high velocity flow through the media and distributes the flow through a larger area. This diffusing effect results in a much lower velocity in the area near the patient's face and does not allow jetting of flow over long distances, shown graphically by the velocity contours, along the sagittal plane, for all tested cases (Figure 5).
3.3. Characterization of flow loss from surgical mask
Even with the loosely fitted mask modeled in this simulation, most of the flow does not pass through the simulated mask, but rather exits through the designed gaps between skin and mask. Near peak‐expiratory flow was defined as expiratory flow that is within 10% of peak‐expiratory flow (Table 3). Although the percentage of flow loss near peak‐expiratory flow is very high, ranging from 67.9% (HVNI) to 76.2% (tidal breathing, no therapy), the exiting flow velocity is similarly reduced as compared to flow that passes through the mask, demonstrated by evaluating the isosurfaces for all cases at peak expiratory flow (Figure 6). All points on the isosurfaces have a velocity of 0.5 m s−1. In the cases where a mask is present, the velocity is both reduced and is redirected back toward the patient rather than out into the room. Images of results without a mask in place are not shown.
With an actual mask in place, flow passes through the mask and is filtered to remove approximately 96.5% of particles by mass when weighted by the distribution of particles and the efficiency of the filter for those particle sizes. This efficiency would be the upper limit of filtration for a perfectly sealed mask. The flow demonstrated in this simulation, which does escape through the gaps followed a tortuous path, which tended to cause the larger particles to impact the surface of the mask, face, and cannula. These particles remain trapped in the areas around the model's head.
Relative pressure in the airway and inside the mask for each of the 3 cases modeling the mask show increasing therapy flow (from 6 to 40 L min−1) resulting in an increase in relative pressure in the upper airway and mask (Figure 7). In the case of HVNI, a high‐pressure region is also present at the surface of the mask where the high velocity flow from the mouth impacts the mask. This localized high pressure gradient across the mask forces flow through the mask in the localized area. This can also be observed as a region of increased velocity is present outside of the mask (Figure 5), directly opposite the high‐pressure region.
3.4. Characterization of particle dispersion
For HVNI at 40 L min−1 with a mask, 88.8% of the total particle mass is captured and terminated/deposited in the mask (Table 4, Figure 8 top), as compared to 77.4% of the total particle mass captured in the mask while on LFO2 at 6 L min−1, and 73.4% for tidal breathing with a mask. The low proportion of total particles which escape the mask during HVNI have a longer travel length, with 2.97% of particles settling within 1 m, compared to 5.47% for LFO2, and 6.81% for tidal breathing. When the patient simulation is tidal breathing in the room, without therapy and without a surgical mask, 52.3% of total particle mass leaving the nose and mouth will deposit greater than 1 m from the face.
TABLE 4.
ANSYS results for the total percentage of particle mass disposition for all tested cases both with and without a surgical mask
| Simulated case | Mask status | Caught in mask or on patient face | Trapped near face (< 1 m) | Escaped to rest of room (> 1 m) |
|---|---|---|---|---|
| HVNI | No mask | N/A | 23.0% | 77.0% |
| Low flow oxygen | No mask | N/A | 36.4% | 63.7% |
| No therapy | No mask | N/A | 47.7% | 52.3% |
| HVNI | With mask | 88.8% | 2.95% | 8.23% |
| Low flow oxygen | With mask | 77.4% | 5.47% | 17.2% |
| No therapy | With mask | 73.4% | 6.81% | 19.8% |
The proportion of particles > 5 µm, which are captured in the simulated mask over HVNI therapy is 93.4%, as compared to 85.1% while receiving LFO2, and 83.9% during tidal breathing. Table 5 provides the disposition distribution into 2 categories: particles sized ≤5 µm and > 5 µm (Figure 8, middle and bottom).
TABLE 5.
ANSYS results for the percentage of particle mass by disposition and particle size (≤5 µm or > 5 µm) for all tested cases, both with and without a surgical mask
| Simulated case | Mask status | Particle size | Caught in mask or on patient face | Trapped near patient (< 1 m) | Escaped to rest of room (> 1 m) |
|---|---|---|---|---|---|
| HVNI | No mask | ≤5 µm | N/A | 0.00% | 100.0% |
| Low flow oxygen | No mask | ≤5 µm | N/A | 1.96% | 98.0% |
| No therapy | No mask | ≤5 µm | N/A | 5.51% | 94.5% |
| HVNI | With mask | ≤5 µm | 67.6% | 1.73% | 30.7% |
| Low flow oxygen | With mask | ≤5 µm | 29.3% | 8.70% | 62.0% |
| No therapy | With mask | ≤5 µm | 20.9% | 9.60% | 69.5% |
| HVNI | No mask | >5 µm | N/A | 26.7% | 73.3% |
| Low flow oxygen | No mask | >5 µm | N/A | 41.9% | 58.1% |
| No therapy | No mask | >5 µm | N/A | 56.0% | 44.0% |
| HVNI | With mask | >5 µm | 93.4% | 3.22% | 3.37% |
| Low flow oxygen | With mask | >5 µm | 85.1% | 4.96% | 9.99% |
| No therapy | With mask | >5 µm | 83.9% | 6.25% | 9.83% |
4. DISCUSSION
This study adds information for current clinical practice decisionmaking. Particle‐mass dispersion is reduced in this simulated model with the addition of a surgical mask analogue. The simulation showed that the greatest particle loss was associated through the gaps between the skin and mask, but those locations imparted lower velocities of escaping gas, limiting the overall virtual particle mass dispersion. The amount of particle mass captured by the mask was actually greater for the HVNI+Mask scenario as compared to the LFO2+Mask or Tidal Breathing+Mask scenarios. This is likely due to the greatly increased velocity of gas outflow into the mask matrix seen in this model, promoting capture at the mask and diffusion/deflection of the gas stream.
The increased particle capture in the model by HVNI+Mask as compared to LFO2+Mask or Tidal Breathing+Mask is unexpected, given the degree of flow loss by HVNI+Mask was expected to be higher with higher flow. This suggests that the flow loss occurs “after” deposition of the particle mass within the mask matrix or on the face. Although seemingly counterintuitive, the high‐pressure region where the flow impacts the mask offers a probable explanation—the velocity of the flow exiting the mouth during HVNI is significantly higher than the other cases, causing greater momentum of the gas and particles through the mask. As much of the flow is redirected toward the designed gaps, the particles’ momentum resists directional change. The momentum propels particle trapping/deposition into the mask. While a greater proportion of larger particles (> 5 µm) are trapped/deposited in the mask, the effect of increasing the velocity of the flow (LFO2 to HVNI) promulgates a greater difference in the capture of smaller particles (≤5 µm). For particles > 5 µm during HVNI, the mask captures 9.75% more particles than LFO2, and 11.32% more particles than no therapy (tidal breathing). For particles ≤5 µm during HVNI, the mask captures 130.72% more particles than LFO2, and 223.45% more particles than no therapy (tidal breathing). In all cases, the importance of using a mask to reduce the particle dispersion is evident (Figure 8).
Without a mask, most particles disperse beyond the immediate area of the patient. Increased velocity translates to increased particle spread into the room (77.0%, 63.7%, 52.3%) for HVNI, LFO2 and tidal breathing, respectively. This difference is primarily due to the behavior of larger particles/droplets escaping into the room (73.3%, 58.1, 44.0%), respectively. There is less disparity between therapies (100.0%, 98.0%, 94.5%, respectively), for the smaller particles (< 5 µm), as these may remain suspended in the room with less velocity. Adding to previous simulations, these ANSYS results are considered more robust due to the higher mesh density (3.0 × 10⁶ vs 8.8 × 10⁵ elements), finite mask thickness, improved mesh design, finer timesteps, better numerics, inclusion of lift effects, and more robust particle tracking. 20 , 23
This model suggests that the addition of a surgical mask, placed over the mouth and nose of the patient, may significantly reduce the spread of these particles by reducing the flow's velocity through the gaps, thereby decreasing the particles escaping into the room. An important finding was that the overwhelming majority of particles escaping the mask were associated with the model design of the simulation. While this model is intended to simulate a “worst‐case” real‐world clinical application, the findings suggest attention must be paid to securing the mask to the face.
The WHO has suggested the primary mode of transmission was droplet. 5 This has been brought into question with more recent findings suggesting the maintenance of viral activity in smaller (aerosol) particles. 24 The mask also captured a greater proportion of smaller particles (≤5 µm) than were captured while receiving LFO2 or tidal breathing alone. These findings support the notion that a mask over the nasal interface during HVNI may substantially reduce the particulate burden in the room around the patient. Clinicians and healthcare workers must always wear PPE as well as practice droplet precautions during patient interactions with suspected or confirmed COVID‐19, as the risk of AGP in the care of the patients may remain an issue. Newer information suggests important physiological phenotypes which may be better suited to non‐invasive support than to invasive mechanical ventilation. 25 The role of invasive mechanical ventilation as the “first‐line” therapy after simple oxygen management fails has been brought into question. 26 As such, the ability to limit the overall environmental exposure becomes important. Although modeling of liquid and bacterial pathogen dispersal demonstrated that high flow therapy limited the dispersion to the area proximate to the face and cannula, the issue of partial contamination remains concerning. 27
Particle sizes of droplets or aerosolized infectious pathogens can directly have bearing on transmission distance. Although SARS‐CoV‐2 associated with COVID‐19 is reported as 0.06–0.14 µm in size, these viral/infectious particles may be carried in droplets and aerosols when you talk/cough/sneeze. 28 , 29 A 2018 study measuring Influenza virus presence in droplets from a coughing patient noted that the Influenza virus was present in 42%, 23%, and 35% of droplets/particles sized < 1 µm, 1–4 µm, and > 4 µm, respectively. 30 This CFD simulation suggests that there may be capture of the majority of aerosol particles (≤5 µm) and almost all larger particles (> 5 µm). The area immediately proximate to the patient's face may remain the likely “hot zone” for higher contact likelihood even when a mask is employed in clinical practice.
The strength of the study was built upon the following: Inclusion of real‐life variables outlining details such as an average‐fitting Type I surgical mask with appropriate gaps as a result of fitting. The quality and type of mesh in the mask was designed per Type I mask specifications. A room demonstrating particle dispersion was via a fixed patient space, over time, under appropriate hospital‐grade airflow conditions. The particle sizes were engineered to simulate a range of human particle sizes that are emitted during breathing and while on multiple varieties of oxygen support. The quality and high fidelity of analysis using ANSYS in this simulation which increased the specificity of the test and carried out the particle behavior in the room over time compared to the previous simulation trial that utilized SolidWorks for simulation. In addition, the range and modality of comparators used, dispel bias measured with and without a mask in place, tidal breathing, LFO2 at 6 L min−1, and HVNI at 40 L min−1. This method of testing provided extremely specific measurable qualities. This simulation contained aerosolized particles that were engineered to have a wide range of size. These results may be applicable to other operations characterized as AGPs.
Limitations of the simulation include the fact this is an in silico model. In vivo testing to determine particle distribution would be methodologically difficult, with limited ability to further quantify the nature and result of the droplets/particles. Such testing may be an important follow‐on study once adequate methodologies have been identified. The current simulation model is high‐fidelity and takes both a “functioning room” geometry and dynamics into account, including air currents, as well as plausible particle mass distributions in a breathing model, and includes an accurate rendering of the mask behavior. As such it is informative for clinical decisionmaking but has not been tested in vivo. Such testing will no doubt further refine the clinician decisionmaking in the management of these patients. The designed limitation of mask‐fit served the simulation well in highlighting the importance of mask‐fit for any real‐world utilization of a similar model. Another limitation may be the studied particle size thresholds in the findings and applying these to situations in which there are predominantly smaller particles. However, smaller particle masses were studied as part of this evaluation and an advantage of using the mask is demonstrated in this subgroup. Finally, the actual dynamics were tested at a single flowrate for HVNI and for LFO2, although the anticipated behavior of the mask capture simulated in that pair of scenarios would suggest “worst case.”
The fact that tidal breathing and breathing with LFO2 in this simulation were both associated with potential particulate dispersal, these findings may suggest a role for use of a simple surgical mask in the care of any COVID‐19 patient in the acute care environment. The use of masks are likely to help address issues of cough and sneeze, which have been associated with high velocity impulses known to transit particulate mass great distances. 31 These surgical mask simulations would not change current recommendations to use negative pressure rooms, when available. HVNI with a mask may be the safest option in an overwhelmed system (insufficient negative pressure rooms), where patients are treated in simple rooms (as modeled in this study). Regarding disinfection/cleaning implications, these findings suggest no substantive change to current practices because particle escape remains dependent on mask security and due to the fact that respiratory‐therapy‐related transmission is only 1 means of dispersal of particulate contaminants. However, practically, the results for this particular configuration and simulation infer that additional focus could be placed on areas behind the patient head. Cleaning procedures should be completed correctly and consistently to prevent excess viral load accumulation on fomites, thereby decreasing risk of infectious particle/droplet transmission.
5. CONCLUSIONS
Non‐invasive therapies such as HFO are widely used in management of acute critically ill patients with respiratory distress. Such patients present a potential droplet‐transmissive risk during care. PPE and environmental control/engineering should be a primary concern/consideration when managing patients with COVID‐19. This model corresponds with prior work indicating that even tidal breathing disperses particles some distance. This model also suggests that when making decisions regarding limitation of potentially infectious droplets/particles, the application of a simple surgical mask, which is well‐fit to the patient's face, may reduce the velocity of escaping gas and capture particles. This adjunct must be balanced against the totality of the patient care situation, as the addition of a surgical mask adds, albeit very slightly, to the complexity of management of the patient. Clinicians will have to decide on the cadence for changing such masks, if required, based on the particular circumstances in management of that patient. No recommendations regarding that aspect of care can be made from these data. These in silico findings should be evaluated in‐vivo with appropriately constructed clinical trials.
CONFLICT OF INTEREST
In accordance with ICMJE guidelines at the time of this study: Reid Prichard and Wayne Strasser declare no conflict of interest. Charles W. Atwood has received fees from Vapotherm, Inc for clinical research consultation. Jessica S. Whittle has received fees for clinical research consultation and speaker honorarium from Vapotherm Inc. Scott Leonard, Leonithas I. Volakis, Ronald J. DeBellis, and George C. Dungan are employees of Vapotherm Inc. No payments were received in preparation of this manuscript.
AUTHOR CONTRIBUTIONS
Scott Leonard, Wayne Strasser, and George C. Dungan conceived the study and designed the protocol. Scott Leonard, Wayne Strasser, Reid Prichard, and George C. Dungan supervised conduct of the study. Scott Leonard, Wayne Strasser, Reid Prichard, George C. Dungan, Leonithas I. Volakis, and Ronald J. DeBellis managed the data, including quality control. Scott Leonard, Wayne Strasser, George C. Dungan, Leonithas I. Volakis, Ronald J. DeBellis, and Reid Prichard provided advice on study design and data analysis. Jessica S. Whittle, Charles W. Atwood, Ronald J. DeBellis, and George C. Dungan provided clinical advice on study interpretation. Ronald J. DeBellis, Leonithas I. Volakis, Scott Leonard, George C. Dungan, Jessica S. Whittle, and Wayne Strasser drafted the manuscript. All authors contributed to the manuscript revisions prior to submission.
Biography
Leonithas I. Volakis, PhD, is a research scientist at Vapotherm, Inc, Exeter, NH.

APPENDIX 1.
EXPANDED METHODS AND MODEL TECHNICAL SPECIFICATIONS
This appendix is intended to provide additional CFD model specificity for reproducible study results.
Room model
The room model used in the simulation measures 4.87 m × 3.65 m × 2.44 m with a total volume of 43 m3. Two inlet vents are positioned on the ceiling (dimensions 0.305 m × 0.305 m), and 2 outlet vents (0.305 m × 0.305 m) located on the centerline of the wall across from the patient, with one near the floor and the other near the ceiling.
Patient model
A 3D model of a human head is positioned on a bed 736 mm above the floor with a 30° incline. The head model includes a simplified airway structure. The mouth opening is rectangular with rounded corners (5 mm × 20 mm with 2.5 mm radius corners). The nasal openings each measure 8 mm × 9 mm with 2.5 mm rounded corners. An adult small/pediatric cannula (Vapotherm Inc., Exeter, NH, USA) is positioned with its prongs in the center of the nasal openings. The flow opening of the nasal cannula measured 2.62 mm in diameter. The airway model extends to a point just above the larynx, where the fluid passage is terminated with a planar surface. This surface is used as both a flow opening for the breathing flow and the source of the particles introduced into the flow.
Mask model
A model of a Type I surgical mask is fitted to simulated head. The mask is modeled with a thickness of 4 mm to allow a mesh with 4 hexahedral elements across the thickness without requiring prohibitively small mesh elements. The mask properties are adjusted to account for the modeled thickness. To imitate clinical practice, the designed emission‐openings were modeled in 8 discrete locations (Figure 2, right). The total cross section of the emission‐openings is 679 mm2, thereby modeling a “poor fitting” of the mask at the nose (eg, failure to “pinch the nose” at the bridge of the nose/face interface). Each side of the face has 1 emission‐opening which simulates a cannula tube passing through the edge of the mask. The discrete emission‐openings have the same cross section as a 1.3 mm gap around the entire perimeter. Discrete emission‐openings were used to improve CFD performance. Modeling the emission‐opening as a continuous narrow channel would have required a finer mesh to accurately simulate the emissions.
The mask pressure‐drop properties were obtained from the standard governing surgical masks, EN14683, 21 and from data in Chen et al. 22 The mask is modeled as a porous medium which allows flow to pass through with a pre‐defined resistance. The pressure drop of the mask is modeled to be in accordance with EN14683 and Chen et al, providing a pressure drop of 29.4 Pa cm‐2 for a test area of 4.9 cm2. The velocity and pressure drop data used to model the porous media properties is given in Table A1. The porous media properties were validated by modeling the standard test defined in EN14683. Using the 4 mm thick mask, a test area of 4.9 cm2 and the defined porous media properties a pressure drop of 29.4 Pa cm‐2 was obtained in the validation model.
TABLE A1.
Velocity and pressure drop data used in the model for porous media properties
| Velocity (m s−1) | Pressure drop (Pa) |
|---|---|
| 0.00615 | 2.0 |
| 0.012 | 3.9 |
| 0.037 | 10.8 |
| 0.074 | 22.6 |
| 0.123 | 39.2 |
| 0.272 | 29 |
Particle penetration is obtained from Chen et al data for a mask with a filtration layer at 100 L min−1. As the simulated flow rate through the modeled mask does not exceed 80 L min−1, this is conservative. As the Chen et al data do not include efficiency for particle sizes above 4 µm, the data was extrapolated with the assumption that for every additional 5 µm, the percentage of particles passing through is halved. Above 20 µm the filtration efficiency is assumed to be 100%. The filtration efficiency, summarized in Table 2, was used to implement a user‐defined function (UDF) in ANSYS fluent to remove particles that pass through the filter. When a particle trace enters the porous media volume, the mass travelling along that particle trace is reduced by the filtration efficiency for that size particle.
CFD allows for the simulation of complex flow fields, tracking of particles through those fields, interactions of those particles with the carrier fluid, and the differential capturing of particles by a porous media. Evaluation of the use of a surgical mask with HVNI, low flow oxygen, and tidal breathing was performed in ANSYS fluent CFD (ANSYS, Inc, Canonsburg, PA, USA). Simulations were performed on control cases modeling a patient on HVNI (40 L min−1), LFO2 therapy (6 L min−1 via Nasal Cannula), and simulated breathing (tidal breathing, no therapy) without a surgical mask. Summary of all the evaluated cases are shown in Table 1. The patient is modeled to be breathing at 32 breaths per minute with a tidal volume of 500 mL with a sinusoidal 1:1 ratio (inspiratory:expiratory) breath curve, without a pause (no inter‐breath interval) among the inspiratory/expiratory phases. The peak expiratory flow rate is 49.0 L min−1.
Particle modeling
The distribution of assumed spherical particle sizes emitted by a patient breathing, talking, coughing, and sneezing has been investigated in several studies. The specific distributions vary; however, the range of particle sizes that are meaningful to the study is generally from 0.1 to 100 µm. Particles larger than 100 µm are highly unlikely to penetrate a mask or travel far without a very high velocity flow. Particles smaller than 0.1 µm account for a very small fraction of the total particles are likely to escape regardless of a mask and will remain airborne even in very low velocity flows.
The particle distribution (Table A2), for the simulation is taken from exhaled droplets due to talking and coughing. 13 A Rosin‐Rammler diameter distribution method is used during the simulation to generate particles that approximate this particle distribution. Particles smaller than 0.1 µm and larger than 100 µm were not included. The Rosin‐Rammler parameters, and n = 0.990 are used for the simulation, with the parameters’ curve fit shown (Figure A1). The particles are released at 5 timesteps near peak expiratory flow and traced through the flow field at that time step. Particles are introduced at just above the larynx, representative as water for material properties. Note that all surfaces inside the airway are defined to have ideal reflection for particles that contact those surfaces, such that particles are not absorbed until particles exit the nasal‐oral opening of the human airway.
TABLE A2.
Mass fractions of the particle distribution used in the room simulation (left) and for the curve fit (left and right) of the Rosin‐Rammler Diameter distribution (Figure A1)
| Used in simulation | Used in curve fit (not simulated) | ||
|---|---|---|---|
| Particle size (µm) | Mass fraction (%) | Particle size (µm) | Mass fraction (%) |
| 0–5 | 2.7 | 100–150 | 11.3 |
| 5–10 | 12.2 | 150–200 | 3.1 |
| 10–15 | 8.5 | 200–250 | 2.4 |
| 15–20 | 4.5 | 250–300 | 0.7 |
| 20–25 | 3.9 | 300–350 | 2 |
| 25–30 | 4.2 | 350–400 | 0.1 |
| 30–35 | 4.4 | 400–450 | 0 |
| 35–40 | 3.5 | 450–500 | 0.1 |
| 40–45 | 2.9 | 500–1000 | 0.2 |
| 45–50 | 4.9 | 1000–1500 | 11.3 |
| 50–75 | 15 | ||
| 75–100 | 13.3 | ||
Mesh geometry
Mesh geometry of 3 million elements used in the simulation is shown in Figure 3. A hex‐dominant mesh is implemented in the mask and the majority of the room volume. Tetrahedral elements converted to polyhedron elements are implemented in the regions near the head, where hex‐dominant meshing was unachievable. As the mask is a critical component for an accurate simulation, the mesh density within the mask is set to achieve a thickness of at least 4 hexahedral elements. Hexahedral elements were used in this instance since validation testing in ANSYS reveals that hexahedra are required for accurate pressure drop results and are preferred for atomization studies. 32 Mesh refinement is also applied to the regions around the patient to best achieve accurate particle movement trajectories both near the patient and where particles settle.
FIGURE 3.
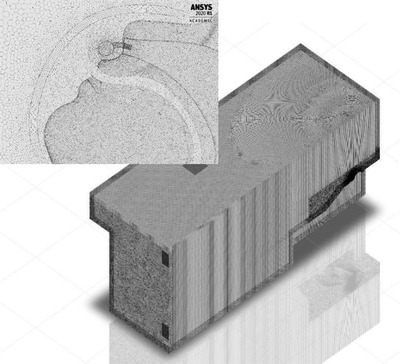
Visual of the high‐resolution mesh geometry implemented for the room simulation
FIGURE 4.
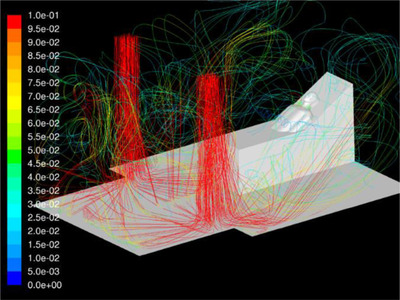
The airflow streamlines for ventilation during the room simulation
FIGURE 5.
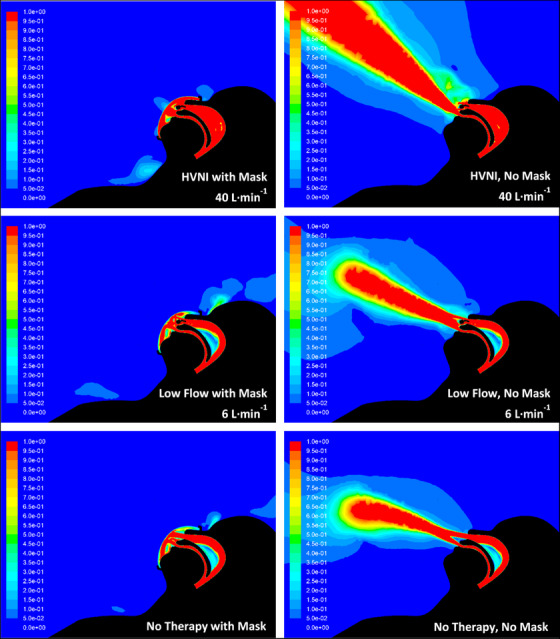
Velocity contours for all test cases during the room simulation. Images provide the velocity of the gas flows (denoted as m s−1) tested settings both with (left) and without (right) a surgical mask: HVNI at 40 L min−1 (top), low flow at 6 L min−1 (middle), no therapy (bottom). Images are representative of the cross‐section at the sagittal plane
FIGURE 6.
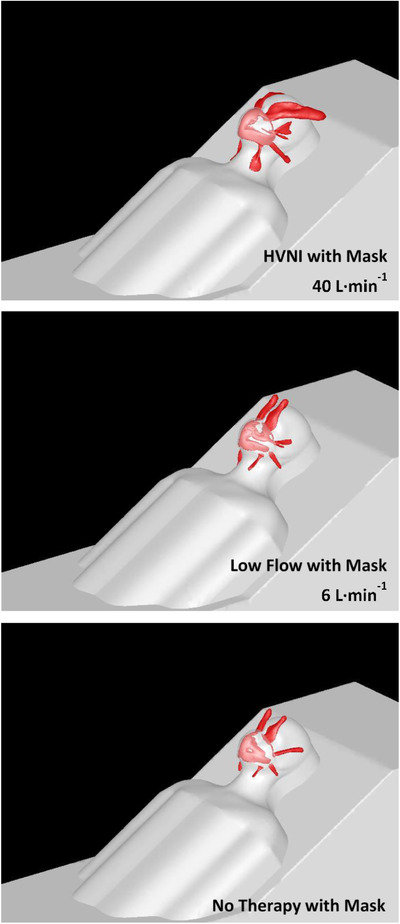
Loss of gas flows across the isosurfaces for tested cases during the room simulation. Images provide the exit locations of the gas flows (velocity of 0.5 m s−1 across the isosurfaces) during the tested settings with a surgical mask: HVNI at 40 L min−1 (top), low flow at 6 L min−1 (middle), no therapy (bottom)
FIGURE 7.
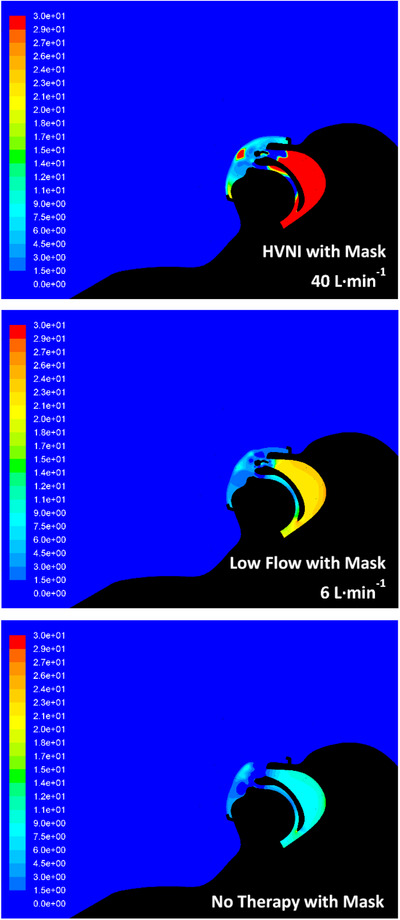
Relative pressure (Pa) contours within the region of the mask and upper airway for the tested cases during the room simulation. HVNI at 40 L min−1 (top), low flow at 6 L min−1 (middle), no therapy (bottom). Images are representative of the cross‐section at the sagittal plane
FIGURE 8.
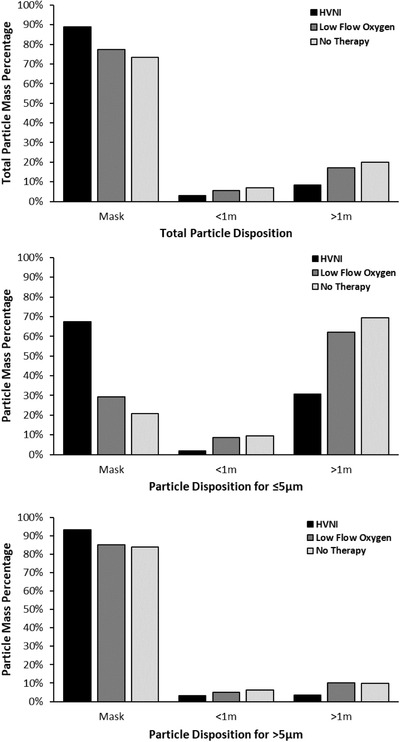
ANSYS results for the percentage of (top) total particle mass disposition, (middle) particle mass disposition for particles ≤5 µm, and (bottom) particle mass disposition for particles > 5 µm for all tested cases with a surgical mask. For particles > 5 µm during HVNI, the mask captures 9.75% more particles than LFO2, and 11.32% more particles than no therapy (tidal breathing). For particles ≤5 µm during HVNI, the mask captures 130.72% more particles than LFO2, and 223.45% more particles than no therapy (tidal breathing)
FIGURE A1.
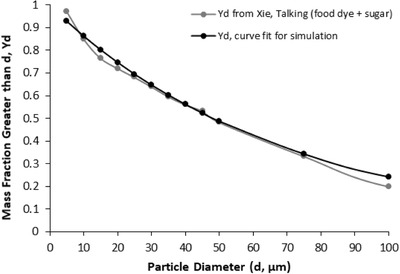
Rossin‐Rammler diameter distribution of the particles in the room simulation
Boundary conditions
The patient breathing is modeled as a sinusoidal flow with a frequency of 32 breaths per minute. The breath curve is defined by the equation where is the mass flow rate in kg s−1. Therapy flow is modeled as a constant inlet with a mass flow rate of 8.02 × 10‐4 kg s−1 (40 L min−1) or 1.204 × 10‐4 kg s−1 (6 L min−1). Room ventilation is modeled as an inlet with a constant flow of 0.066 m3 s−1.
Simulation
The simulations are transient, accounting for variation of the flow with time caused by cyclic breathing. The simulation is allowed to run until the flow in the room reaches a quasi‐steady state. Figure 3 shows the streamlines of the fully developed room ventilation flow. A fixed time step of 0.001 seconds is used for the simulation. The solver (16.2.1 vs 2020R1), turbulence model (RSM vs SST), and timestep (0.001s vs 0.0001s) had negligible effect on the results (data not shown). Use of the Advanced Numerics option showed a non‐negligible increase in particle capture in the mask. This is possibly due to the numerics affecting how the porous media resistance is computed at the interface between the porous zone and the bordering fluid zone. The particle model uses a specified mass flow rate for normalization purposes only. All results are reported as a percentage of the total mass flow rate. A sensitivity study of mass flow rate of particles on the results confirmed that the mass flow does not affect the percentage of particles caught in the mask or in the vicinity of the patient. Saffman lift effects are included in the particle simulation. A sensitivity study showed Saffman lift increases capture in the mask as compared to neglecting this effect (data not shown).
Major technical differences from the preliminary model
The preliminary simulation and model was published in a Chest Research Letter. 20 Upon review of this preliminary work, the authors designed a subsequent model, with the aim to provide a more reliable and accurate simulation. There are several differences between the preliminary study and the current study, which improve the simulation, and thereby provide more reliable findings. First, the mesh across the surgical mask is now hexahedral element instead of tetrahedral element, as tetrahedral element mesh may constrain/influence the properties of the porous media and subsequently may affect the differential particle filtration. Second, the hexahedral elements replaced the bulk room geometry mesh, and an increased mesh density was now applied to the area of the room immediately surrounding the patient. Third, the current study involves a significantly higher computational cell count and resolution/quality on and around the patient mouth, nose, and internal airway, which provides a lower growth rate as element size transitions more gradually from smaller to larger elements. Finally, the emission‐openings between the face and mask were previously artificially restricted by use of tetrahedral elements that were converted to polyhedral elements, thus reducing the mesh cell count (resolution) through the emission‐openings. This study, with hexahedral elements, does not artificially constrict these emission‐openings by allowing the boundary conditions to be fully realized. The effect of this change was to invert the preliminary model results for the proportion of flow that passes through the emission‐openings.
Leonard S, Strasser W, Whittle JS, et al. Reducing aerosol dispersion by high flow therapy in COVID‐19: high resolution computational fluid dynamics simulations of particle behavior during high velocity nasal insufflation with a simple surgical mask. JACEP Open. 2020;1:578–591. 10.1002/emp2.12158
Funding and Support: Financial support provided by study sponsor, Vapotherm, Inc. (Exeter, NH USA), and the study was conducted in the Department of Mechanical Engineering at Liberty University (Lynchburg, VA, USA).
Supervising Editor: Nicholas Johnson, MD.
REFERENCES
- 1. World Health Organization . Clinical Management of Severe Acute Respiratory Infection When Novel Coronavirus (2019‐nCoV) Infection is Suspected: Interim Guidance. WHO reference number: WHO/nCoV/Clinical/2020.3 13 March 2020. [Google Scholar]
- 2. Alhazzani W, Moller MH, Arabi YM, et al. Surviving sepsis campaign: guidelines on the management of critically ill adults with coronavirus disease 2019 (COVID‐19). Crit Care Med. 2020;48(6):440‐469. [DOI] [PMC free article] [PubMed] [Google Scholar]
- 3. Respiratory care committee of Chinese Thoracic S . Expert consensus on preventing nosocomial transmission during respiratory care for critically ill patients infected by 2019 novel coronavirus pneumonia. Zhonghua Jie He He Hu Xi Za Zhi. 2020;17(0):E020. [DOI] [PubMed] [Google Scholar]
- 4. Kluge S, Janssens U, Welte T, Weber‐Carstens S, Marx G, Karagiannidis C. Recommendations for critically ill patients with COVID‐19. Med Klin Intensivmed Notfmed. 2020. [DOI] [PMC free article] [PubMed] [Google Scholar]
- 5. WHO . Report of the WHO‐China Joint Mission on Coronavirus Disease 2019 (COVID‐19). 2020.
- 6. Hui DS, Chow BK, Lo T, et al. Exhaled air dispersion during high‐flow nasal cannula therapy versus CPAP via different masks. Eur Respir J. 2019;53(4):1802339. [DOI] [PubMed] [Google Scholar]
- 7. WHO . Infection Prevention and Control of Epidemic and Pandemic Prone Acute Respiratory Infections in Health Care. Geneva, Switzerland: World Health Organization; 2014. [PubMed] [Google Scholar]
- 8. Tran K, Cimon K, Severn M, Pessoa‐Silva CL, Conly J. Aerosol generating procedures and risk of transmission of acute respiratory infections to healthcare workers: a systematic review. PLoS One. 2012;7(4):e35797. [DOI] [PMC free article] [PubMed] [Google Scholar]
- 9. Department of Health and Social Care ‐ Public Health Wales ‐ Public Health Agency Northern Ireland ‐ Health Protection Scotland ‐ Public Health England . Guidance for infection prevention and control in healthcare settings: Adapted from Pandemic Influenza Guidance for Infection Prevention and Control in Healthcare Settings 2020 . 2020.
- 10. Gralton J, Tovey E, McLaws ML, Rawlinson WD. The role of particle size in aerosolised pathogen transmission: a review. J Infect. 2011;62(1):1‐13. [DOI] [PMC free article] [PubMed] [Google Scholar]
- 11. Tang JW, Li Y, Eames I, Chan PK, Ridgway GL. Factors involved in the aerosol transmission of infection and control of ventilation in healthcare premises. J Hosp Infect. 2006;64(2):100‐114. [DOI] [PMC free article] [PubMed] [Google Scholar]
- 12. Yang S, Lee GW, Chen CM, Wu CC, Yu KP. The size and concentration of droplets generated by coughing in human subjects. J Aerosol Med. 2007;20(4):484‐494. [DOI] [PubMed] [Google Scholar]
- 13. Xie X, Li Y, Sun H, Liu L. Exhaled droplets due to talking and coughing. J R Soc Interface. 2009;6(Suppl 6):S703‐714. [DOI] [PMC free article] [PubMed] [Google Scholar]
- 14. Kwon SB, Park J, Jang J, et al. Study on the initial velocity distribution of exhaled air from coughing and speaking. Chemosphere. 2012;87(11):1260‐1264. [DOI] [PMC free article] [PubMed] [Google Scholar]
- 15. Cheung JC, Ho LT, Cheng JV, Cham EYK, Lam KN. Staff safety during emergency airway management for COVID‐19 in Hong Kong. Lancet Respir Med. 2020;8(4):e19. [DOI] [PMC free article] [PubMed] [Google Scholar]
- 16. Hui DS, Chow BK, Lo T, et al. Exhaled air dispersion during noninvasive ventilation via helmets and a total facemask. Chest. 2015;147(5):1336‐1343. [DOI] [PMC free article] [PubMed] [Google Scholar]
- 17. Doshi P, Whittle JS, Bublewicz M, et al. High‐velocity nasal insufflation in the treatment of respiratory failure: a randomized clinical trial. Ann Emerg Med. 2018;72(1):73‐83 e75. [DOI] [PubMed] [Google Scholar]
- 18. Frat JP, Thille AW, Mercat A, et al. High‐flow oxygen through nasal cannula in acute hypoxemic respiratory failure. N Engl J Med. 2015;372(23):2185‐2196. [DOI] [PubMed] [Google Scholar]
- 19. Ni YN, Luo J, Yu H, et al. Can high‐flow nasal cannula reduce the rate of endotracheal intubation in adult patients with acute respiratory failure compared with conventional oxygen therapy and noninvasive positive pressure ventilation?: a systematic review and meta‐analysis. Chest. 2017;151(4):764‐775. [DOI] [PubMed] [Google Scholar]
- 20. Leonard S, Atwood CW, Jr , Walsh BK, et al. Preliminary findings of control of dispersion of aerosols and droplets during high velocity nasal insufflation therapy using a simple surgical mask: implications for high flow nasal cannula. Chest. 2020. [DOI] [PMC free article] [PubMed] [Google Scholar]
- 21. Standard E, Surgical Masks—Requirements and Test Methods. 2005.
- 22. Chen C‐C, Willeke K. Aerosol penetration through surgical masks. Am J Infect Control. 1992;20(4):177‐184. [DOI] [PubMed] [Google Scholar]
- 23. Strasser W. Discrete particle study of turbulence coupling in a confined jet gas‐liquid separator. J Fluids Eng. 2008;130(1). [Google Scholar]
- 24. van Doremalen N, Bushmaker T, Morris DH, et al. Aerosol and surface stability of SARS‐CoV‐2 as compared with SARS‐CoV‐1. N Engl J Med. 2020;382(16):1564‐1567. [DOI] [PMC free article] [PubMed] [Google Scholar]
- 25. Gattinoni L, Chiumello D, Caironi P, et al. COVID‐19 pneumonia: different respiratory treatments for different phenotypes?. Intensive Care Med. 2020. [DOI] [PMC free article] [PubMed] [Google Scholar]
- 26. Tobin MJ. Basing respiratory management of coronavirus on physiological principles. Am J Respir Crit Care Med. 2020. [DOI] [PMC free article] [PubMed] [Google Scholar]
- 27. Kotoda M, Hishiyama S, Mitsui K, et al. Assessment of the potential for pathogen dispersal during high‐flow nasal therapy. J Hosp Infect. 2020;104(4):534‐537. [DOI] [PMC free article] [PubMed] [Google Scholar]
- 28. Zhu N, Zhang D, Wang W, et al. A novel coronavirus from patients with pneumonia in China, 2019. N Engl J Med. 2020;382(8):727‐733. [DOI] [PMC free article] [PubMed] [Google Scholar]
- 29. Santarpia JL. Transmission potential of SARS‐CoV‐2 in viral shedding observed at the University of Nebraska Medical Center. MEDRxiv. 2020. online. [Google Scholar]
- 30. Ai ZT, Melikov AK. Airborne spread of expiratory droplet nuclei between the occupants of indoor environments: a review. Indoor Air. 2018;28(4):500‐524. [DOI] [PubMed] [Google Scholar]
- 31. Bourouiba L. Turbulent gas clouds and respiratory pathogen emissions: potential implications for reducing transmission of COVID‐19. JAMA. 2020. [DOI] [PubMed] [Google Scholar]
- 32. Strasser W. The war on liquids: disintegration and reaction by enhanced pulsed blasting. Chem Eng Sci. 2020;216:115458. [Google Scholar]