

Abstract
The purpose of this study was to investigate the early risk factors for the exacerbation of coronavirus disease 2019 (COVID‐19) pneumonia. Restrospective analysis of clinical data of 85 patients infected with severe acute respiratory syndrome coronavirus 2 (SARS‐CoV‐2), including gender, age, comorbidities, symptoms, blood routine, clotting profile, biochemical examination, albumin, myocardial enzyme profile, inflammatory markers, and chest computed tomography (CT). All laboratory examinations were measured within first 24 hours after admission, and chest CT was performed before admission. A total of 56 (65.9%) patients had a history of exposure to the Huanan seafood market in Wuhan. Fever and dry cough accounted for the highest percentage of all symptoms. Male COVID‐2019 patients were more likely to develop severe pneumonia. Patients with severe and critical conditions are older and have higher rates of hypertension (P = .003) and coronary heart disease (P = .017). All severe and critical patients infected with SARS‐CoV‐2 showed bilateral lung involvement and have more multiple lobes involvement than common patients (P < .001). Severe and critical patients showed higher white blood cell count (P = .006), neutrophil (NEU) count (P = .001), NEU% (P = .002), procalcitonin (P = .011), C‐reactive protein (P = .003), prothrombin time (P = .035), D‐dimer (P = .025), aspartate aminotransferase (P = .006), and lower lymphocyte (LYM) count (P = .019), LYM% (P = .001), albumin (P < .001). Logistic regression analysis showed that NEU count is an independent risk factor for deterioration, with the threshold of 6.5 × 10⁹·L−1. We concluded that the laboratory independent risk factor for the progression of COVID‐19 pneumonia is NEU count. In addition, COVID‐19 patients with bilateral lung involvement or multiple lobes involvement should be taken seriously and actively treated to prevent deterioration of the disease.
Keywords: chest CT, clinical features, COVID‐19, risk factors, SARS‐CoV‐2
1. INTRODUCTION
Coronavirus disease 2019 (COVID‐19) is an emerging infectious disease with significant morbidity and mortality, which is caused by severe acute respiratory syndrome coronavirus 2 (SARS‐CoV‐2). 1 In January 2020, the World Health Organization Emergency Committee announced “a public health emergency of international concern.” As of 18 March 2020, SARS‐CoV‐2 has swept through 151 countries worldwide, causing 114 428 infections and 4655 deaths. At present, the virus is spreading rapidly in many countries, with outbreaks in Italy, Iran, Spain, Germany, and South Korea causing the most concern.
The main manifestations of the disease are fever, dry cough and fatigue. 2 A small number of patients have symptoms such as the stuffy nose, runny nose, sore throat, myalgia, and diarrhea. 3 Severe patients often develop dyspnea and/or hypoxemia 1 week after onset, and may even rapidly progress to acute respiratory distress syndrome (ARDS), septic shock, hard‐to‐correct metabolic acidosis, bleeding and coagulation dysfunction, and multiple organ failure. 2 To date, the worldwide mortality rate for patients infected with SARS‐CoV‐2 is about 4.1%. Early identification of patients with possible deterioration of the disease is particularly important for controlling the proportion of severe patients and reduce mortality. Therefore in this study, we aimed to analyze the early clinical features of COVID‐19 and investigate the early risk factors for exacerbation.
2. MATERIALS AND METHODS
2.1. Data collection
The clinical data of 85 patients diagnosed by COVID‐19 were collected, including 39 common patients in the department of infectious diseases from 10 January 2020 to 15 February 2020 and 46 severe and critical patients in the intensive care unit (ICU) from 10 January 2020 to 28 February 2020. All patients were collected continuously. The collection and use of relevant information can fully protect the privacy of patients and the study conformed to ethical norms. The diagnosis of COVID‐19 referred to the “diagnosis and treatment of novel coronavirus pneumonia (trial version 7)” issued by the National Health Commission of the People's Republic of China. 4 The confirmed patient should satisfy sputum, pharynx swab or lower respiratory tract secretions and other specimens to receive real‐time qPCR to show positive viral nucleic acid. 3 Influenza virus, adenovirus, respiratory syncytial virus, and other known viral infections and mycoplasma pneumoniae infection were excluded in all patients.
2.2. Clinical classification
At present, the clinical classification of the disease is: common type: with fever, respiratory symptoms, imaging manifestations of pneumonia; severe type, one of the following: (a) respiratory distress, respiratory rate ≥30 times/minute; (b) in resting state, oxygen saturation is less than 93%; (c) partial arterial oxygen pressure (PaO2)/oxygen absorption concentration (FiO2) ≤300 mm Hg (1 mm Hg = 0.133 kPa); (d) chest imaging showed that the lesion significantly progressed to more than 50% within 24 to 48 hours; critical type: one of the following: (a) respiratory failure, requiring mechanical ventilation; (b) shock; (c) combined with other organ failure, ICU is required. 5
2.3. Imaging examination
All patients underwent computed tomography (CT) examination before admission. GE discovery and Siemens Somatom Sensation were used for spiral CT scanning. The patient was supine and scanned at the end of inspiration with a conventional dose scan ranging from the tip of the lung to the base of the lung. The thin‐slice CT image was evaluated by two radiologists who did not know the results of nucleic acid.
2.4. Laboratory examination
White blood cell (WBC), neutrophil count (NEU), lymphocyte count (LYM), hemoglobin (HGB), platelet count (PLT), prothrombin time (PT), activated partial thromboplastin time (APTT), D‐dimer, alanine aminotransferase (ALT), aspartate aminotransferase (AST), albumin (ALB), total bilirubin (TBIL), creatinine (Cr), creatine kinase (CK), lactate dehydrogenase (LDH), troponin I (TnI), procalcitonin (PCT), and C‐reactive protein (CRP) were measured for all enrolled patients within first 24 hours after admission.
2.5. Statistical analysis
The normal distribution measurement data were presented as the mean ± standard deviation, and the Student t test was employed to compare the mean of two groups. The nonnormal distribution measurement data were described as median (quartile spacing), and the Mann‐Whitney rank‐sum test was used for the nonparametric analysis. The counting data were compared by the χ 2 test or Fisher's exact test. Multiple Logistic regression was used for the regression analysis. Statistical significance was set as P < .05. SPSS13.3 was used for statistical analysis (Figure 1).
Figure 1.
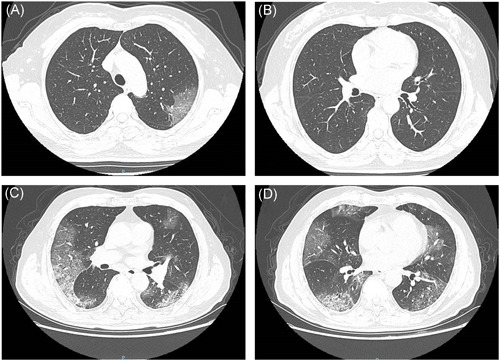
A and B, A 57‐year‐old woman was diagnosed with COVID‐19 (general type). Chest CT showed unilateral ground‐glass shadow in the left upper lobe. C and D, A 72‐year‐old man was diagnosed with COVID‐19 (severe and critical type). CT examination showed bilateral multiple ground‐glass shadows and subpleural mesh shadows. COVID‐19, coronavirus disease 2019; CT, computed tomography
3. RESULTS
3.1. Clinical features
A total of 85 patients were included in this study, including 39 common patients and 46 severe and critical patients. Among them, 45 (52.9%) were males and 40 (47.1%) were females, and males were more likely to develop severe pneumonia (27 vs 12, P = .006). In addition, severe and critical patients were older than common patients (53.6 ± 13.7 vs 65.1 ± 15.1, P = .002). 56 (65.9%) patients had a history of exposure to the Huanan seafood market in Wuhan. The most common symptoms at onset were fever (89.4%) and dry cough (76.5%); while the less common symptoms were fatigue or muscle aches (42.4%), expectorant (18.8%), dizziness or headache (12.9%), dyspnea (9.4%), and diarrhea (7.1%). There were no statistically significant differences in symptoms between the two groups. In addition, in terms of comorbidities, compared with common patients, the proportion of severe and critical patients with hypertension (13.0% vs 41.0%, P = .003) and coronary heart disease (2.2% vs 20.5%, P = .017) were higher. However, there were no statistically significant differences in other comorbidities and vital signs between the two groups (Table 1).
Table 1.
Clinical features of patients infected with SARS‐CoV‐2
| Overall (n = 85) | General group (n = 46) | Severe and cirtical group (n = 39) | P value | |
|---|---|---|---|---|
| Characteristics | ||||
| Age, y | 59.4 ± 15.3 | 53.6 ± 13.7 | 65.1 ± 15.1 | .002 |
| ≤60 | 46 (54.1%) | 32 (69.6%) | 14 (35.9%) | |
| >60 | 39 (45.9%) | 14 (30.4%) | 25 (64.1%) | |
| Gender | .006 | |||
| Male | 45 (52.9%) | 18 (39.1%) | 27 (69.2%) | |
| Female | 40 (47.1%) | 28 (60.9%) | 12 (30.8%) | |
| Comorbidities | ||||
| Chronic obstructive pulmonary disease | 5 (5.9%) | 1 (2.2%) | 4 (10.3%) | .265 |
| Diabetes | 10 (11.8%) | 3 (6.5%) | 7 (17.9%) | .197 |
| Hypertension | 22 (25.9%) | 6 (13.0%) | 16 (41.0%) | .003 |
| Chronic kidney disease | 4 (4.7%) | 1 (2.2%) | 3 (7.7%) | .830 |
| Chronic liver disease | 6 (7.1%) | 2 (4.3%) | 4 (10.3%) | .526 |
| Coronary heart disease | 9 (10.6%) | 1 (2.2%) | 8 (20.5%) | .017 |
| Symptoms | ||||
| Fever ≥37.3℃ | 76 (89.4%) | 40 (87.0%) | 36 (92.3%) | .656 |
| Dry cough | 65 (76.5%) | 33 (71.7%) | 32 (82.1%) | .264 |
| Fatigue, muscle aches | 36 (42.4%) | 18 (39.1%) | 18 (46.2%) | .514 |
| Expectorant | 16 (18.8%) | 10 (21.7%) | 6 (15.4%) | .455 |
| Dizziness, headache | 11 (12.9%) | 5 (10.9%) | 6 (15.4%) | .537 |
| Dyspnea | 8 (9.4%) | 3 (6.5%) | 5 (12.8%) | .536 |
| Diarrhea | 6 (7.1%) | 2 (4.3%) | 4 (10.3%) | .526 |
| Pulse | 81 (73‐89) | 79 (72‐86) | 83 (74‐93) | .259 |
| Respiratory rate >24 per min | 14 (16.5%) | 5 (10.7%) | 9 (23.1%) | .131 |
| Systolic pressure >140 mm Hg | 14 (16.5%) | 5 (10.7%) | 10 (25.6%) | .075 |
Note: Data are mean ± SD, median (IQR) or n/N (%). P values comparing normal group and severe and critical group are from the Student t test, Mann‐Whitney rank‐sum test, the χ 2 test, or Fisher's exact test.
Abbreviations: IQR, interquartile range; SD, standard deviation; SARS‐CoV‐2, severe acute respiratory syndrome coronavirus 2.
3.2. CT features
All patients presented abnormal chest CT findings before admission. Of the 85 patients, 77 (90.6%) had bilateral involvement. All severe and critical patients showed bilateral lung involvement. In addition, the rate of bilateral involvement was higher in severe and critical patients than in common patients (80.4% vs 100.0%, P = .010). Typical features of chest CT images were ground‐glass changes, grid‐form shadow, and paving stone sign. Other manifestations included multiple patches, infiltration, and even consolidation. The distribution characteristics of lesions in all included patients were shown in Table 2. The lesions involved one lobe (7 vs 0 cases), two lobes (9 vs 0 cases), three lobes (7 vs 1 cases), four lobes (10 vs 2 cases), and bilateral whole lung (13 vs 36 cases). Apparently severe and critical patients have more lobes damage than common patients (P < .001).
Table 2.
The characteristics of chest CT of patients infected with SARS‐CoV‐2
| Overall (n = 85) | General group (n = 46) | Severe and cirtical group (n = 39) | P value | |
|---|---|---|---|---|
| Lung | .010 | |||
| Unilateral involvement | 9 (10.6%) | 9 (19.6%) | 0 (0) | |
| Bilateral involvement | 76 (89.4%) | 37 (80.4%) | 39 (100%) | |
| Lobe | <.001 | |||
| 1 | 7 (8.2%) | 7 (15.2%) | 0 (0) | |
| 2 | 9 (10.6%) | 9 (19.6%) | 0 (0) | |
| 3 | 8 (9.4%) | 7 (15.2%) | 1 (2.6%) | |
| 4 | 12 (14.1%) | 10 (21.7%) | 2 (5.1%) | |
| 5 | 49 (57.6%) | 13 (28.3%) | 36 (92.3%) |
Note: Data are n/N (%). P values comparing normal group and severe and critical group are from Fisher's exact test.
Abbreviations: CT, computed tomography; SARS‐CoV‐2, severe acute respiratory syndrome coronavirus 2.
3.3. Laboratory examination
The results of blood routine showed that WBC count (4.58 × 10⁹·L−1 vs 7.13 × 10⁹·L−1, P = .006), NEU% (67.7% vs 79.3%, P = .002), and NEU count (3.2 × 10⁹·L−1 vs 5.71 × 10⁹·L−1, P = .001) in severe and critical patients were significantly higher than those in common patients. Furthermore, the proportion of WBC count (P = .035) and NEU count (P = .001) above the normal upper limit was significantly higher in severe and critical patients. However, on the contrary, LYM% (18.5% vs 11%, P = .001) and LYM count (0.96 × 10⁹·L−1 vs 0.67 × 10⁹·L−1, P = .019) were lower in severe and critical patients. Besides, the proportion of severely ill patients with LYM counts less than 1 × 10⁹·L−1 is lower than that of common patients (52.2% vs 74.4%, P = .035). There were no significant difference in HGB (127.1 vs 129 g/L, P = .926) and PLT count (157 × 109·L−1 vs 175 × 109·L−1, P = .865) between the two groups. In terms of clotting profile, PT (12.7 vs 13.2 seconds, P = .035) and D‐dimer (211 vs 365 μg·mL−1, P = .025) were significantly elevated in severe and critical patients, while the level of APTT (30.6 vs 29.5 seconds, P = .140) did not differ obviously. In addition, CRP (30.5 vs 58.71 mg·L−1, P = .003) and PCT (0.05 vs 0.07 ng·mL−1, P = .011) were higher in severe and critical patients. For biochemical indicators, the values of AST (36 vs 50 IU·L−1, P = .006) in severe and critical patients were significantly higher than those in common patients, and 45 IU·L−1 may be the threshold. Besides, the level of ALB (38 vs 32.1 g·L−1, P < .001) was significantly lower in common patients. Although the value of creatinine in the severe group was significantly higher than that in the common group (P = .027), there was no significant difference when the threshold was set at 133 μmol·L−1 (P = .265). Last, there were no significant differences in other biochemical indicators and myocardial injury markers (Table 3). Multivariate Logistic regression analysis between NEU, LYM, PCT, CRP, ALB, AST, and severe and critical COVID‐19 found that NEU is an independent risk factor for deterioration, with the threshold of 6.5 × 10⁹·L−1 (P = .039; Table 4).
Table 3.
Laboratory results of patients infected with SARS‐CoV‐2
| Overall (n = 85) | General group (n = 46) | Severe and cirtical group (n = 39) | P value | |
|---|---|---|---|---|
| Blood routine | ||||
| WBC count, ×109·L−1 | 3.67 (5.16‐7.61) | 4.58 (3.53‐6.31) | 7.13 (4.2‐9.03) | .006 |
| <4 | 24 (28.2%) | 15 (32.6%) | 9 (23.1%) | .035 |
| 4‐10 | 50 (58.8%) | 29 (63.0%) | 21 (53.8%) | |
| >10 | 11 (12.9%) | 2 (4.3%) | 9 (23.1%) | |
| NEU, % | 73.55 (62.8‐83.08) | 67.7 (58.0‐75.45) | 79.3 (68.9‐87.25) | .002 |
| NEU count, ×109·L−1 | 3.81 (2.49‐6.60) | 3.2 (2.26‐4.06) | 5.71 (3.05‐8.33) | .001 |
| <6.5 | 64 (75.3%) | 43 (93.5%) | 21 (53.8%) | <.001 |
| ≥6.5 | 21 (24.7%) | 3 (6.5%) | 18 (46.2%) | |
| LYM, % | 16.25 (9.63‐24.8) | 18.5 (14‐28.8) | 11 (6.65‐18.5) | .001 |
| LYM count, ×109·L−1 | 0.74 (0.55‐1.26) | 0.96 (0.60‐1.32) | 0.67 (0.48‐0.98) | .019 |
| <1.0 | 53 (62.4%) | 24 (52.2%) | 29 (74.4%) | .035 |
| ≥1.0 | 32 (37.6%) | 22 (47.8%) | 10 (25.6%) | |
| HGB, g/L | 129 (117.95‐137.08) | 127.1 (118.53‐137.53) | 129 (118.1‐137) | .926 |
| PLT count, ×109·L−1 | 175 (126‐203.5) | 157 (123.5‐206.5) | 175 (126.5‐201.5) | .865 |
| Inflammatory markers | ||||
| CRP, mg·L−1 | 43.27 (24.33‐88.15) | 30.5 (14.13‐66.45) | 58.71 (37.45‐119.26) | .003 |
| PCT, ng·mL−1 | 0.05 (0.05‐0.14) | 0.05 (0.05‐0.09) | 0.07 (0.05‐0.21) | .011 |
| Coagulation | ||||
| PT, s | 12 (12.95‐13.88) | 12.7 (11.6‐13.3) | 13.2 (12.35‐14.15) | .035 |
| APTT, s | 30.15 (28‐32.2) | 30.6 (29.05‐32.3) | 29.5 (26.3‐31.9) | .140 |
| D‐dimer, μg·mL−1 | 268 (150‐561) | 211 (146‐352) | 365 (162‐2563) | .025 |
| Myocardial enzymes | ||||
| CK, IU·L−1 | 101 (63‐194) | 86 (66.5‐166.5) | 119.5 (61.25‐220) | .352 |
| ≤185 | 61 (71.8%) | 35 (76.1%) | 26 (66.7%) | .336 |
| >185 | 22 (28.2%) | 11 (23.9%) | 13 (33.3%) | |
| LDH, U·L−1 | 291 (233‐428) | 279 (220.75‐361) | 364 (236‐507) | .054 |
| ≤245 | 28 (32.9%) | 14 (30.4%) | 14 (35.9%) | .593 |
| >245 | 57 (67.1%) | 32 (69.6%) | 25 (64.1%) | |
| TnI, μg·L−1 | 8.3 (3.8‐18.6) | 5.8 (2.7‐9.83) | 9.15 (5.15‐22.65) | .064 |
| Biochemical indicators | ||||
| ALT, IU·L−1 | 29 (20‐49) | 26 (20‐41) | 38 (21.5‐59.5) | .042 |
| ≤50 | 66 (77.6%) | 39 (84.8%) | 27 (69.2%) | .086 |
| >50 | 19 (22.4%) | 7 (15.2%) | 12 (30.8%) | |
| AST, IU·L−1 | 38 (26.25‐66.5) | 36 (23.5‐45.5) | 50 (31.5‐72) | .006 |
| ≤45 | 52 (61.2%) | 34 (73.9%) | 18 (46.2%) | .009 |
| >45 | 33 (38.8%) | 12 (26.1%) | 21 (53.8%) | |
| ALB, g·L−1 | 35.55 (31.78‐39.3) | 38.0 (34.8‐40) | 32.1 (30.25‐37.25) | <.001 |
| TBIL, μmol·L−1 | 10.6 (8.53‐14.08) | 9.9 (8‐13.1) | 11.8 (9.55‐19.05) | .059 |
| Cr, μmol·L−1 | 69.55 (59.85‐85.98) | 67 (55.4‐80.45) | 76.7 (66.6‐99.45) | .027 |
| ≤133 | 80 (94.1%) | 45 (97.8%) | 35 (89.7%) | .265 |
| >133 | 5 (5.9%) | 1 (2.2%) | 4 (10.3%) |
Note: Data are median (IQR) or n/N (%). P values comparing normal group and severe and critical group are from the χ 2 test, Fisher's exact test or Mann‐Whitney rank‐sum test.
Abbreviations: ALB, albumin; ALT, alanine aminotransferase; APTT, activated partial thromboplastin time; AST, aspartate aminotransferase; CK, creatine kinase; Cr, creatinine; CRP, C‐reactive protein; HGB, hemoglobin; IQR, interquartile range; LYM, lymphocyte; NEU, neutrophil; PCT, procalcitonin; PLT, platelet; PT, prothrombin time; SARS‐CoV‐2, severe acute respiratory syndrome coronavirus 2; TnI, troponin I; WBC, White blood cell.
Table 4.
Regression analysis of risk factors of severe and critical COVID‐19
| Factors | B | SE | Wals | P | OR | OR (95% CI) | |
|---|---|---|---|---|---|---|---|
| Lower limit | Upper limit | ||||||
| NEU count | 2.5 | 1.211 | 4.266 | .039 | 12.188 | 1.136 | 130.738 |
| LYM count | 0.965 | 0.788 | 1.499 | .221 | 2.624 | 0.56 | 12.295 |
| CRP | 0.935 | 0.728 | 1.646 | .199 | 2.546 | 0.611 | 10.613 |
| PCT | −0.089 | 0.604 | 0.022 | .882 | 0.915 | 0.28 | 2.986 |
| ALB | 0.461 | 0.643 | 0.514 | .473 | 1.586 | 0.45 | 5.594 |
| AST | 0.266 | 0.844 | 0.099 | .753 | 1.304 | 0.249 | 6.82 |
Abbreviations: ALB, albumin; AST, aspartate aminotransferase; CI, confidence interval; COVID‐19, coronavirus disease 2019; CRP, C‐reactive protein; LYM, lymphocyte; NEU, neutrophil; OR, odds ratio; PCT, procalcitonin; SE, standard error.
4. DISCUSSION
Since SARS‐CoV‐2 was found in Wuhan City, Hubei Province in December 2019, it has spread rapidly all over the country and the world. 5 The virus transmission through fecal‐oral, prolonged exposure in the closed field, aerosol transmission in a high concentration environment, and indirect transmission of the conjunctiva are not excluded. 6 The clinical features are fever, dry cough, persistent high fever in severe cases, and ARDS, sepsis, bleeding and coagulation dysfunction in critical cases. 3
The detection of viral nucleic acid in the respiratory tract or blood samples is the main method for the diagnosis of COVID‐19, which can be combined with epidemiology and imaging to improve the accuracy. 5 The treatment principle of the disease is, on the basis of symptomatic treatment, to actively prevent and cure complications, to prevent secondary infection, and to provide timely organ function support. 5 There are no specific drugs for this infected disease, while some antiviral drugs that may be effective are recommended in China, such as interferon‐alpha, lopiravir/ritonavir, ribavirin, chloroquine phosphate, and abidor. 5 These drugs are still in clinical trials and their efficacy against SARS‐CoV‐2 is still controversial. Lopiravir/ritonavir is an inhibitor of HIV protease and has previously been used in the treatment of HIV infection. 7 The structure of Middle East respiratory syndrome coronavirus (MERS‐CoV) is similar to SARS‐CoV‐2 and both of them belong to family Coronaviridae. The combination of lopinavir/ritonavir and interferon‐beta‐1b had been shown effective treatments in common marmosets infected with MERS‐CoV. 8 In addition, remdesivir had been proven to improve pulmonary function and reduce lung viral loads and severe lung pathology in mice infected with MERS‐CoV. 9 Remdesivir, a nucleoside analog and an RNA‐dependent RNA polymerase inhibitor, showed anti‐CoV activity in both cell experiments and animal experiments. 10 , 11 , 12 So remdesivir is considered to be a potential drug for the treatment of SARS‐CoV‐2 infection. In the United States, the first confirmed COVID‐19 patient's clinical condition improved after the application of remdesivir. 13 In China, the safety and efficacy of remdesivir in the treatment of COVID‐19 are still evaluated by multicenter, double‐blind, randomized, controlled phase III clinical trial. Recent studies demonstrated that convalescent plasma may be safe and effective in the treatment of COVID‐19. 14
In this study, we collected a cohort of 85 patients with viral RNA‐confirmed SARS‐CoV‐2 infection. The ratio of male to female was 45:40, indicating that men and women are generally susceptible to SARS‐CoV‐2. However compared with female patients, male patients accounted for a higher proportion of severe and critical cases. Older patients were at higher risk for disease progression. In addition, clinical data suggested that severe and critical patients often incorporated more basic diseases, such as hypertension and coronary heart disease. This suggests that COVID‐19 patients with hypertension and coronary heart disease may require ICU care later. Chest CT before admission suggested that COVID‐19 patients with bilateral involvement or multiple lobes involvement were more likely to deteriorate to severe pneumonia. We observed a greater increase in NEU count, PCT level, CRP level, and a greater decrease in lymphocyte count in critically ill patients. This suggests that disease progression in COVID‐19 patients may be associated with bacterial infection and impaired cellular immunity. In addition, AST was significantly increased and albumin levels were significantly reduced in severe and critical patients, suggesting that the SARS‐CoV‐2 virus may damage liver cells and impair the synthesis function of the liver. Logistic regression analysis showed that NEU is an independent risk factor for deterioration, with the threshold of 6.5 × 10⁹·L−1, suggesting that a combination of bacterial infections may be the most important factor in worsening the condition.
In conclusion, a significant number of patients infected with SARS‐CoV‐2 may progress to severe illness or even death. In the early stage of COVID‐19, we can predict a patient's risk of progression by combining laboratory tests with chest CT. We concluded that the laboratory independent risk factor for the progression of COVID‐19 pneumonia is NEU count, with the threshold of 6.5 × 10⁹·L−1. In addition, COVID‐19 patients with bilateral lung involvement or multiple lobes involvement should be taken seriously and actively treated to prevent deterioration of the disease.
CONFLICT OF INTERESTS
The authors declare that there are no conflict of interests.
AUTHOR CONTRIBUTIONS
Writing: CW; data collection: SH, LW, and ML; data analysis: CW and HL.
Wang C‐Z, Hu S‐L, Wang L, Li M, Li H‐T. Early risk factors of the exacerbation of coronavirus disease 2019 pneumonia. J Med Virol. 2020;92:2593–2599. 10.1002/jmv.26071
REFERENCES
- 1. Wang X, Zhang X, He J. Challenges to the system of reserve medical supplies for public health emergencies: reflections on the outbreak of the severe acute respiratory syndrome coronavirus 2 (SARS‐CoV‐2) epidemic in China. Biosci Trends. 2020;14:17‐18. 10.5582/bst.2020.01043 [DOI] [PubMed] [Google Scholar]
- 2. Guan WJ, Ni ZY, Hu Y, et al. Clinical characteristics of coronavirus disease 2019 in China. N Engl J Med. 2020;382(18):1708–1720. 10.1056/NEJMoa2002032 [DOI] [PMC free article] [PubMed] [Google Scholar]
- 3. Huang C, Wang Y, Li X, et al. Clinical features of patients infected with 2019 novel coronavirus in Wuhan, China. Lancet. 2020;15(10223):497‐506. 10.1016/S0140-6736(20)30183-5 [DOI] [PMC free article] [PubMed] [Google Scholar]
- 4.National Health Commission of the People's Republic of China. Diagnosis and treatment of novel coronavirus pneumonia (trial version 7). http://www.nhc.gov.cn/yzygj/s7653p/202003/46c9294a7dfe4cef80dc7f5912eb1989.shtml
- 5. Reusken CBEM, Broberg EK, Haagmans B, et al. Laboratory readiness and response for novel coronavirus (2019‐nCoV) in expert laboratories in 30 EU/EEA countries. Euro Surveill. 2020;25(6). 10.2807/1560-7917.ES.2020.25.6.2000082 [DOI] [PMC free article] [PubMed] [Google Scholar]
- 6. World Health Organization . Question and answer on coronaviruses. February 11, 2020. http://www.who.int/news-room/q-a-detail/q-a-coronaviruses
- 7. Hicks C, King MS, Gulick RM, et al. Long‐term safety and durable antiretroviral activity of lopinavir/ritonavir in treatment‐naï patients: 4‐year follow up study. AIDS. 2004;18(5):775‐779. [DOI] [PubMed] [Google Scholar]
- 8. Momattin H, Al‐Ali AY, Al‐Tawfiq JA. A systematic review of therapeutic agents for the treatment of the Middle East respiratory syndrome coronavirus (MERS‐CoV). Travel Med Infect Dis. 2019;30:9‐18. [DOI] [PMC free article] [PubMed] [Google Scholar]
- 9. Kim UJ, Won EJ, Kee SJ, Jung SI, Jang HC. Combination therapy with lopinavir/ritonavir, ribavirin and interferon‐α for Middle East respiratory syndrome. Antivir Ther. 2016;21(5):455‐459. [DOI] [PubMed] [Google Scholar]
- 10. Sheahan TP, Sims AC, Graham RL, et al. Broad‐spectrum antiviral GS‐5734 inhibits both epidemic and zoonotic coronaviruses. Sci Transl Med. 2017;28(396):eaal3653. 10.1126/scitranslmed.aal3653 [DOI] [PMC free article] [PubMed] [Google Scholar]
- 11. Agostini ML, Andres EL, Sims AC, et al. Coronavirus susceptibility to the antiviral remdesivir (GS‐5734) is mediated by the viral polymerase and the proofreading exoribonuclease. mBio. 2018;6(2):9. 10.1128/mBio.00221-18 [DOI] [PMC free article] [PubMed] [Google Scholar]
- 12. Sheahan TP, Sims AC, Leist SR, et al. Comparative therapeutic efficacy of remdesivir and combination lopinavir, ritonavir, and interferon beta against MERS‐CoV. Nat Commun. 2020;11:222. [DOI] [PMC free article] [PubMed] [Google Scholar]
- 13. Holshue ML, DeBolt C, Lindquist S, et al. First case of 2019 novel coronavirus in the United States. N Engl J Med. 2020;382:929‐936. 10.1056/NEJMoa2001191 [DOI] [PMC free article] [PubMed] [Google Scholar]
- 14. Chen L, Xiong J, Bao L, Shi Y. Convalescent plasma as a potential therapy for COVID‐19. Lancet Infect Dis. 2020;27(20):30141‐30149. [DOI] [PMC free article] [PubMed] [Google Scholar]