

Abstract
Mortality is high among severe patients with 2019 novel coronavirus‐infected disease (COVID‐19). Early prediction of progression to severe cases is needed. We retrospectively collected patients with COVID‐19 in two hospital of Chongqing from 1st January to 29th February 2020. At admission, we collected the demographics and laboratory tests to predict whether the patient would progress to severe cases in hospitalization. Severe case was confirmed when one of the following criteria occurred: (a) dyspnea, respiratory rate ≥30 breaths/min, (b) blood oxygen saturation ≤93%, and (c) PaO2/FiO2 ≤ 300 mm Hg. At admission, 348 mild cases were enrolled in this study. Of them, 20 (5.7%) patients progressed to severe cases after median 4.0 days (interquartile range: 2.3‐6.0). Pulmonary inflammation index, platelet counts, sodium, C‐reactive protein, prealbumin, and PaCO2 showed good distinguishing power to predict progression to severe cases (each area under the curve of receiver operating characteristics [AUC] ≥ 0.8). Age, heart rate, chlorine, alanine aminotransferase, aspartate aminotransferase, procalcitonin, creatine kinase, pH, CD3 counts, and CD4 counts showed moderate distinguishing power (each AUC between 0.7‐0.8). And potassium, creatinine, temperature, and D‐dimer showed mild distinguishing power (each AUC between 0.6‐0.7). In addition, higher C‐reactive protein was associated with shorter time to progress to severe cases (r = −0.62). Several easily obtained variables at admission are associated with progression to severe cases during hospitalization. These variables provide a reference for the medical staffs when they manage the patients with COVID‐19.
Keywords: coronavirus, critical care, pneumonia, predictors
Highlights
Pulmonary inflammation index, platelet counts, sodium, C‐reactive protein, prealbumin, and PaCO2 showed good distinguishing power to predict progression to severe cases.
Pulmonary inflammation index, platelet counts, sodium, C‐reactive protein, prealbumin, and PaCO2 showed good distinguishing power to predict progression to severe cases.
Potassium, creatinine, temperature, and D‐dimer showed mild distinguishing power to predict progression to severe cases.
Abbreviations
- ALT
alanine aminotransferase
- APTT
activated partial thromboplastin time
- AST
aspartate aminotransferase
- AUC
area under the curve of receiver operating characteristics
- CI
confidence interval
- COVID‐19
2019 novel coronavirus‐infected disease
- CT
computed tomography
- OR
odds ratio
- PII
pulmonary inflammation index
- RT‐PCR
real‐time reverse‐transcription–polymerasechain‐reaction
- Se
sensitivity
- Sp
specificity
1. INTRODUCTION
The outbreak of a novel coronavirus‐infected disease (COVID‐19) occurred in Wuhan, China at the end of 2019. The etiology is a novel betacoronavirus, named severe acute respiratory syndrome coronavirus 2 (SARS‐CoV‐2), and the most probable origin is bat. 1 , 2 The main clinical feature was fever, dry cough, dyspnea, myalgia, and fatigue. 3 , 4 On chest computed tomography (CT), ground‐glass opacity was the most common radiologic finding. 5 Person‐to‐person transmission has been identified at early stage. 6 , 7 The median incubation period was 5.2 days and the basic reproductive number was estimated to be 2.2. 6 People are all generally susceptible to the virus. 8
As of 24 May 2020, 84 525 cases were recorded in China. 9 The proportion of severe and critical cases was 14% and 5%, respectively. 10 The mortality was 5.5% in China and 6.5% worldwide. 9 However, it increased to 49% among critical ill cases. As the high mortality in severe cases, early identification of the patients who would progress to severe cases is important. Therefore, we aimed to identify the risk factors collected at admission to predict the mild patients who would progress to severe cases during hospitalization.
2. METHODS
This was a retrospective observational study collected patients with COVID‐19 from 1st January to 29th February 2020. Data were extracted from two centers of Chongqing, China. One center is in Chongqing Three Gorges Central Hospital and the other is in Chongqing Public Health Medical Center. Nasophrygeal swab or anal swab even sputum was obtained and real‐time reverse‐transcription‐polymerase chain reaction (RT‐PCR) assay for SARS‐CoV‐2 was tested. In some patients with high probability of COVID‐19, multiple tests were performed. The diagnosis of COVID‐19 was confirmed by positive RT‐PCR assay. All the patients were managed according to the protocols made by National Health Commission of China. The study protocol was approved by the Ethics Committee of the First Affiliated Hospital of Chongqing Medical University (No. 20200601). As the emerging infection disease and the retrospective design, the informed consent was waived.
As the aim of this study was to identify the risk factors to predict whether the patients would progress to severe cases, we only enrolled the nonsevere cases at admission. Based on protocols made by National Health Commission of China, the severe patients were defined when they meet one of three criteria: (a) dyspnea, respiratory rate >30 breaths/min, (b) oxygen saturation <93% in ambient air, (c) PaO2/FiO2 < 300mm Hg. 11 Patients were followed up to discharge or became severe because some severe cases were still in hospitalization. And the time from nonsevere to severe was recorded.
We extracted the data from the medical records. Three kinds of data were collected, basic information, laboratory tests, and radiographic imaging. Basic information included age, sex, underlying disease, temperature, heart rate, and respiratory rate. Laboratory tests included white blood cell counts, lymphocyte counts, platelet counts, hemoglobin, potassium, sodium, chlorine, creatinine, blood urea nitrogen, bilirubin, C‐reactive protein, creatine kinase, prealbumin, albumin, pH, PaCO2, PaO2 and so on. The chest CT was collected and the pulmonary inflammation index (PII) was calculated. The PII = (distribution score + size score)/40 × 100%. 12 Distribution score: scored according to the lesion distribution, one score for each lung segment, and 20 scores for left and right lung. Lesion size score: scored according to whether the lesion occupied more than 50% of the lung segment volume, one score for ≥50%, and zero score for <50%.
2.1. Statistical analysis
Data were analyzed with statistical software (SPSS Inc., Chicago, IL). Continuous variables were reported as mean value and standard deviation or median value and interquartile range when appropriate. The differences between groups were analyzed with the use of unpaired thebStudent t test or the Mann‐Whitney U test. Qualitative and categorical variables were reported as numbers and percentages, and the differences among groups were analyzed using the χ 2 tests or Fisher's exact tests. In the patients who progressed to severe cases, the correlation between C‐reactive protein and time from admission to progress to severe cases was calculated. A P value less than .05 indicated statistically significant difference.
The power of prediction whether the patients would progress to severe cases during hospitalization was tested using the area under the receiver operating characteristic curves (AUC). The distinguishing power was stratified as excellent, good, moderate, and mild when the AUC ≥ 0.9, between 0.8 and 0.9, between 0.7 and 0.8, and between 0.6 and 0.7, respectively. The optimal cutoff value was chosen by the maximum Youden index. 13 At the same time, the sensitivity (Se) and specificity (Sp) was calculated.
3. RESULTS
We screened 397 patients for eligibility (Figure 1). Forty four patients were severe cases at admission and five patients' data were unavailable. Finally, 348 nonsevere cases at admission were enrolled in this study. Of the 348 nonsevere patients, 20 cases (5.7%) deteriorated and became severe after median 4.0 days (interquartile range, 2.3‐6.0). Of the 20 severe cases, eight received conventional oxygen therapy, nine received noninvasive ventilation, two received high flow nasal cannula, and one received intubation. The patients who progressed to severe cases were older than nonsevere cases (Table 1). They also had higher temperature, higher heart rate, higher PII, higher creatinine, higher alanine aminotransferase (ALT), higher aspartate aminotransferase (AST), higher C‐reactive protein, higher procalcitonin, higher creatine kinase, higher pH, lower prealbumin, lower PaCO2, lower platelet counts, lower CD3 counts, lower CD4 counts, lower potassium, lower sodium, and lower chlorine.
Figure 1.
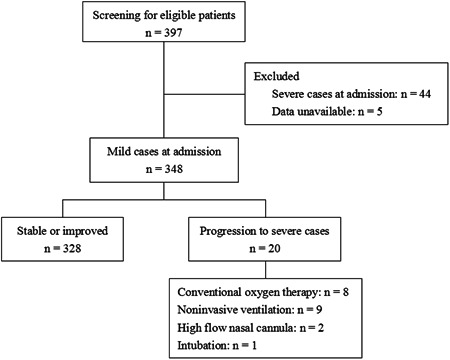
The flow chart
Table 1.
Baseline data
| Nonsevere cases N = 328 | Progress to severe cases N = 20 | P | |
|---|---|---|---|
| Age, y | 44 ± 15 | 58 ± 15 | <.01 |
| Female sex | 158 (48%) | 6 (30%) | .17 |
| Temperature, °C | 37.1 ± 0.7 | 37.6 ± 1.0 | .01 |
| Heart rate, beats/min | 88 ± 12 | 97 ± 10 | <.01 |
| Respiratory rate, breaths/min | 20 ± 1 | 20 ± 1 | .4 |
| PII | 18 ± 13 | 37 ± 18 | <.01 |
| Comorbidity | |||
| Hypertension | 23 (7%) | 4 (20%) | .06 |
| Diabetes mellitus | 9 (3%) | 2 (10%) | .13 |
| Chronic kidney disease | 1 (0.3%) | 0 (0%) | >.99 |
| Chronic liver disease | 9 (3%) | 2 (10%) | .13 |
| Chronic heart disease | 5 (2%) | 0 (0%) | >.99 |
| Chronic respiratory disease | 3 (1%) | 0 (0%) | >.99 |
| Laboratory tests | |||
| White blood cell counts, ×109/L | 5.5 ± 2.1 | 4.6 ± 1.6 | .08 |
| Neutrophil percentage, % | 63 ± 12 | 66 ± 11 | .39 |
| Lymphocyte counts, ×109/L | 1.3 (1.0‐1.7) | 1.1 (0.9‐4.3) | .9 |
| Lymphocyte percentage, % | 27 ± 11 | 29 ± 16 | .48 |
| Neutrophil to lymphocyte ratio | 3.1 ± 2.6 | 2.9 ± 1.7 | .69 |
| Platelet counts, ×109/L | 196 ± 75 | 127 ± 34 | <.01 |
| Hemoglobin, mg/dL | 135 ± 18 | 136 ± 15 | .9 |
| Potassium, mmol/L | 4.1 ± 0.5 | 3.8 ± 0.5 | .01 |
| Sodium, mmol/L | 139 ± 3 | 135 ± 3 | <.01 |
| Chlorine, mmol/L | 103 ± 4 | 99 ± 3 | <.01 |
| Creatinine, μmol/L | 67 ± 18 | 81 ± 27 | <.01 |
| Blood urea nitrogen, mmol/L | 4.0 ± 1.4 | 4.1 ± 2.6 | .74 |
| Total bilirubin, μmol/L | 14.2 ± 10.2 | 13.4 ± 6.6 | .74 |
| ALT, U/L | 28 ± 21 | 43 ± 31 | <.01 |
| AST, U/L | 28 ± 22 | 45 ± 34 | <.01 |
| C‐reactive protein, mg/L | 7 (2‐21) | 47 (21‐64) | <.01 |
| Procalcitonin, ng/mL | 0.03 (0.02‐0.05) | 0.05 (0.04‐0.10) | <.01 |
| Creatine kinase, U/L | 65 (45‐94) | 161 (68‐330) | .01 |
| PT, seconds | 11.5 ± 2.0 | 12.1 ± 2.4 | .27 |
| APTT, seconds | 33.2 ± 8.1 | 37.8 ± 8.1 | .02 |
| FIB, μg/ml | 3.9 ± 1.0 | 4.6 ± 0.8 | .02 |
| D‐dimer, mg/L | 0.18 (0.11‐0.31) | 0.26 (0.16‐0.55) | .07 |
| Prealbumin, mg/L | 227 ± 77 | 148 ± 54 | <.01 |
| Albumin, g/L | 43 ± 6 | 41 ± 3 | .13 |
| Arterial blood gas tests | |||
| pH | 7.40 ± 0.04 | 7.45 ± 0.04 | <.01 |
| PaCO2, mm Hg | 42 ± 5 | 37 ± 4 | <.01 |
| PaO2, mm Hg | 88 ± 20 | 84 ± 25 | .54 |
| Lac, mmol/L | 2.2 ± 0.9 | 2.0 ± 0.6 | .41 |
| Lymphocyte subsets | |||
| CD3, counts/μL | 928 ± 471 | 618 ± 274 | .05 |
| CD4, counts/μL | 484 ± 257 | 320 ± 153 | .02 |
| CD8, counts/μL | 329 ± 186 | 243 ± 148 | .09 |
| CD4/CD8 | 1.7 ± 0.9 | 1.3 ± 0.6 | .19 |
Abbreviations: ALT, alanine aminotransferase; APTT, activated partial thromboplastin time; AST, aspartate aminotransferase; FIB, fibrinogen; PII, pulmonary inflammation index; PT, prothrombin time.
The AUC was ≥0.80 in PII, platelet counts, sodium, C‐reactive protein, prealbumin, and PaCO2 to predict whether the patients would progress to severe cases, indicating that the distinguishing power was good (Table 2). The age, heart rate, chlorine, ALT, AST, procalcitonin, creatine kinase, pH, CD3 counts, and CD4 counts reached moderate distinguishing power. The potassium, creatinine temperature, and D‐dimer reached mild distinguishing power.
Table 2.
Prediction of progression to severe cases using the variables collected at admission
| AUC (95% CI) | Cutoff value | Se, % | Sp, % | |
|---|---|---|---|---|
| Good distinguishing power | ||||
| PII | 0.80 (0.74‐0.85) | >25% | 75 | 76 |
| Platelet counts, ×109/L | 0.81 (0.76‐0.85) | ≤174 | 100 | 56 |
| Sodium, mmol/L | 0.82 (0.78‐0.86) | ≤138 | 94 | 62 |
| C‐reactive protein, mg/L | 0.82 (0.77‐0.86) | >18 | 83 | 73 |
| Prealbumin, mg/L | 0.80 (0.73‐0.85) | ≤151 | 64 | 85 |
| PaCO2, mm Hg | 0.80 (0.74‐0.86) | ≤41 | 93 | 58 |
| Moderate distinguishing power | ||||
| Age, y | 0.75 (0.70‐0.80) | >53 | 65 | 75 |
| Heart rate, beats/min | 0.72 (0.67‐0.76) | >90 | 72 | 64 |
| Chlorine, mmol/L | 0.78 (0.73‐0.82) | ≤101 | 72 | 7 |
| ALT, U/L | 0.72 (0.67‐0.76) | >22 | 89 | 54 |
| AST, U/L | 0.71 (0.65‐0.75) | >34 | 61 | 81 |
| Procalcitonin, ng/mL | 0.74 (0.69‐0.78) | >0.04 | 79 | 65 |
| Creatine kinase, U/L | 0.75 (0.70‐0.80) | >118 | 61 | 82 |
| pH | 0.75 (0.69‐0.81) | >7.40 | 87 | 49 |
| CD3, counts/μL | 0.71 (0.63‐0.78) | ≤553 | 67 | 77 |
| CD4, counts/μL | 0.70 (0.64‐0.76) | ≤403 | 86 | 55 |
| Mild distinguishing power | ||||
| Potassium, mmol/L | 0.68 (0.63‐0.73) | ≤3.7 | 61 | 79 |
| Creatinine, μmol/L | 0.64 (0.59‐0.69) | >68 | 6 | 58 |
| Temperature, °C | 0.65 (0.59‐0.70) | >37.3 | 59 | 74 |
| D‐dimer, mg/L | 0.64 (0.57‐0.70) | >0.14 | 88 | 39 |
Abreviations: ALT, alanine aminotransferase; AST, aspartate aminotransferase; AUC, area under the curve of receiver operating characteristics; CI, confidence interval; PII, Pulmonary inflammation index; Se, sensitivity; Sp, specificity.
When the PII ≤ 25% was set as a reference, the odds ratio (OR) was 6.5 in patients with PII between 26% and 50% and 38.7 in those with PII > 50% (Table 3). When the platelet counts >150 × 109/L was set as a reference, the OR was 4.7 and 14.5 in patients with platelet counts between 101 to 150 × 109/L and ≤100 × 109/L, respectively. Similar ORs of progression to severe cases were found in other variables.
Table 3.
Odds ratio of progression to severe cases stratified by different cutoff values
| OR (95% CI) | P | |
|---|---|---|
| PII | ||
| ≤25% versus 26%‐50% | 6.5 (2.1‐20.5) | <.01 |
| ≤25% versus >50% | 38.7 (8.2‐182.1) | <.01 |
| Platelet counts, ×109/L | ||
| >150 versus 101‐150 | 4.7 (1.4‐15.3) | .01 |
| >150 versus ≤100 | 14.5 (3.9‐55.8) | <.01 |
| Sodium, mmol/L | ||
| >138 versus 135‐138 | 12.9 (2.8‐58.7) | <.01 |
| >138 versus <135 | 21.7 (3.7‐126.2) | <.01 |
| C‐reactive protein, mg/L | ||
| ≤20 versus 21‐40 | 6.1 (1.5‐25.7) | .02 |
| ≤20 versus >40 | 13.4 (4.0‐45.0) | <.01 |
| Prealbumin, mg/L | ||
| >150 versus ≤150 | 6.6 (1.9‐23.1) | <.01 |
| PaCO2, mm Hg | ||
| <35 versus ≥35 | 11.2 (3.1‐40.5) | <.01 |
| Age, y | ||
| ≤55 versus 56‐65 | 3.0 (0.9‐10.5) | .09 |
| ≤55 verssus >65 | 10.9 (3.7‐31.6) | <.01 |
| Heart rate, beats/min | ||
| ≤90 versus 91‐100 | 4.0 (1.2‐13.1) | .02 |
| ≤90 versus >100 | 5.9 (1.7‐20.1) | <.01 |
| Chlorine, mmol/L | ||
| >100 versus ≤100 | 7.3 (2.5‐21.0) | <.01 |
| ALT, U/L | ||
| ≤40 versus >40 | 3.3 (1.2‐8.9) | .02 |
| AST, U/L | ||
| ≤40 versus 41‐60 | 4.4 (1.3‐15.0) | .03 |
| ≤40 versus >60 | 5.8 (1.7‐20.2) | .01 |
| Procalcitonin, ng/mL | ||
| ≤0.03 versus 0.04‐0.10 | 4.5 (1.4‐14.4) | .01 |
| ≤0.03 versus >0.10 | 10.7 (2.4‐46.4) | <.01 |
| Creatine kinase, U/L | ||
| ≤150 versus 151‐300 | 4.0 (1.0‐15.9) | .07 |
| ≤150 versus >300 | 25.1 (7.0‐90.1) | <.01 |
| pH | ||
| >7.45 versus ≤7.45 | 5.3 (1.7‐16.3) | <.01 |
| CD3, counts/μL | ||
| ≤553 | 6.6 (1.6‐28.1) | .01 |
| CD4, counts/μL | ||
| ≤403 | 7.4 (1.6‐33.7) | <.01 |
| Potassium, mmol/L | ||
| >3.7 versus 3.5‐3.7 | 4.2 (1.2‐14.8) | .04 |
| >3.7 versus 5 | 5.3 (1.7‐16.1) | <.01 |
| Creatinine, μmol/L | ||
| ≤100 versus >100 | 6.7 (1.9‐23.4) | <.01 |
| Temperature (°C) | ||
| ≤37.3 versus >37.3 | 4.0 (1.5‐10.9) | <.01 |
Abbreviations: ALT, alanine aminotransferase; AST, aspartate aminotransferase; CI, confidence interval; OR, odds ratio; PII, pulmonary inflammation index.
In the patients who progressed to severe cases, the negative correlation was found between C‐reactive protein and time from admission to severe cases (Figure 2). The correlative coefficient was −0.64. Patients who progressed to severe cases less than 4 days had higher C‐reactive protein than those more than 4 days (61 ± 28 vs 27 ± 21 mg/L; P = .01).
Figure 2.

Correlation between C‐reactive protein and the time from nonsevere to progress to severe cases
4. DISCUSSION
To the best of our knowledge, this is the first study to report so many variables collected at admission to predict the patients who would progress to severe cases during hospitalization. PII, platelet counts, sodium, C‐reactive protein, prealbumin, and PaCO2 reached good distinguishing power to predict progression to severe cases. The age, heart rate, chlorine, ALT, AST, procalcitonin, creatine kinase, pH, CD3 counts, and CD4 counts reached moderate distinguishing power. And the potassium, creatinine temperature and D‐dimer reached mild distinguishing power. In the patients who progressed to severe cases, the C‐reactive protein was negative correlation with the time from admission to progress to severe cases.
The time from disease onset to dyspnea was median 8 days, to development of acute respiratory distress syndrome was median 9 days, and to admission to intensive carfe unit was median 10.5 days. 3 At the early stage, the 28‐day mortality was 61.5% among the critically ill cases. 14 As the fast development and high mortality, early identification of the patients who would progress to severe cases is potential to reduce mortality. Our study originally reported that six variables collected at admission had good predictive power, 10 variables had moderate predictive power, and four variables had mild predictive power. These variables can help the clinical physicians to identify the potential cases who would progress to severe cases. Patients with these variables should be paid more attention even applied intensive care to avoid progression to severe cases.
Abnormalities on chest CT has been found in the patients with COVID‐19. The major findings were ground‐grass opacity in 86% cases, bilateral distribution in 76% cases, peripheral distribution in 33%, consolidation in 29% cases, and crazy paving in 19% of cases. 15 However, this is only a descriptive study. These findings are difficult to predict the disease severity. In another study focused on COVID‐19, a semiquantitative score, PII, was used to assess the abnormalities on chest CT. 12 This study showed the PII was correlated with the values of lymphocyte count, monocyte count, C‐reactive protein, procalcitonin, and temperature. It means that the PII is correlated with the severity of the disease. In our study, we found that PII had good predictive power to assess the disease progression. Compared with the patients with PII ≤ 25%, the risk of progression to severe cases increased to 6.5 folds in patients with PII between 26% and 50% and further increased to 38.7 folds in those with PII more than 50%. Using the PII of 25% as a cutoff value, the Se and Sp to predict disease progression was 75% and 76%, respectively. Therefore, the PII was a good variable to stratify the severity of the patients with COVID‐19.
In our study, we found that the prealbumin but not albumin was a risk factor to predict the patients who would progress to severe cases. The half time of albumin was approximately 20 days but the prealbumin was only 2 days. 16 As the time from disease onset to admission was median 7 days, 3 the albumin did not reflect the real status of the nutrition. In our study, patients with prealbumin less than 150 mg/L were 6.6 folds to progress to severe cases compared with those with prealbumin more than 150 mg/L. As the COVID‐19 had short incubation period, the prealbumin is a good risk factor to predict whether the patients would progress to severe cases.
The Middle East respiratory syndrom coronavirus is similar with SARS‐CoV‐2, and they have similar clinical features. 17 In patients with severe Middle East respiratory syndrome coronavirus pneumonia, increasing in C‐reactive protein levels is correlated with clinical deterioration. 18 However, the correlation between C‐reactive protein and disease severity is unclear in patients with COVID‐19. In our study, we found that patients with higher level of C‐reactive protein were more likely to progress to severe cases, and the level of C‐reactive protein was negative correlated with the time from admission to progression to severe cases. These findings can help the clinical staffs to stratify the patients.
Our study has several limitations. First, this is a retrospective observational study. Some participants had incomplete laboratory tests at admission due to the shortage of medical staffs and lack of management protocols at the early stage. Second, the patients were only followed up to discharge or became severe. It is unable for us to assess the risk factors for poor outcomes. Third, our study found that hypertension was associated with progression to severe cases though it did not reach statistical significance (P = .06). This result was confirmed by another study. 19 Therefore, both the laboratory tests and comorbidity should be considered when the patients with COVID‐19 were managed.
5. CONCLUSIONS
Our study reported 19 potential variables collected at admission to predict the patients who would progress to severe cases. Six variables showed good predictive power, 10 showed moderate predictive power, and four showed mild predictive power. C‐reactive protein is negative correlative with the time from nonsevere to progress to severe cases.
CONFLICT OF INTERESTS
The authors declare that there no conflict of interests.
AUTHOR CONTRIBUTONS
HM, XY, and SG conceived the study, contributed to study design, study management, data acquisition, data interpretation and manuscript preparation, and took responsibility for the integrity of the whole study. JD, XW, and JC contributed to study design, data acquisition, data interpretation and data analysis, and drafted the manuscript. HC, LB, QH, XH, WH, LZ, XW, YL, and CZ contributed to data acquisition, data analysis, data interpretation, and manuscript revision. All of the authors read and approved the final version.
ACKNOWLEDGMENT
The authors thank all the staffs to participate in data collection. This study was support by Chongqing Education Board “new coronavirus infection and prevention” emergency scientific research project and Chongqing Science and Technology Bureau “new crown pneumonia epidemic emergency science and technology special” the fourth batch of projects.
Duan J, Wang X, Chi J, et al. Correlation between the variables collected at admission and progression to severe cases during hospitalization among patients with COVID‐19 in Chongqing. J Med Virol. 2020;92:2616–2622. 10.1002/jmv.26082
Jun Duan, Xiaohui Wang, Jing Chi, Huaming Mou, Xiaofeng Yan, and Shuliang Guo contributed equally to the study.
Contributor Information
Huaming Mou, Email: mouhm2002@aliyun.com.
Xiaofeng Yan, Email: 2429918342@qq.com.
Shuliang Guo, Email: guosl999@sina.com.
REFERENCES
- 1. Zhou P, Yang XL, Wang XG, et al. A pneumonia outbreak associated with a new coronavirus of probable bat origin. Nature. 2020. 10.1038/s41586-020-2012-7 [DOI] [PMC free article] [PubMed] [Google Scholar]
- 2. Wu F, Zhao S, Yu B, et al. A new coronavirus associated with human respiratory disease in China. Nature. 2020. 10.1038/s41586-020-2008-3 [DOI] [PMC free article] [PubMed] [Google Scholar]
- 3. Huang C, Wang Y, Li X, et al. Clinical features of patients infected with 2019 novel coronavirus in Wuhan, China. Lancet. 2020;395:497‐506. [DOI] [PMC free article] [PubMed] [Google Scholar]
- 4. Chen N, Zhou M, Dong X, et al. Epidemiological and clinical characteristics of 99 cases of 2019 novel coronavirus pneumonia in Wuhan, China: a descriptive study. Lancet. 2020;395:507‐513. [DOI] [PMC free article] [PubMed] [Google Scholar]
- 5. Guan WJ, Ni ZY, Hu Y, et al. Clinical characteristics of coronavirus disease 2019 in China. N Engl J Med. 2020. 10.1056/NEJMoa2002032 [DOI] [PMC free article] [PubMed] [Google Scholar]
- 6. Li Q, Guan X, Wu P, et al. Early transmission dynamics in Wuhan, China, of novel coronavirus‐infected pneumonia. N Engl J Med. 2020. 10.1056/NEJMoa2001316 [DOI] [PMC free article] [PubMed] [Google Scholar]
- 7. Chan JF, Yuan S, Kok KH, et al. A familial cluster of pneumonia associated with the 2019 novel coronavirus indicating person‐to‐person transmission: a study of a family cluster. Lancet. 2020;395:514‐523. [DOI] [PMC free article] [PubMed] [Google Scholar]
- 8. Special Expert Group for Control of the Epidemic of Novel Coronavirus Pneumonia of the Chinese Preventive Medicine A . An update on the epidemiological characteristics of novel coronavirus pneumonia COVID‐19. Zhonghua Liu Xing Bing Xue Za Zhi. 2020;41:139‐144. [DOI] [PubMed] [Google Scholar]
- 9. World Health Organization . Coronavirus disease (COVID‐19): situation report—125. https://www.who.int/docs/default-source/coronaviruse/situation-reports/20200524-covid-19-sitrep-125.pdf?sfvrsn=80e7d7f0-2. Accessed 24 May 2020.
- 10. Wu Z, McGoogan JM. Characteristics of and important lessons from the coronavirus disease 2019 (COVID‐19) outbreak in China: summary of a report of 72 314 cases from the Chinese Center for Disease Control and Prevention. JAMA. 2020. 10.1001/jama.2020.2648 [DOI] [PubMed] [Google Scholar]
- 11. Epidemiology Working Group for NCIP Epidemic Response . The epidemiological characteristics of an outbreak of 2019 novel coronavirus diseases (COVID‐19) in China. Zhonghua Liu Xing Bing Xue Za Zhi. 2020; 41:145‐151 [DOI] [PubMed]
- 12. Wu J, Wu X, Zeng W, et al. Chest CT findings in patients with corona virus disease 2019 and its relationship with clinical features. Invest Radiol 2020. 10.1097/RLI.0000000000000670 [DOI] [PMC free article] [PubMed] [Google Scholar]
- 13. Youden WJ. Index for rating diagnostic tests. Cancer. 1950;3(1):32‐35. [DOI] [PubMed] [Google Scholar]
- 14. Yang X, Yu Y, Xu J, et al. Clinical course and outcomes of critically ill patients with SARS‐CoV‐2 pneumonia in Wuhan, China: a single‐centered, retrospective, observational study. Lancet Respir Med. 2020. 10.1016/S2213-2600(20)30079-5 [DOI] [PMC free article] [PubMed] [Google Scholar]
- 15.Kanne JP, Chest CT. Findings in 2019 Novel Coronavirus (2019‐nCoV) Infections from Wuhan, China: Key Points for the Radiologist. Radiology 2020:200241. 10.1148/radiol.2020200241 [DOI] [PMC free article] [PubMed]
- 16. Neyra NR, Hakim RM, Shyr Y, et al. Serum transferrin and serum prealbumin are early predictors of serum albumin in chronic hemodialysis patients. J Ren Nutr. 2000;10:184‐190. [DOI] [PubMed] [Google Scholar]
- 17. Khalid I, Alraddadi BM, Dairi Y, et al. Acute management and long‐term survival among subjects with severe Middle East respiratory syndrome coronavirus pneumonia and ARDS. Respir Care. 2016;61:340‐348. [DOI] [PubMed] [Google Scholar]
- 18. Cheng ZJ, Shan J. Novel coronavirus: where we are and what we know. Infection. 2019:2020. 10.1007/s15010-020-01401-y [DOI] [PMC free article] [PubMed] [Google Scholar]
- 19. Yang J, Zheng Y, Gou X, et al. Prevalence of comorbidities and its effects in patients infected with SARS‐CoV‐2: a systematic review and meta‐analysis. Int J Infect Dis. 2020;94:91‐95. [DOI] [PMC free article] [PubMed] [Google Scholar]